
1 引言
2 资料来源与方法介绍
2.1 资料来源
2.2 方法介绍
3 大范围持续性极端低温事件时空分布特征
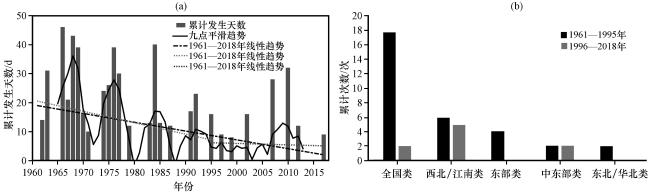
3.1 时间变化特征
3.2 空间分布特征
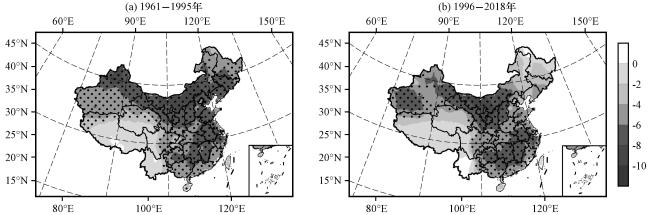
表1 1961 -2018年冬春季41次EPECE的开始日期、 持续时间、 峰值日期、 峰值日覆盖率和类型Table 1 Beginning dates, durations, peak day, coverage in the peak day and types of 41 EPECE in winter and spring from 1961 to 2018 |
| 序号 | 开始日期 | 持续时间/d | 峰值日期 | 峰值日覆盖率 | 类别 | 序号 | 开始日期 | 持续时间/d | 峰值日期 | 峰值日覆盖率 | 类别 |
|---|---|---|---|---|---|---|---|---|---|---|---|
| 1 | 1963-01-02 | 14 | 1963-01-12 | 42% | 全国类 | 22 | 1980-01-29 | 12 | 1980-02-05 | 70% | 全国类 |
| 2 | 1964-01-25 | 11 | 1964-01-31 | 44% | 全国类 | 23 | 1984-01-19 | 13 | 1984-01-26 | 44% | 全国类 |
| 3 | 1964-02-08 | 20 | 1964-02-18 | 61% | 全国类 | 24 | 1984-12-16 | 16 | 1984-12-25 | 69% | 全国类 |
| 4 | 1966-12-20 | 30 | 1967-01-02 | 65% | 全国类 | 25 | 1985-02-17 | 9 | 1985-02-18 | 45% | 东北/华北类 |
| 5 | 1967-02-08 | 8 | 1967-02-11 | 46% | 东部类 | 26 | 1985-03-08 | 15 | 1985-03-10 | 63% | 全国类 |
| 6 | 1967-03-03 | 8 | 1967-03-05 | 58% | 西北/江南类 | 27 | 1985-12-05 | 13 | 1985-12-09 | 45% | 东部类 |
| 7 | 1968-02-02 | 21 | 1968-02-06 | 62% | 全国类 | 28 | 1988-02-26 | 12 | 1988-03-02 | 65% | 全国类 |
| 8 | 1968-12-30 | 10 | 1969-01-02 | 49% | 全国类 | 29 | 1991-12-26 | 8 | 1991-12-28 | 59% | 西北/江南类 |
| 9 | 1969-01-28 | 13 | 1969-01-31 | 79% | 全国类 | 30 | 1992-03-16 | 9 | 1992-03-16 | 37% | 西北/江南类 |
| 10 | 1969-02-14 | 20 | 1969-02-28 | 62% | 东部类 | 31 | 1993-01-14 | 12 | 1993-01-16 | 54% | 中东部类 |
| 11 | 1970-01-02 | 10 | 1970-01-05 | 36% | 中东部类 | 32 | 1993-04-02 | 11 | 1993-04-09 | 44% | 东北/华北类 |
| 12 | 1970-02-25 | 29 | 1970-03-16 | 68% | 全国类 | 33 | 1996-03-22 | 16 | 1996-04-02 | 70% | 全国类 |
| 13 | 1971-02-27 | 16 | 1971-03-06 | 40% | 东部类 | 34 | 1998-03-18 | 9 | 1998-03-20 | 62% | 全国类 |
| 14 | 1972-02-03 | 10 | 1972-02-05 | 59% | 全国类 | 35 | 1999-12-18 | 8 | 1999-12-21 | 39% | 中东部类 |
| 15 | 1974-12-03 | 24 | 1974-12-14 | 54% | 西北/江南类 | 36 | 2002-12-23 | 16 | 2002-12-26 | 51% | 西北/江南类 |
| 16 | 1975-12-07 | 17 | 1975-12-13 | 75% | 西北/江南类 | 37 | 2008-01-20 | 28 | 2008-02-02 | 59% | 西北/江南类 |
| 17 | 1976-03-27 | 9 | 1976-03-29 | 42% | 西北/江南类 | 38 | 2011-01-02 | 20 | 2011-01-10 | 54% | 西北/江南类 |
| 18 | 1976-12-25 | 23 | 1976-12-27 | 73% | 全国类 | 39 | 2011-03-14 | 12 | 2011-03-22 | 50% | 西北/江南类 |
| 19 | 1977-01-27 | 16 | 1977-01-31 | 77% | 全国类 | 40 | 2012-12-30 | 12 | 2013-01-04 | 40% | 中东部类 |
| 20 | 1977-12-30 | 14 | 1978-01-09 | 38% | 全国类 | 41 | 2018-01-23 | 9 | 2018-01-29 | 38% | 西北/江南类 |
| 21 | 1978-02-08 | 16 | 1978-02-13 | 66% | 全国类 |
3.3 不同时段内两类EPECE空间分布特征
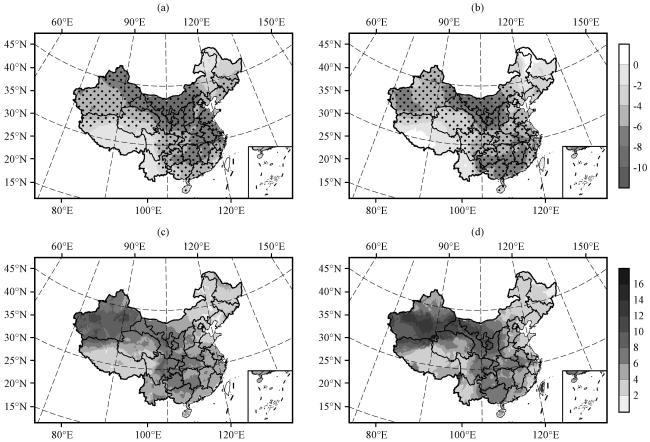
图3 1961 -1995年(左)和1996 -2018年(右)不同年代际两类EPECE峰值日气温距平合成(上, 单位: ℃)及单次事件平均发生天数合成(下, 单位: 天)黑色点区表示通过95%的置信度检验 Fig.3 The distribution of daily mean temperature anomalies (up, unit: ℃) at the peak days and mean days for a single event (down, unit: day) for interdecadal two types of EPECE during 1961 -1995 (left) and 1996 -2018 (right). The black dots have passed the confidence test of 95% |
4 大气环流成因分析
4.1 大气环流场特征
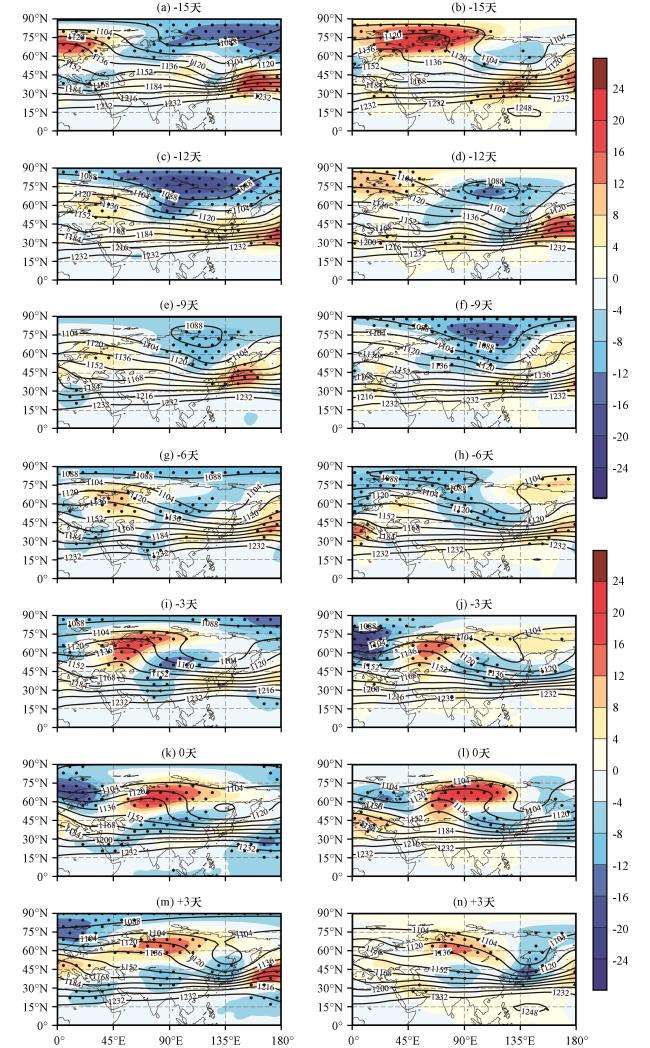
图4 1961—1995年(左)和1996 -2018年(右)不同年代际两类EPECE发生第-15~3天200 hPa位势高度场(等值线)及其距平(彩色区)合成场(单位: dagpm)黑色点区表示通过95%的置信度检验 Fig.4 200 hPa height field (contour) and its anomalies (color area) from fifteen days prior (-15) to three days after (+3) for interdecadal two types of EPECE during 1961 -1995 (left) and 1996 -2018 (right).Unit: dagpm. The black dots have passed the confidence test of 95% |
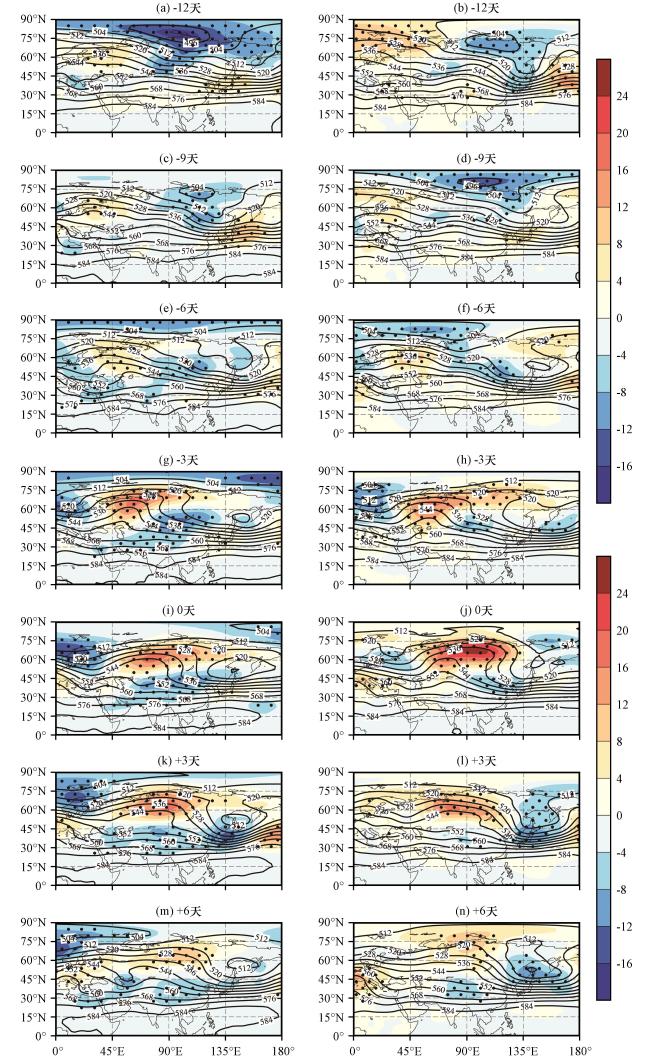
图5 1961 -1995年(左)和1996 -2018年(右)不同年代际两类EPECE发生第-12~6天500 hPa位势高度场(等值线)及其距平(彩色区)合成场(单位: dagpm)黑色点区表示通过95%的置信度检验 Fig.5 500 hPa height field (contour) and its anomalies (shaded) from twelve days prior (-12) to six days after (+6) for interdecadal two types of EPECE during 1961 -1995 (left) and 1996 -2018 (right).Unit: dagpm.The black dots have passed the confidence test of 95% The black dots have passed the confidence test of 95% |
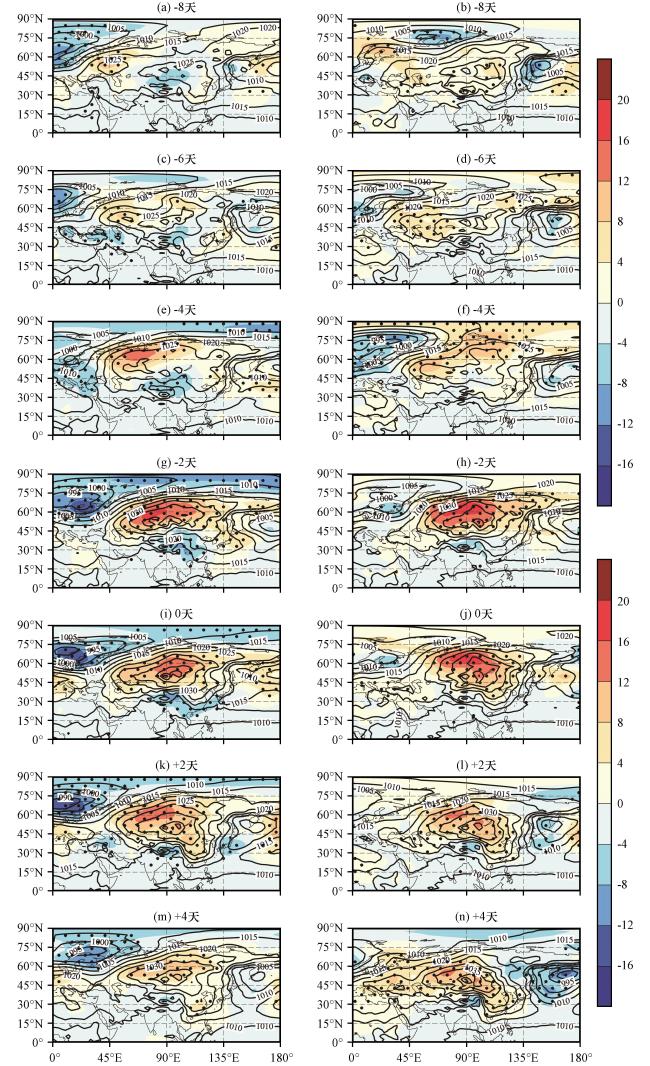
图6 1961 -1995年(左)和1996 -2018年(右)不同年代际两类EPECE发生第-8~4天海平面气压场(等值线)及其距平(彩色区)合成场(单位: hPa)黑色点区表示通过95%的置信度检验 Fig.6 Composite values of sea level pressure (contour) and its anomalies (color area) from eight days prior (-8) to four days after (+4) for interdecadal two types of EPECE during 1961 -1995 (left) and 1996 -2018 (right).Unit: hPa. The black dots have passed the confidence test of 95% |
4.2 定量化指数与Rossby波破碎特征
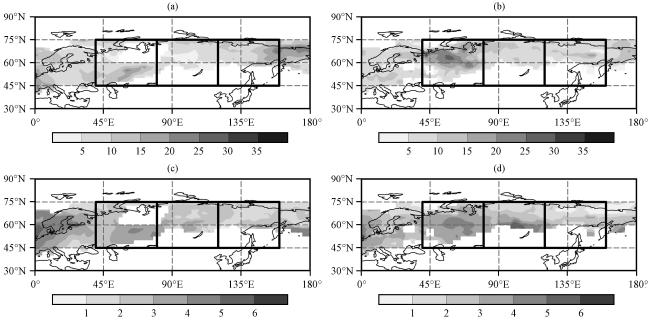
图8 1961 -1995年(左)和1996 -2018年(右)不同年代际两类EPECE发生期间阻塞事件发生频率(上, 单位: %)与强度(下)分布黑色方框表示所选阻高区域 Fig.8 The frequency (up, unit: %) and intensity (down) of blocking high for interdecadal two types of EPECE during 1961 -1995 (left) and 1996 -2018 (right).The black boxes denote the blocking areas that are selected The black boxes denote the blocking areas that are selected |
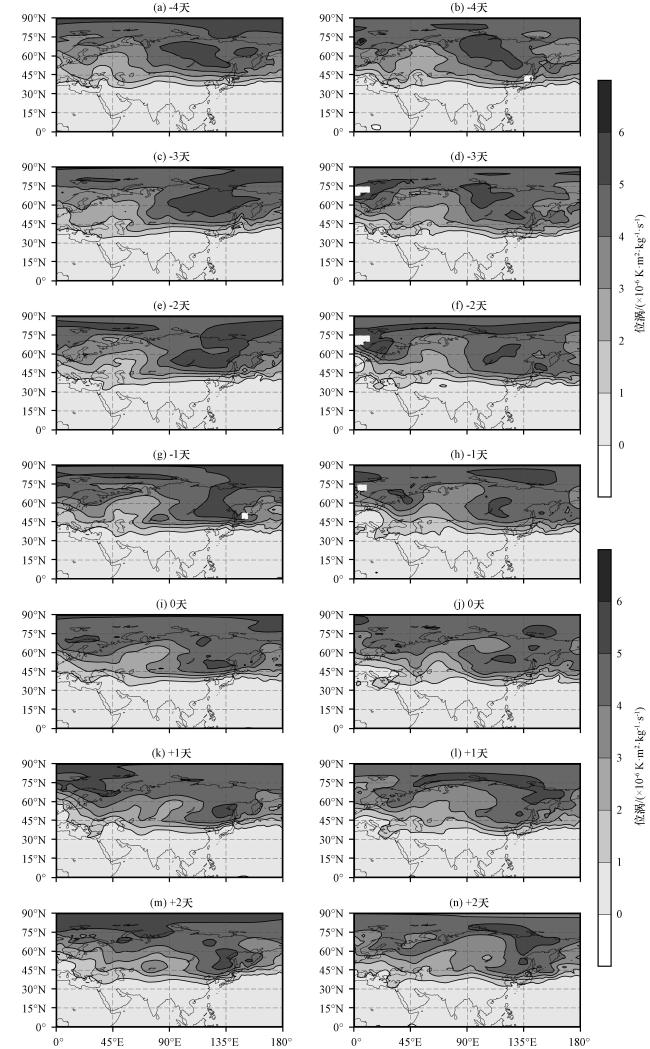
图9 1961 -1995年(左)和1996 -2018年(右)不同年代际两类EPECE发生第-4~2天315 K等熵面上Ertel位涡分布(单位: ×10-6 K∙m2∙kg-1∙s-1)Fig.9 The Ertels PV on the 315 K isentropic surface from four days prior (-4) to two days after (+2) for interdecadal EPECE during 1961 -1995 (left) and 1996 -2018 (right).Unit: ×10-6 K∙m2∙kg-1∙s-1 |