

1 引言
2 资料来源及处理
2.1 资料来源
2.2 观测资料的质量控制和筛选
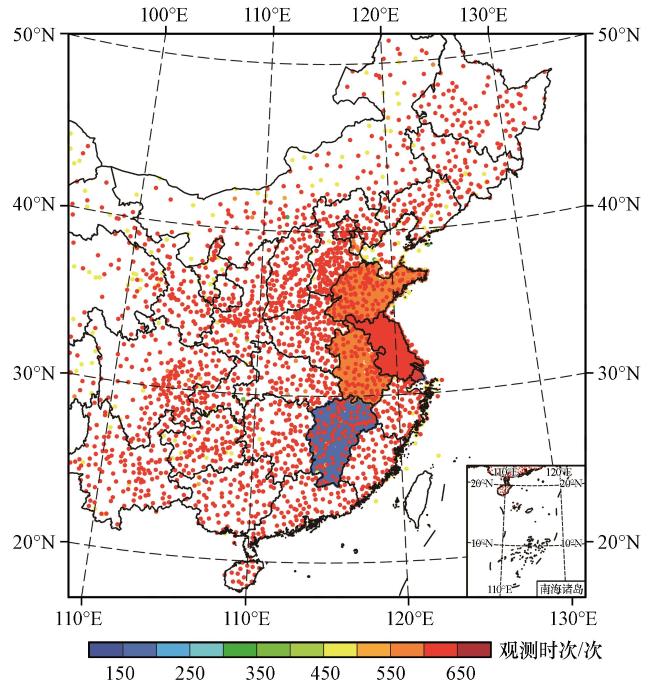
图1 2019年1月1日08:00至30日07:00全国自动站数据量的空间分布Fig.1 Spatial distribution of data volume for automatic station in China from 08:00 on 1 to 07:00 on 30 January 2019 |
3 结果
3.1 月平均温度空间分布特征分析
3.2 再分析资料与自动站观测资料差值的空间分布
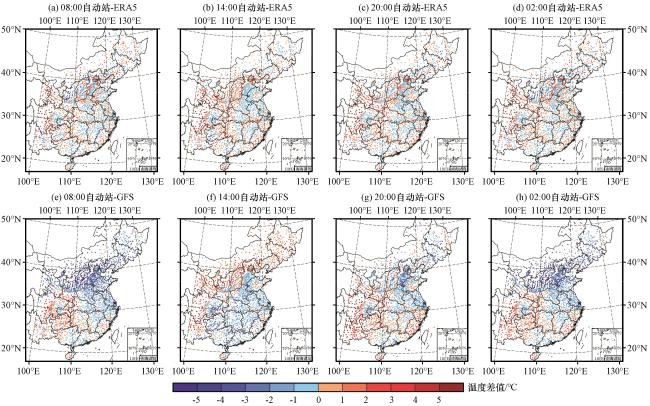
3.3 地面温度的日变化特征
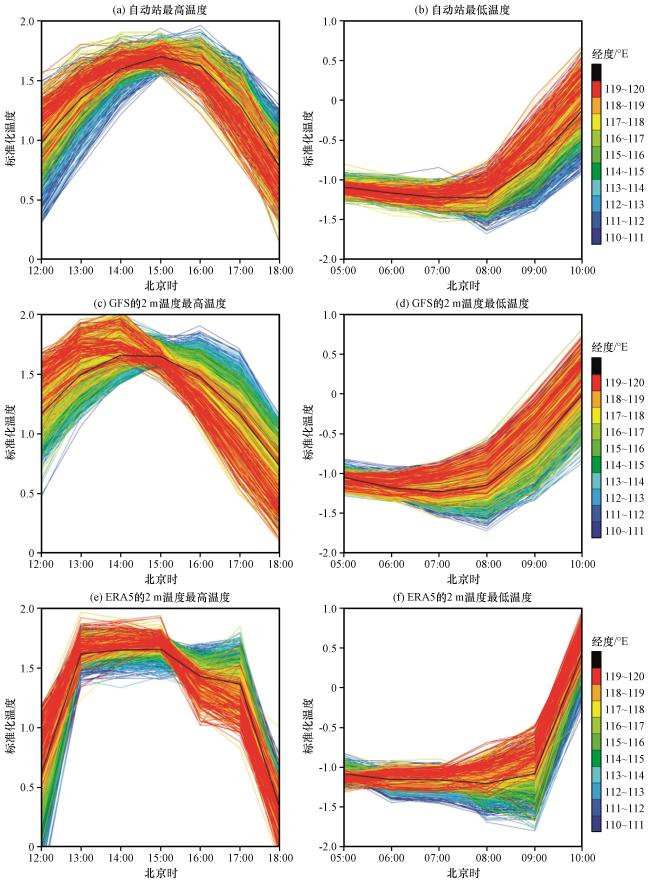
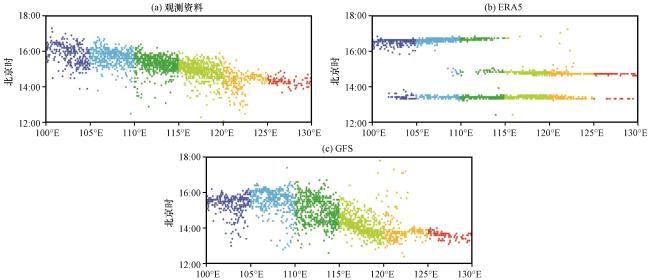
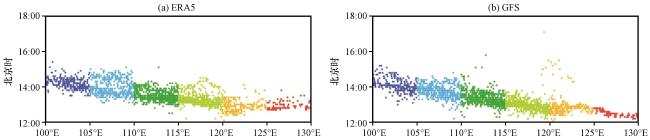
3.4 再分析资料与观测资料的差值特征分析
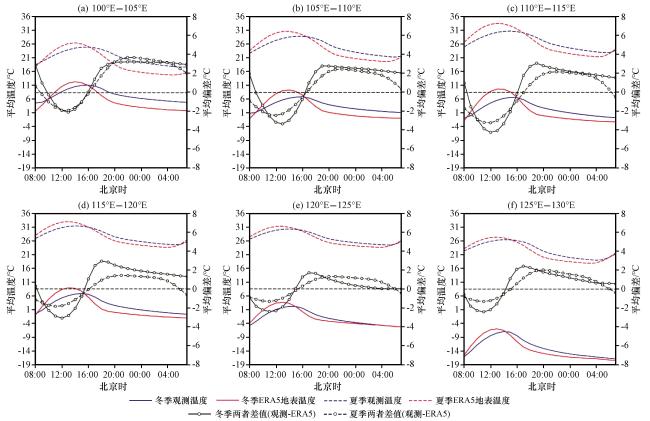
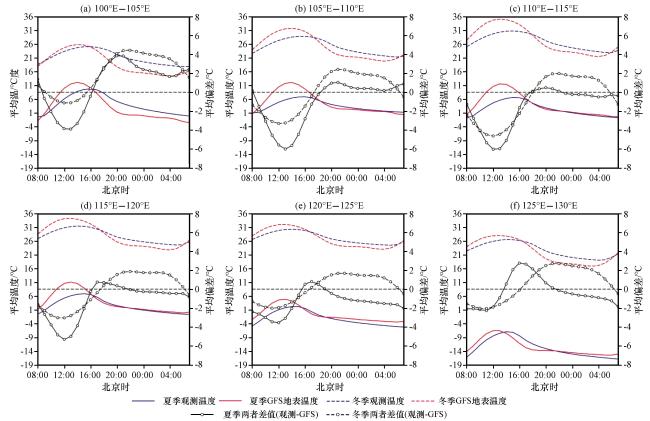
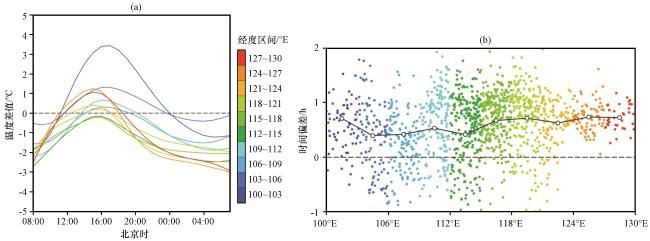
图11 不同经度区间自动站观测温度与GFS的2 m温度差值(观测-GFS)变化曲线图(a)以及(b)最高温度出现时间偏差(观测-GFS)与站点经度的散点(b)分布不同颜色代表不同的经度区间, (b)中黑色曲线为各区间平均值变化曲线Fig.11 The curve of temperature difference between the observation 2-m temperature of GFS in different longitude interval (a); Scatter plot between the differences of highest temperature appearance time between observations and 2-m temperature of GFS (observation-GFS, b).Colors represent longitude ranges, and the black curve in (b) is the average value of the time difference at each interval |
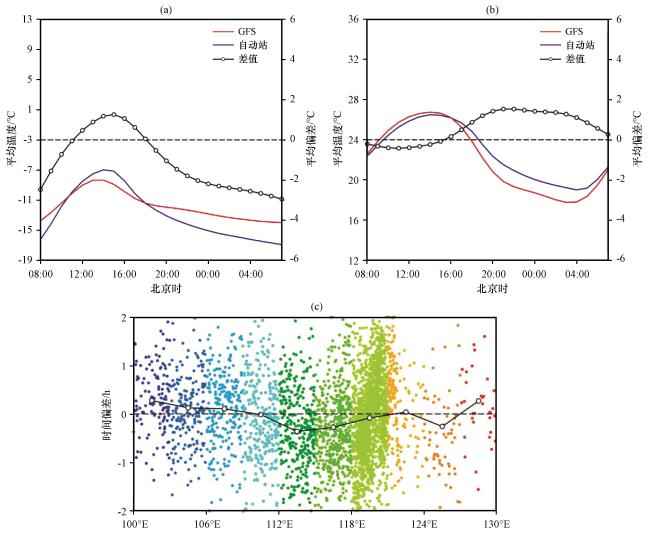


图12 125°E -130°E冬季(a)和夏季(b)自动站观测温度与GFS的2 m温度差值变化曲线图(观测-GFS), 夏季最高温度出现时间偏差与站点经度的散点分布(观测-GFS)(c)不同颜色代表不同的经度区间, 黑色曲线为各区间平均值变化曲线Fig.12 Variation curve of 2 m temperature difference between observation temperature and GFS(observation-GFS) of 125°E -130°E automatic station in winter(a) and summer(b); scatter plot of time deviation of maximum temperature in summer and station longitude (observation-GFS)(c).Different colors represent different longitude intervals, and the black curve is the average value change curve of each interval |