
1 引言
2 天气环流形势分析
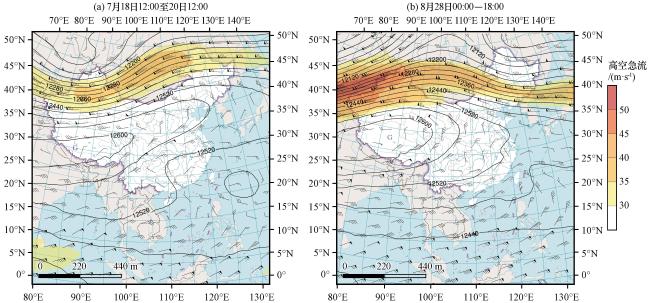
图1 2018年7月18日12:00至20日12:00及8月28日00:00 -18:00 200 hPa平均位势高度(等值线, 单位: gpm)和风场(风羽, 单位: m·s-1)彩色区表示风速大于30 m·s-1的高空急流区Fig.1 Average geopotential height (isoneph, unit: gpm) and wind field (bar, unit: m·s-1) at 200 hPa from 12:00 on 18 to 12:00 on 20 July and from 00:00 to 18:00 on 28 August 2018.The color area represent the high-level jet area with wind speed greater than 30 m·s-1 |
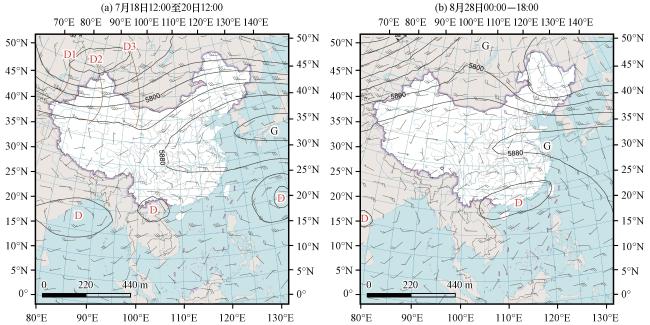
图2 2018年7月18日12:00至20日12:00及8月28日00:00 -18:00 500 hPa平均位势高度(等值线, 单位: gpm)和风场(风矢, 单位: m·s-1)D1, D2和D3和棕色粗实线分别表示7月18日、 19日和20日12:00闭合低压和槽线的位置Fig.2 Average geopotential height(isoneph, unit: gpm)and wind field (arrow, unit: m·s-1) at 500 hPa from 12:00 on 18 to 12:00 on 20 July and from 00:00 to 18:00 on 28 August 2018.D1~D3 and thick brown lines represent the positions of closed low pressure and trough lines at 12:00 on July 18, 19 and 20, respectively |
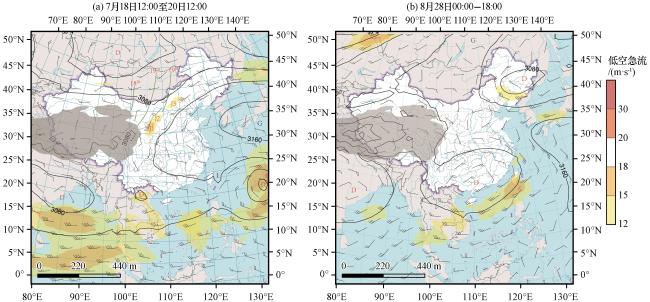
图3 2018年7月18日12:00至20日12:00及8月28日00:00 -18:00 700 hPa平均位势高度(等值线, 单位: gpm)和风场(风羽, 单位: m·s-1)绿色粗实线和J1~J3分别表示7月18日12:00、 19日00:00及06:00切变线和低空急流的位置, 灰色填色区域表示地形高度大于3000 m的区域; 彩色区表示风速大于12 m·s-1的低空急流区Fig.3 Average geopotential height (contour, unit: gpm) and wind field (barb, unit: m·s-1) at 700 hPa from 12:00 on 18 to 12:00 on 20 July and from 00:00 to 18:00 on 28 August 2018.The thick green line represents the shear line, and J1~J3 represents the positions of low-level jet at 12:00 on 18 July, 00:00 and 06:00 on 19 July, respectively.The gray colored area represents the area with terrain height greater than 3000 m.The color area represent the low-level jet area with wind speed greater than 12 m·s-1 |
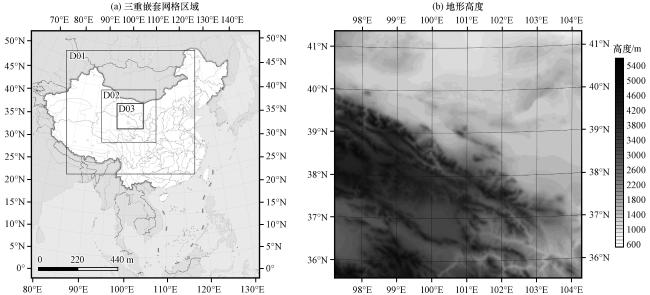
图4 数值试验的三重嵌套网格区域(a)及D03模拟域的地形高度分布(b, 单位: m)Fig.4 Triple nested grid region of numerical experiment (a) and the terrain height distribution of D03 simulation domain (b, unit: m) |
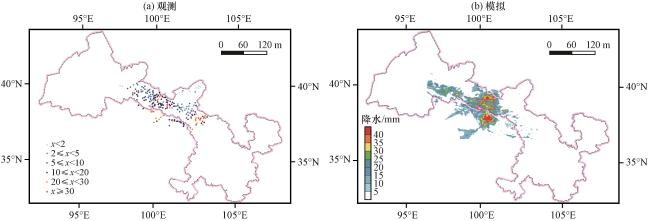
图5 观测的和模拟的2018年7月19日04:00至20日12:00的总降水量(单位: mm)方框代表统计有关降水物理参数的区域, 粗线为剖面位置Fig.5 Observed and simulated total precipitation from 04:00 on 19 to 12:00 on 20 July 2018.Unit: mm.The box represents the area where physical parameters related to precipitation are counted, and the thick line is the location of the cross section |
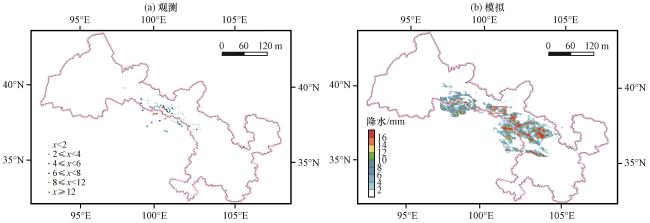
图6 观测的和模拟的2018年8月28日00:00至29日00:00的总降水量(单位: mm)方框代表统计有关降水物理参数的区域, 粗线为剖面位置Fig.6 Observed and simulated total precipitation from 00:00 on 28 to 00:00 on 29 August 2018.Unit: mm.The box represents the area where physical parameters related to precipitation are counted, and the thick line is the location of the cross section |
3 数值模拟方案设计
表1 模式模拟设计Table 1 Summary of model setting for the WRF (v3.8.1) |
| 模拟域 | D01 | D02 | D03 |
|---|---|---|---|
| 模拟中心 | 100.25°E, 39.09°N | 100.25°E, 39.09°N | 100.25°E, 39.09°N |
| 水平分辨率/km | 27 | 9 | 3 |
| 格点维数 | 121×121 | 151×151 | 211×211 |
| 垂直层数 | 30 | 30 | 30 |
| 顶部气压/hPa | 100 | 100 | 100 |
| 输出时间分辨率/h | 1 | 1 | 1 |
| 微物理过程 | 无 | WSM3 | WSM3 |
| 短波辐射 | Dudhia | Dudhia | Dudhia |
| 长波辐射 | RRTM | RRTM | RRTM |
| 积云参数化 | Grell-Devenyi | Grell-Devenyi | 无 |
| 陆面过程 | RUC/Noah | RUC/Noah | RUC/Noah |
| 行星边界层参数化 | YSU | YSU | YSU |
4 模拟结果检验
5 两类降水过程的诊断分析
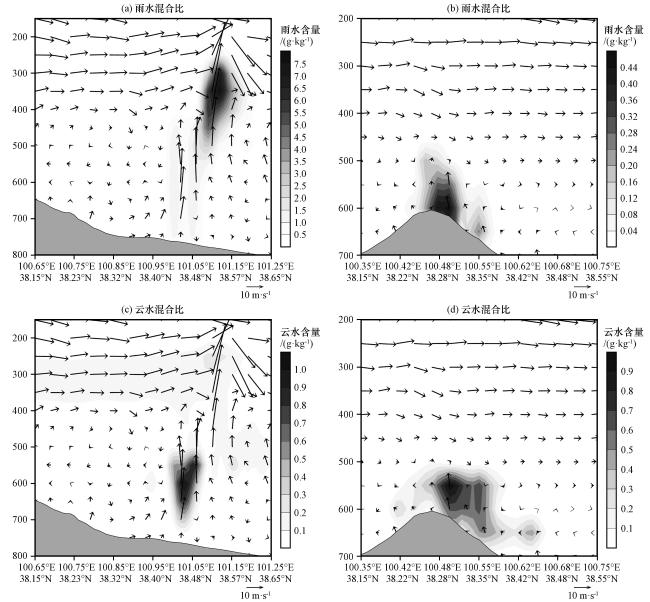
图7 2018年7月19日12:00(a, c) 和8月28日07:00(b, d)的雨水混合比(a, b, 单位: g·kg-1)和云水混合比(c, d, 单位: g·kg-1)的垂直剖面 图中矢量箭头中的垂直风速为W*20, 灰色阴影为地形Fig.7 Cross section of rain-water mixing ratio (a, b, unit: g·kg-1) and cloud-water mixing ratio (c, d, unit: g·kg-1) at 12:00 on 19 July (a, b), and at 07:00 on 28 August (c, d) 2018.The vertical velocity of vector arrow is W*20 and the gray shadow represents the terrain |
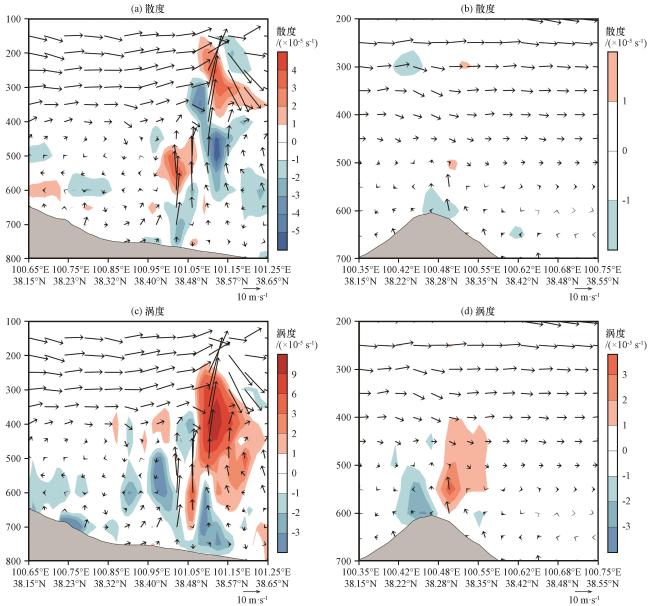
图8 2018年7月19日12:00(a, c)和8月28日07:00(b, d)的散度(a, b, 单位: ×10-5 s-1)和涡度(c, d, 单位: ×10-5s-1)的垂直剖面图矢量为风场, 灰色阴影为地形Fig.8 Cross section of divergence (a, b, unit: ×10-5 s-1) and vorticity (c, d, unit: ×10-5 s-1) at 12:00 on 19 July (a, b), and at 07:00 on 28 August (c, d) 2018.The vector is wind field and the gray shadow represents the terrain |
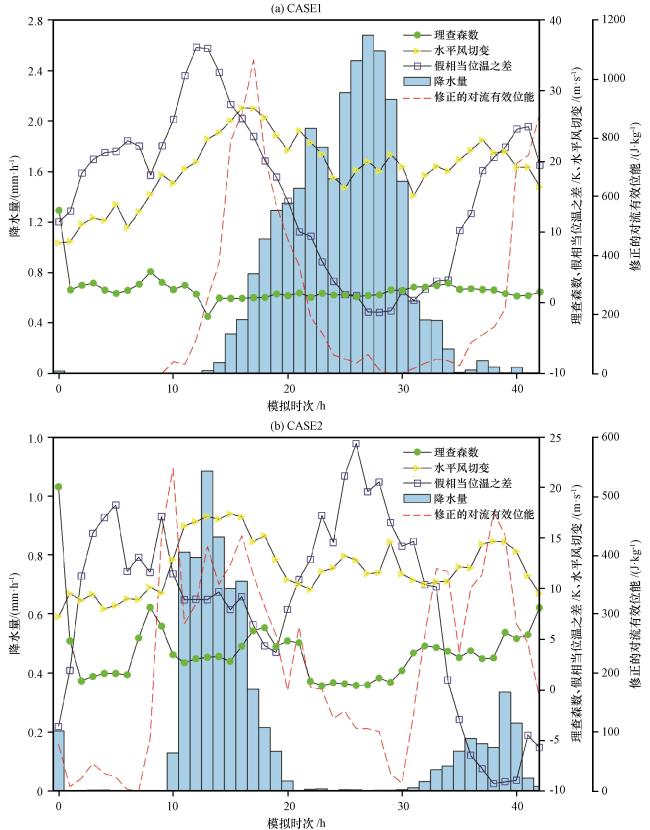
表2 各物理诊断量最值及其出现的时刻Table 2 The maximum value of each physical diagnostic quantity and its occurrence time |
| 对流参数 | CASE1 | 最值出现时刻 | CASE2 | 最值出现时刻 |
|---|---|---|---|---|
| 区域平均降水量 | 2.68 | 7月19日21: 00 | 1.08 | 8月28日07: 00 |
| 修正的对流有效位能 | 1064.84 | 7月19日11: 00 | 546.15 | 8月28日03: 00 |
| 理查森数(600 hPa) | -1.9 | 7月19日07: 00 | 0.87 | 8月27日20: 00 |
| 水平风切变(600~400 hPa) | 27.6 | 7月19日10: 00 | 17.37 | 8月28日09: 00 |
| 假相当位温之差(700~500 hPa) | 36.15 | 7月19日06: 00 | 18.25 | 8月27日23: 00 |