
1 引言
2 数据来源
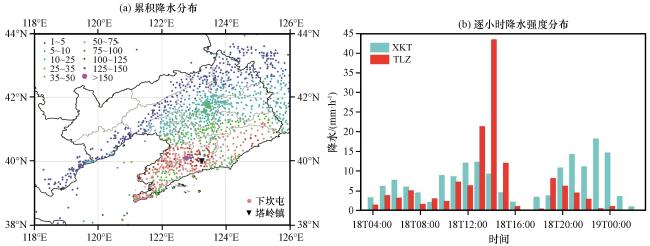
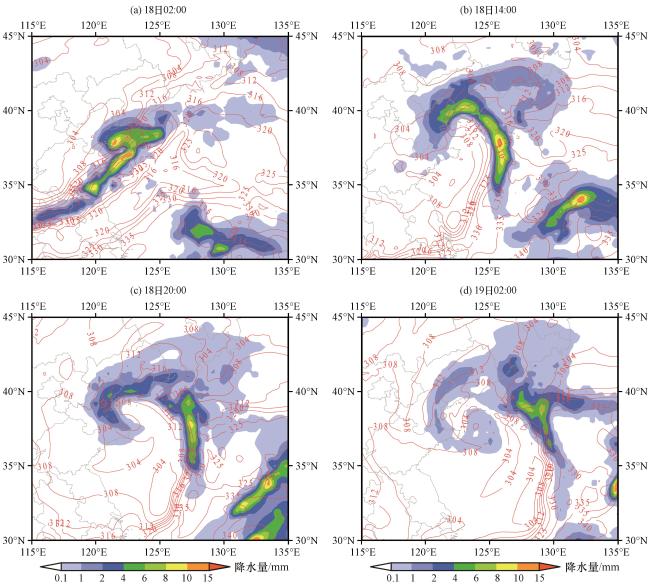
3 降水过程概况
4 环流形势演变特征分析
4.1 高空形势演变特征
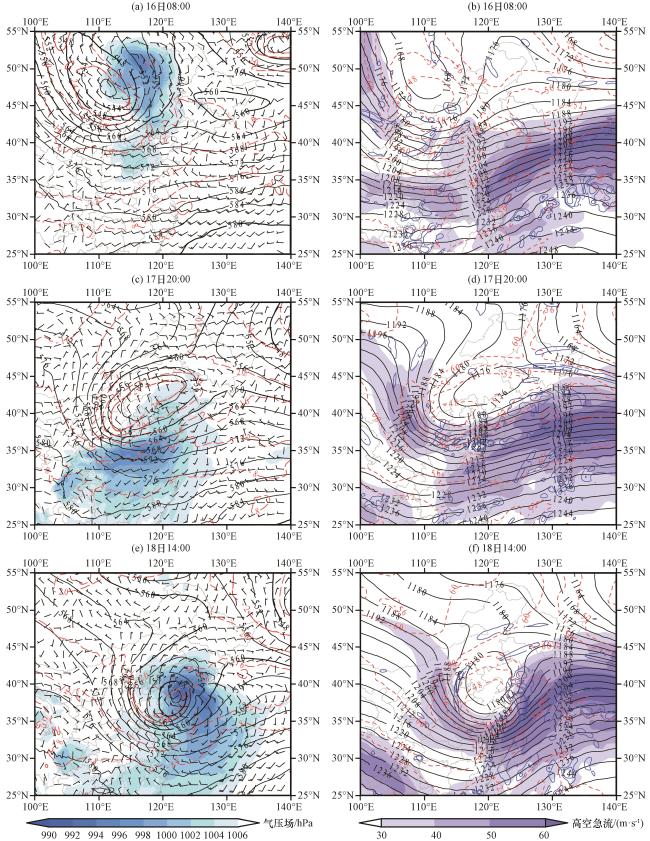
图2 2020年5月500 hPa位势高度(黑色等值线, 单位: dagpm)和温度(红色虚线, 单位: ℃)、 850 hPa风场(风羽, 单位: m·s-1, 长划、 短划分别代表4、 2 m·s-1)和海平面气压场(蓝色阴影, ≤1006 hPa, 单位: hPa)(a, c, e), 200 hPa位势高度(黑色等值线, 单位: dagpm)、 温度(红色虚线, 单位: ℃)、 散度(蓝色等值线, 单位: ×10-5 s-1)和高空急流(阴影区, ≥30 m·s-1, 单位: m·s-1) (b, d, f)Fig.2 Geopotential height (black contour, unit: dagpm), temperature (red dashed line, unit: ℃) at 500 hPa, horizontal wind vectors at 850 hPa (barb, unit: m·s-1, long and short bar indicates 4 and 2 m·s-1, respectively) and sea level pressure (the blue shaded, with ≤1006 hPa, unit: hPa) (a, c, e), geopotential height (black contour, unit: dagpm), temperature (red dashed line, unit: ℃), divergence (blue contour, unit: ×105 s-1 ) and high-level jet stream (the shaded, with ≥30 m·s-1, unit: m·s-1) at 200 hPa (b, d, f) in May 2020 |
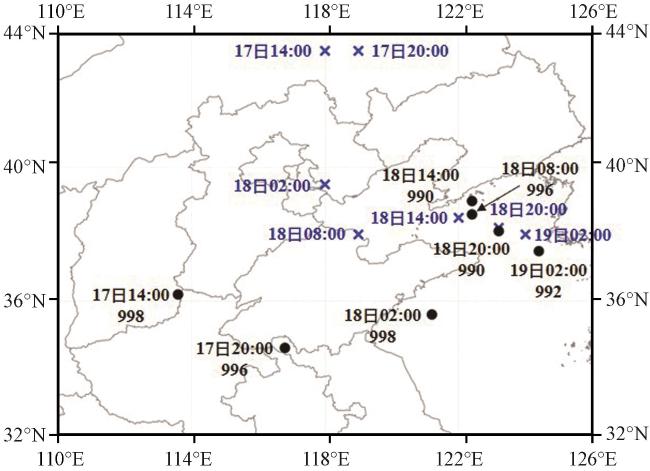
图3 2020年5月17日14:00至19日02:00气旋、 500 hPa冷涡中心路径示意图×表示500 hPa冷涡中心, 标注其出现时间; ●表示气旋中心, 标注其出现时间及气旋中心气压(单位: hPa) Fig.3 The track of cyclone and cold vortex center position at 500 hPa from 14:00 on 17 to 02:00 on 19 May 2020.× is cold vortex center position at 500 hPa and the time of occurrence.Black dot (●) is cyclone center position, upper number is time, lower number for pressure (unit: hPa) |
4.2 地面气旋形成发展过程
5 动力场对降水的影响
5.1 冷涡成熟阶段动力场对降水的影响
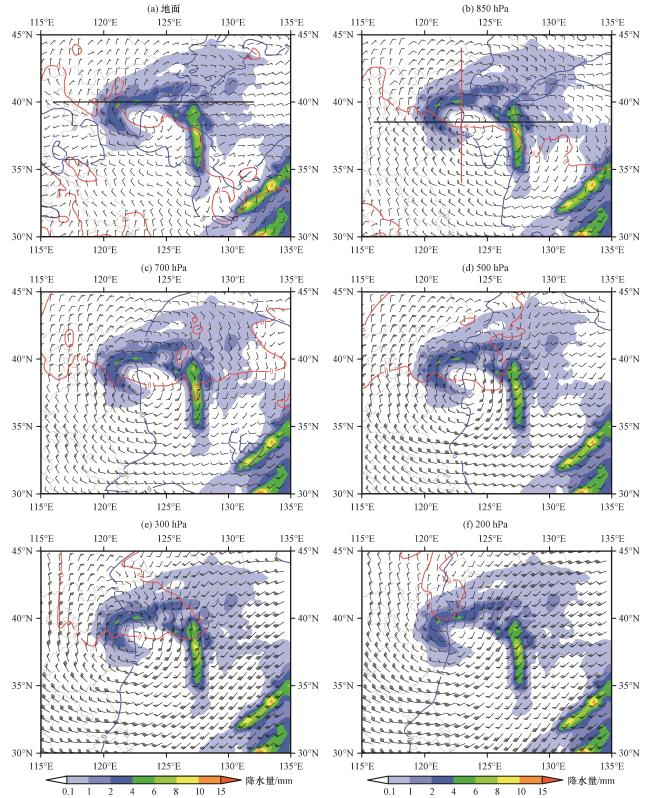
图4 2020年5月18日20:00不同高度风场(风羽, 单位: m·s-1)与地面1 h雨量(阴影, 单位: mm)红色实线为U分量零风速线, 蓝色实线为V分量零风速线; 风羽的三角、 长划、 短划分别代表20、 4、 2 m·s-1 Fig.4 Horizontal wind vectors at different height (barb, unit: m·s-1) and 1-hour precipitation (the shaded, unit: mm) at 20:00 on 18 May 2020.Red solid line is zero value of U component, blue solid line is zero value of V component.The barb’s Triangle is 20 m·s-1, long and short bar indicates 4 and 2 m·s-1, respectively |
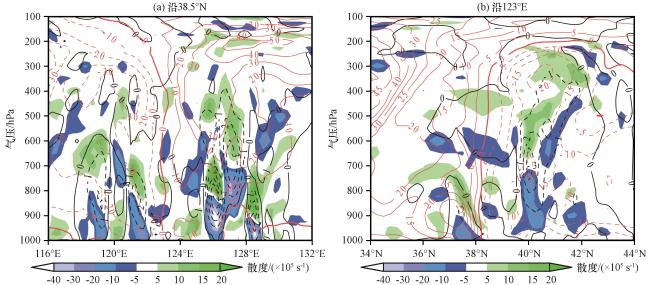
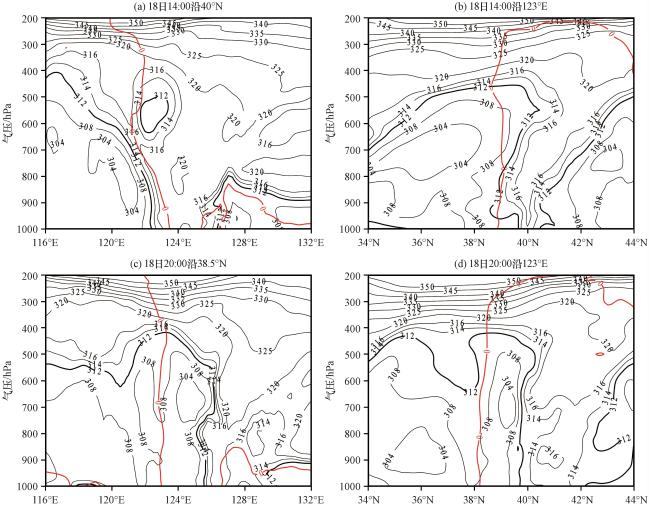
图5 2020年5月18日20:00过冷涡中心(123°E, 38.5°N)的垂直速度(黑色等值线, 单位: Pa·s-1, 负值为上升运动)、 散度(阴影区, 单位: ×105 s-1)与纬向风V [a, 红色等值线, 单位: m·s-1, 沿图4(b)中黑色直线]及经向风U [b, 红色等值线, 单位: m·s-1, 沿图4(b)中红色粗直线](b)的垂直剖面Fig.5 Vertical cross section of vertical velocity (black contour, unit: Pa·s-1, negative value is updrafts), divergence (the shaded, unit: ×105 s-1) and V component [a, red contour, unit: m·s-1, along black line in Fig.4(b)], U component [red contour, unit: m·s-1, along red thick line in Fig.4(b)] along the center of cold vortex (123°E, 38.5°N) at 20:00 on 18 May 2020 |
5.2 暴雨中心动力场特征
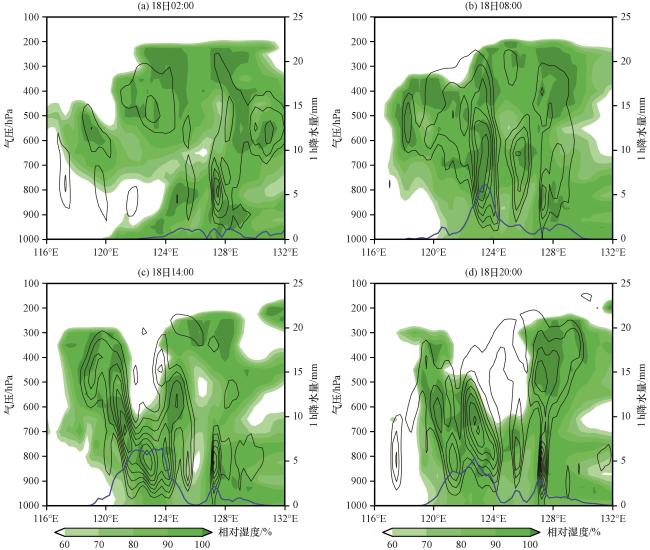
图6 2020年5月18日沿强降水中心[40°N, 图4(a)中黑色直线]相对湿度(阴影区, 单位: %)、 垂直上升速度的绝对值(黑色等值线, 单位: Pa·s-1, 最小值0.5, 最大值4.5, 间隔0.5)、 1 h降水量(蓝色实线, 单位: mm)的垂直剖面Fig.6 Vertical cross section of relative humidity (the shaded, unit: %), absolute value of updrafts (black contour, unit: Pa·s-1, minimum is 0.5, maxium is 4.5, interval is 0.5) and 1-hour rainfall (blue lines, unit: mm) along heavy rainfall center [40°N, black line in Fig.4(a)] on 18 May 2020 |
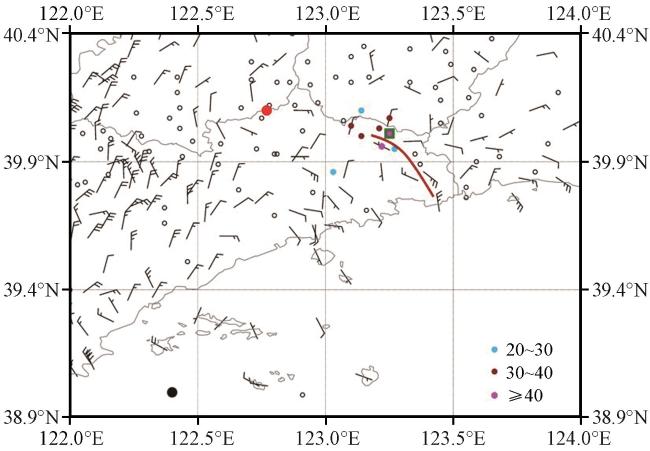
图7 2020年5月18日13:00地面风向和风速(风羽)和18日14:00小时雨量大于20 mm的站点(彩色点)分布黑色圆点为14:00气旋中心, 红色圆点为下坎屯站, 绿色方块为塔岭镇站, 红色实线为地面切变线 Fig.7 Ground wind speed, wind direction at 13:00 (barb), and the stations (color dots) distribution of the 1 h precipitation of greater than 20 mm at 14:00 on 18 May 2020.Black dot is cyclone center position at 14:00, red dot is Xiakantun station, green square is Talingzhen station, red solid line is shear line on the ground |
6 水汽和热力条件对降水的影响
6.1 水汽条件
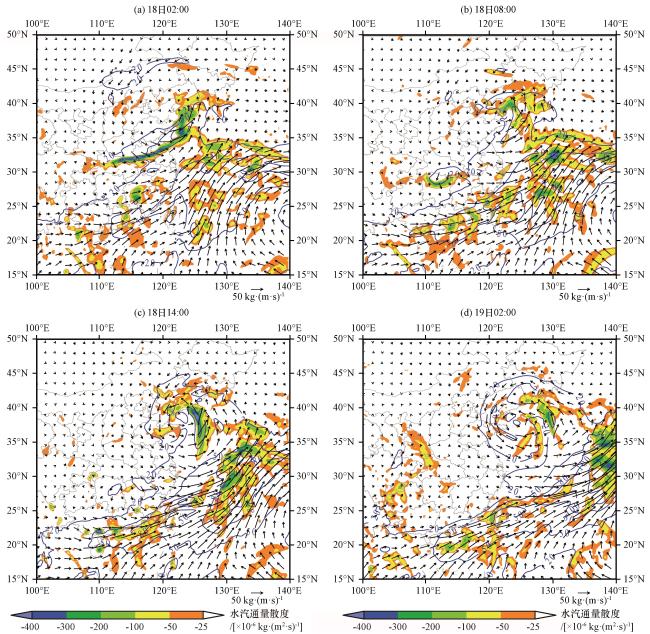
图8 整层水汽通量[矢量, 单位: kg·(m·s)-1]及整层水汽通量散度[阴影区, 单位: ×10-6 kg·(m2·s)-1]蓝色等值线为水汽通量20, 50, 80和100 kg·(m·s)-1的大值区 Fig.8 The distribution of vertical integrated moisture fluxes [vector, unit: kg·(m·s)-1] and their divergence [the shaded, unit: ×10-6 kg·(m2·s)-1].Blue solid lines are 20, 50, 80 and 100 kg·(m·s)-1 of moisture flux |
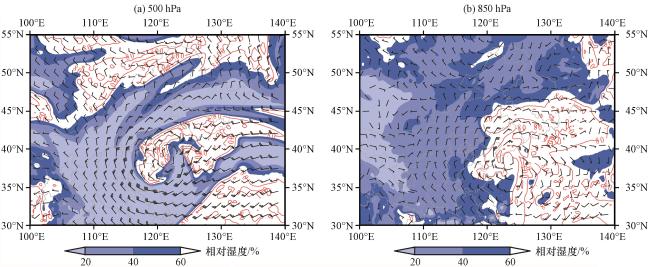
图9 2020年5月18日14:00 500 hPa(a)和850 hPa(b)相对湿度场(阴影为<60%的区域, 红色等值线≥80%, 单位: %)及水平风场(风羽, 单位: m·s-1, 长、 短划分别代表4 m·s-1和2 m·s-1)Fig.9 Relative humidity (shaded denote the area of humidity<60%, red contours denote the area of humidity ≥80%, unit: %) and horizontal wind vectors (barb, unit: m·s-1, long and short barb indicate 4 m·s-1 and 2 m·s-1, respectively) at 500 hPa (a) and 850 hPa (b) at 14:00 on 18 May 2020 |