

1 引言
2 资料来源与方法介绍
2.1 资料来源
2.2 方法介绍
2.2.1 识别阻高方法
表1 两类乌山阻高的建立日期和崩溃日期Table 1 The establishment and collapse dates of two types of the Ural blocking (UB) |
| 短中生命期 | 长生命期 | |||
|---|---|---|---|---|
| 建立日期 (年-月-日) | 崩溃日期 (年-月-日) | 建立日期 (年-月-日) | 崩溃日期 (年-月-日) | |
| 1979-12-28 | 1980-01-03 | 1980-01-27 | 1980-02-05 | |
| 1981-01-17 | 1981-01-22 | 1982-12-19 | 1982-12-26 | |
| 1981-02-20 | 1981-02-25 | 1984-01-23 | 1984-02-03 | |
| 1984-01-13 | 1984-01-18 | 1984-02-15 | 1984-02-23 | |
| 1984-02-07 | 1984-02-12 | 1984-12-14 | 1984-12-28 | |
| 1986-01-28 | 1986-02-03 | 1985-01-05 | 1985-01-12 | |
| 1990-02-15 | 1990-02-21 | 1985-02-20 | 1985-02-28 | |
| 1995-01-17 | 1995-01-22 | 1988-01-22 | 1988-01-31 | |
| 1995-02-15 | 1995-02-20 | 2003-12-27 | 2004-01-04 | |
| 2000-01-09 | 2000-01-15 | 2005-01-23 | 2005-02-09 | |
| 2001-02-03 | 2001-02-07 | 2009-02-15 | 2009-02-23 | |
| 2003-01-19 | 2003-01-25 | 2012-01-17 | 2012-01-29 | |
| 2003-02-06 | 2003-02-11 | 2012-12-10 | 2012-12-19 | |
| 2004-01-31 | 2004-02-04 | 2018-12-20 | 2018-12-27 | |
| 2007-12-08 | 2007-12-12 | — | — | |
| 2007-12-26 | 2007-12-31 | — | — | |
| 2010-02-02 | 2010-02-06 | — | — | |
| 2011-01-07 | 2011-01-11 | — | — | |
| 2016-02-10 | 2016-02-14 | — | — | |
| 2017-01-13 | 2017-01-17 | — | — | |
| 2017-12-12 | 2017-12-18 | — | — | |
—表示无数据 |
2.2.2 定常热、 动通量的计算方法
3 冬季乌山阻高的基本特征
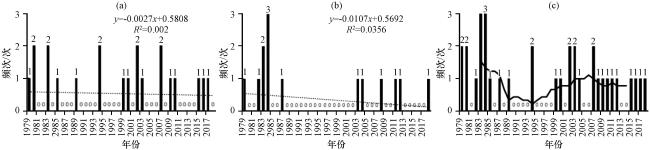
图1 1979 -2018年冬季乌山短中生命期(a)、 长生命期(b)及总的(c)阻高频次的年际变化图1(a)和(b)中虚线表示线性趋势; 图1(c)中黑色实线代表9点平滑的结果 Fig.1 The interannual variation of frequency of short-medium (a), long duration (b) and the sum (c) UB in winter during 1979 -2018.The dashed line represents linear trend in Fig.1(a) and (b).The black solid line represents the results by 9-points smoothing in Fig.1(c) |
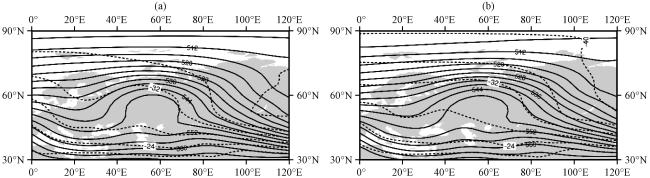
图2 长(a)、 短中(b)生命期阻高期间500 hPa位势高度(实线, 单位: degpm), 温度(虚线, 单位: ℃)的分布灰色阴影为陆地 Fig.2 The distribution of 500 hPa geopotential height (solid line, unit: degpm) and temperature (dashed line, unit: ℃) during the long (a) and the short-medium duration of the UB (b).The gray shadows indicates the land |
4 冬季不同生命期乌山阻高热、 动量的纬向-高度分布
4.1 热量的纬向-高度分布
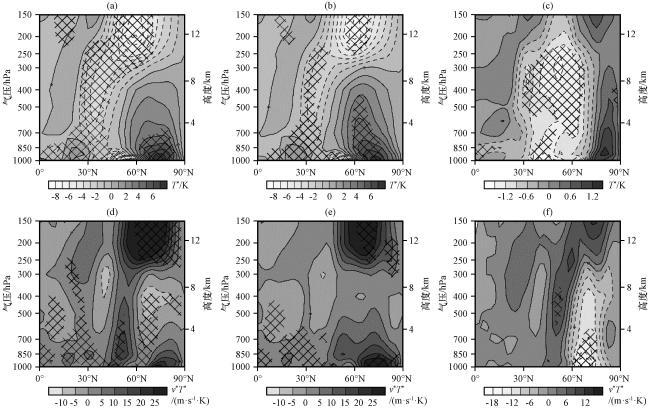
图3 1979 -2018年冬季长(a, d)、 短中(b, e)生命期乌山阻高T* (上, 单位: K)和 v*T* (下, 单位: m·s-1·K)及两类阻高差异(c, f)的纬向—高度分布斜杠区代表通过90%的信度检验 Fig.3 Pressure-latitude distribution of long(a, d), short-medium (b, e) duration UB in winter during 1979 -2018 for T* (up, unit: K), v*T* (down, unit: m·s-1·K) and their anomalies(c, f).The slash region represents it passed the 90% significance test |
4.2 动量的纬向—高度分布
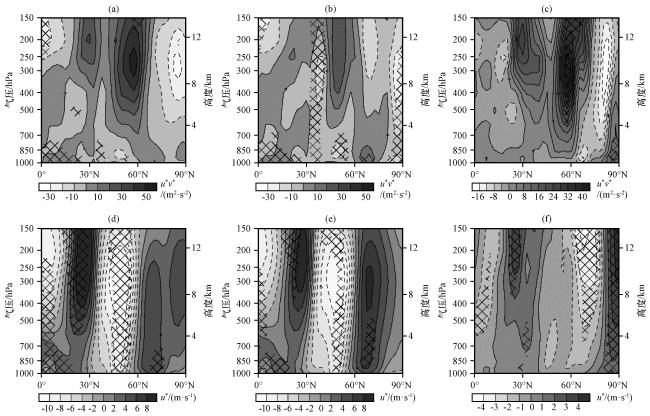
图4 1979 -2018年冬季长(a, d)、 短中(b, e)生命期乌山阻高u*v* (上, 单位: m2·s-2)、 u* (下, 单位: m·s-1)及其差异(c, f)的纬向-高度分布斜杠区代表通过90%的信度检验 Fig.4 Pressure-latitude distribution of long(a, d), short-medium(b, e) duration UB in winter during 1979 -2018 for u*v* (up, unit: m2·s-2), u* (down, unit: m·s-1) and their anomalies (c, f).The slash region represents it passed the 90% significance test |
4.3 热、 动量通量影响阻高的机制
5 冬季不同生命期乌山阻高在对流层中上层的热、 动量的分布
5.1 对流层中上层热量的经-纬向分布特征
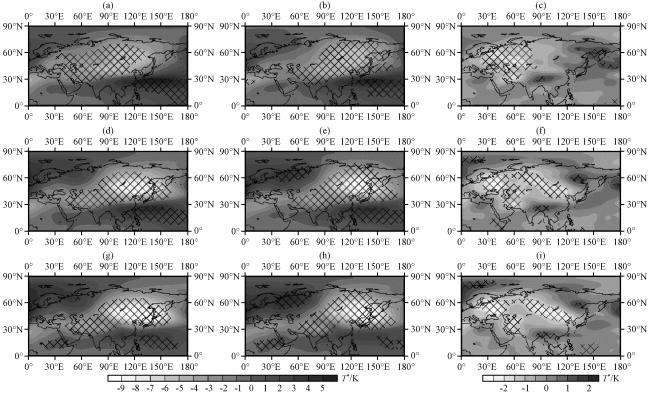
图5 1979 -2018年冬季长(a, d, g)、 短中生命期(b, e, h)乌山阻高T* 及其差异(c, f, i)在对流层300 hPa (上)、 400 hPa (中)、 500 hPa (下)上的分布(单位: K)斜杠代表通过90%的信度检验 Fig.5 The distribution of T* of the UB long (a, d, g), short-medium (b, e, h) duration and their anomalies (c, f, i) on 300 hPa (up), 400 hPa (middle), 500 hPa (down) in winter during 1979 -2018.Unit: K.The slash region represents it passed the 90% significance test |
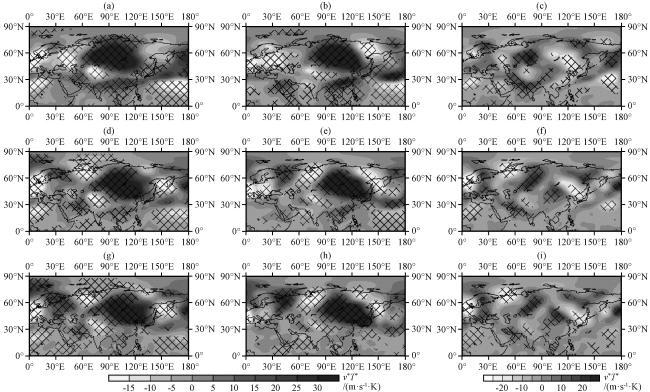
图6 1979 -2018年冬季长(a, d, g)、 短中生命期(b, e, h)乌山阻高 及其差异(c, f, i)在300 hPa (上)、 400 hPa (中)、 500 hPa (下)上的分布(单位: m·s-1·K)斜杠代表通过90%的信度检验 Fig.6 The distribution of of the UB long (a, d, g), short-medium (b, e, h) duration and their anomalies (c, f, i) on 300 hPa (up), 400 hPa (middle), 500 hPa (down) in winter during 1979 -2018.Unit: m·s-1·K.The slash region represents it passed the 90% significance test |
5.2 对流层中上层, 动量的经-纬向分布特征
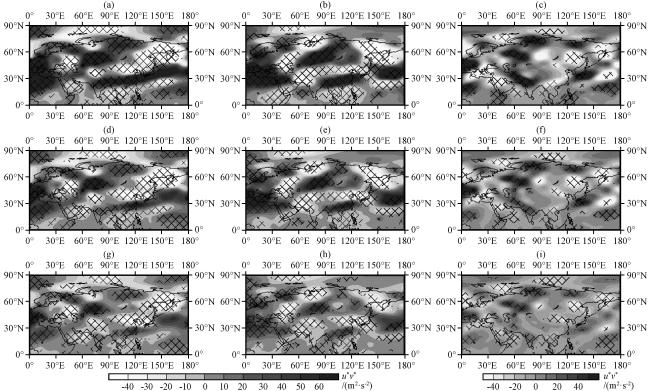
图7 1979 -2018年冬季长(a, d, g)、 短中生命期(b, e, h)乌山阻高u*v* 及其差异(c, f, i)在300 hPa (上)、 400 hPa (中)、 500 hPa (下)上的分布(单位: m2·s-2)斜杠代表通过90%的信度检验 Fig.7 The distribution of u*v* of the UB long (a, d, g), short-medium (b, e, h) duration and their anomalies (c, f, i) on 300 hPa (up), 400 hPa (middle), 500 hPa (down) in winter during 1979 -2018.Unit: m2·s-2.The slash region represents it passed the 90% significance test |
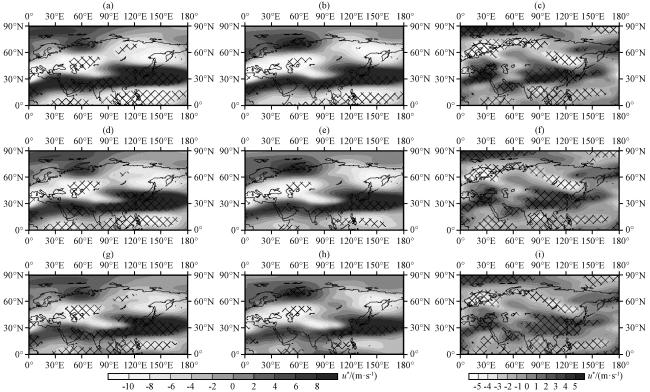
图8 1979 -2018年冬季长(a, d, g)、 短中生命期(b, e, h)乌山阻高u* 及它们差异(c, f, i)在300 hPa (上)、 400 hPa (中)、 500 hPa (下)上的分布(单位: m·s-1)斜杠代表通过90%的信度检验 Fig.8 The distribution of u* of the UB long (a, d, g), short-medium (b, e, h) duration and their anomalies (c, f, i) on 300 hPa (up), 400 hPa (middle), 500 hPa (down) in winter during 1979 -2018.Unit: m·s-1.The slash region represents it passed the 90% significance test |
5.3 热、 动量通量对阻高持续时间的影响
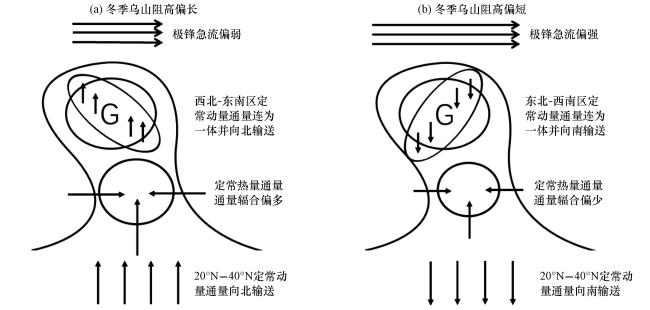


图9 冬季长(a)、 短中(b)生命期乌山阻高期间的定常热、 动量特征的概念图“G”代表高压中心; “G”外圆圈代表闭合等高线; 外“Ω”型代表高压脊 Fig.9 The concept map of characteristics of the stationary heat and momentum during the lifetime of long (a) and short-medium (b) UB in winter.The letter G represents the high pressure center, The "G" outer circle represents the closed contour line, and the outer "Ω" shape represents the ridge of high pressure |