

1 引 言
2 试验设置
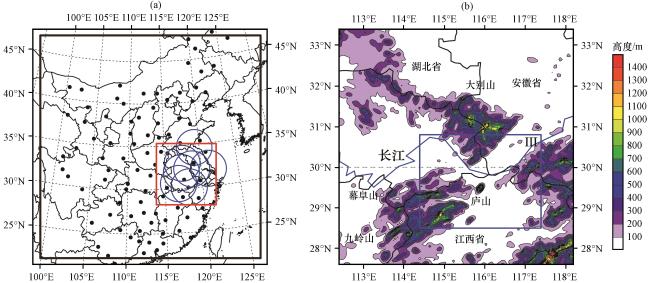
图1 模拟区域(a)和过程发生区域地形高度(b, 彩色区, 单位: m)(a)中红框为内区域, 黑色粗框为外区域, 黑色外框为模拟真值的覆盖区域, 黑色散点和蓝色圆圈分别表征仿真探空和雷达观测位置; (b)中蓝色矩形框为图3绘图区域(区域Ⅲ) Fig.1 Simulation domains (a) and topographic height in process occurrence area (b, color area, unit: m).In Fig.1 (a), the red box, the black bold box, and the black outer box represent inner domain, coarse domain, and the coverage area of simulated TRUE respectively.The black splashes and blue circles represent the locations of simulated soundings and radars.In Fig.1 (b), the blue box represents plot region from Fig.3 (region Ⅲ) |
3 个例回顾
3.1 过程概况与环境场
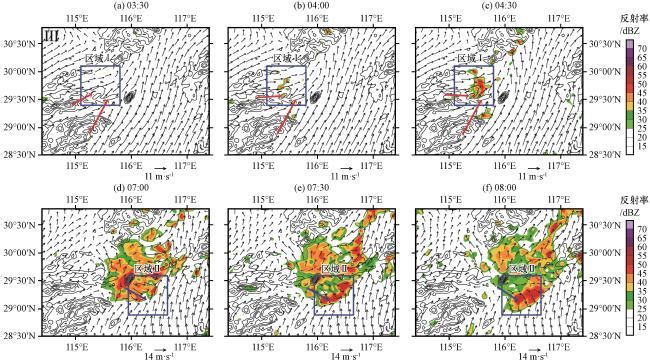
图3 2013年7月21日TRUE中反算的雷达组合反射率(彩色区, 单位: dBZ)、 0.3 km高度风场(矢量, 单位: m·s-1)、 地形高度(等值线, 单位: m)和代表气流(蓝色粗箭头)Fig.3 Model-derived composite radar reflectivity (color area, unit: dBZ), wind field on 0.3 km level (vector, unit: m·s-1), topographic height (contour, unit: m) and representative flow (thick blue arrows) from TRUE on 21 July 2013 |
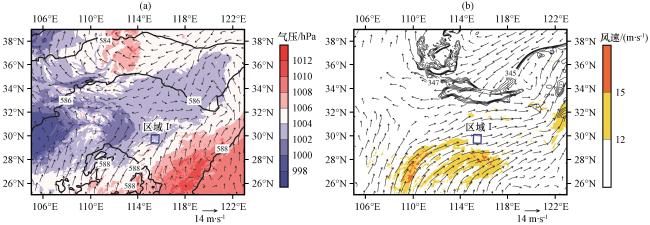
图4 2013年7月21日TRUE中04:00海平面气压(彩色区, 单位: hPa)、 10 m风场(矢量, 单位: m·s-1)和500 hPa位势高度(等值线, 单位: dagpm)(a), 850 hPa风场(矢量, 单位: m·s-1)、 风速(彩色区, 单位: m·s-1)和相当位温(等值线, 单位: K)(b)Fig.4 Sea level pressure (color area, unit: hPa), wind field on 10 m AGL (vector, unit: m·s-1) and 500 hPa geopotential height (contour, unit: dagpm) (a), wind field (vector, unit: m·s-1), wind speed (color area, unit: m·s-1) and 850 hPa equivalent potential temperature (contour, unit: K) (b) from TRUE at 04:00 on 21 July 2013 |
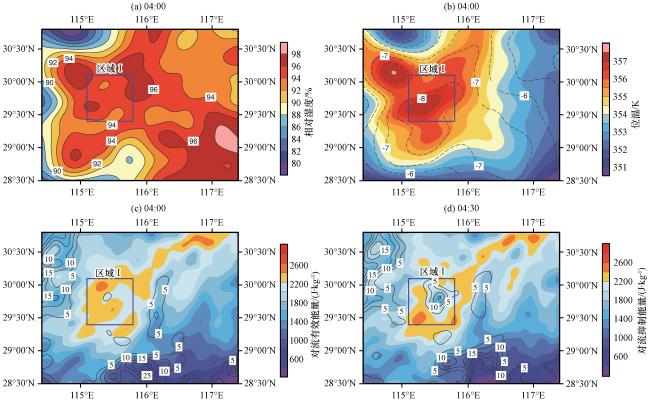
图5 2013年7月21日TRUE中850 hPa相对湿度(彩色区, 单位: %)(a), 850 hPa相当位温(彩色区, 单位: K)和500 hPa与850 hPa相当位温差(等值线, 单位: K)(b), 对流有效位能(彩色区, 单位: J·kg-1)和对流抑制能量(等值线, 单位: J·kg-1)(c, d)Fig.5 850 hPa relative humidity (unit: %) (a), 850 hPa equivalent potential temperature (color area, unit: K) and equivalent potential temperature difference between 500 hPa and 850 hPa (contour, unit: K) (b), convective available potential energy (color area, unit: J·kg-1) and convective inhibition energy (contour, unit: J·kg-1) (c, d) from TRUE on 21 July 2013 |
3.2 对流触发和发展阶段机制分析
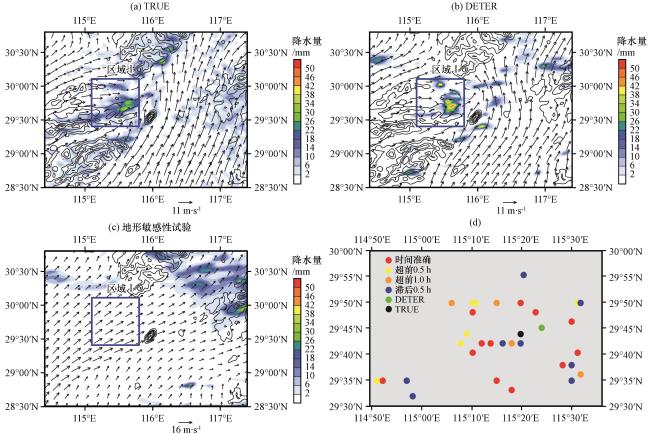
图6 2013年7月21日04:00 -05:00降水量(彩色区, 单位: mm), 小时平均的0.3 km高度风场(矢量, 单位: m·s-1)和地形高度(等值线, 单位: m)(a~c), 初生对流的时间和落区(超前、 滞后于TRUE)(d)Fig.6 1 h precipitation (color area, unit: mm), averaged wind field on 0.3 km level (vector, unit: m·s-1) in 04:00 -05:00 and topographic height (contour, unit: m) (a~c), times and locations of newborn convection (relative to TRUE) (d) on 21 July 2013 |
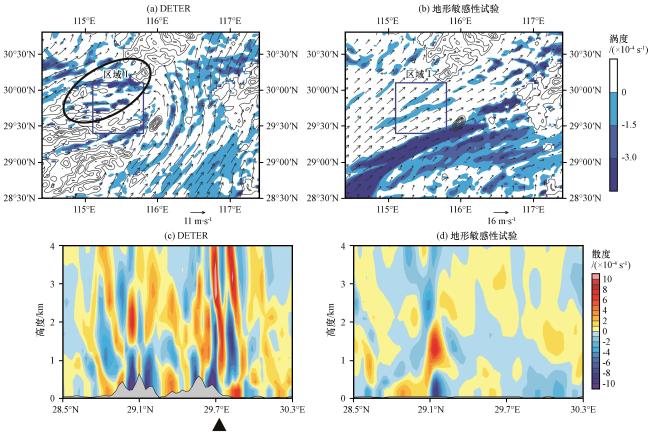
图7 2013年7月21日04:00 -05:00 0.3 km高度上小时平均的涡度(彩色区, 单位: ×10-4 s-1, 椭圆表示负涡度区)、 风场(矢量, 单位: m·s-1)和地形高度(等值线, 单位: m)(a, b), 小时平均散度(彩色区, 单位: ×10-4 s-1)沿新生对流所在经度(115.38° E)的垂直剖面(c, d)(c)中三角形为对流触发位置 Fig.7 Averaged vorticity (color area, unit: ×10-4 s-1, the ellipse represents negative vorticity region), wind field on 0.3 km level (vector, unit: m·s-1), and topographic height (contour, unit: m) (a, b), vertical section of averaged divergence (color area, unit: ×10-4 s-1) along 115.38° E at 04:00 -05:00 (c, d) on 21 July 2013.Triangle in Fig.7(c) represents convection initiation location |
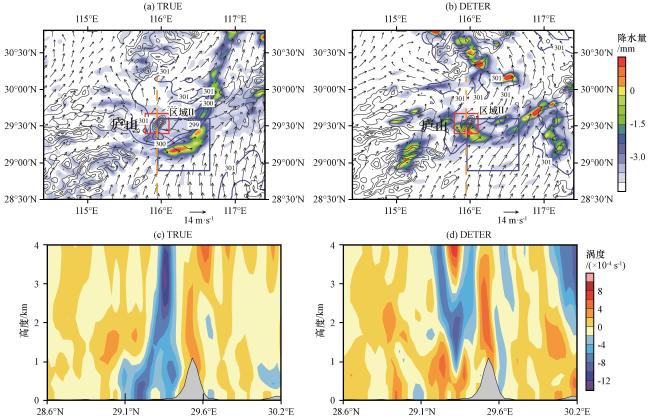
图8 2013年7月21日07:00 -08:00降水量(彩色区, 单位: mm)、 0.3 km高度上小时平均的风场(矢量, 单位: m·s-1)、 位温(蓝色等值线, 单位: K)和地形高度(黑色等值线, 单位: m)(a, b), 小时平均涡度(彩色区, 单位: ×10-4 s-1)沿(a)中橙虚线的垂直剖面(c, d)Fig.8 1 h precipitation (color area, unit: mm), averaged wind field (vector, unit: m·s-1), potential temperature (blue contour, unit: K) on 0.3 km level and topographic height (black contour, unit: m) (a, b), averaged vorticity (color area, unit: ×10-4 s-1) (c, d) on vertical section along orange dashed line from Fig.8 (a) from 07:00 to 08:00 on 21 July 2013 |
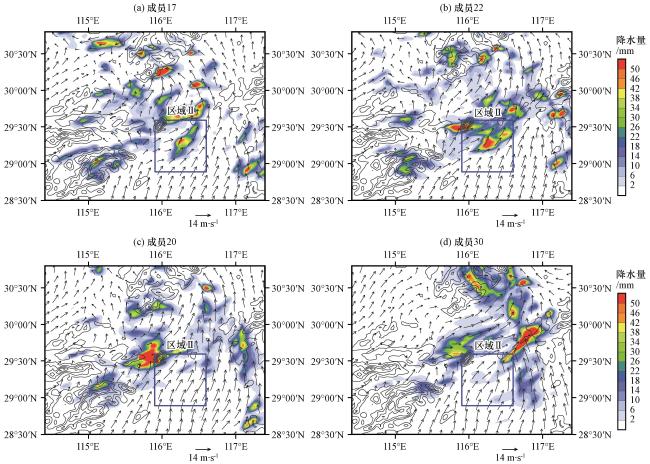
图9 2013年7月21日07:00 -08:00降水量(彩色区, 单位: mm)、 0.3 km高度上小时平均的风场(矢量, 单位: m·s-1)和地形高度(黑色等值线, 单位: m)Fig.9 1 h precipitation (color area, unit: mm), averaged wind field (vector, unit: m·s-1) on 0.3 km level and topographic height (black contour, unit: m) from 07:00 to 08:00 on 21 July 2013 |
4 可预报性研究
4.1 实际可预报性
4.2 内在可预报性
4.3 集合敏感性分析
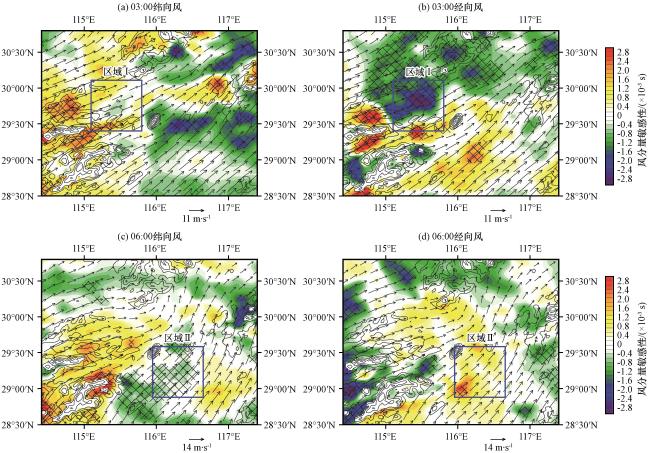


图12 2013年7月21日04:00 -05:00区域Ⅰ降水量相对于03:00(a, b)、 07:00 -08:00区域Ⅱ降水量相对于06:00 (c, d)0.3 km高度上风分量的集合敏感性(彩色区, 单位: ×10-3 s), 集合平均的0.3 km高度风场(矢量, 单位: m·s-1)和地形高度(等值线, 单位: m)划斜线区通过了90%的显著性检验 Fig.12 Ensemble sensitivity (color area, unit: ×10-3 s) of 04:00 -05:00 area-averaged precipitation in region Ⅰ to 0.3 km wind at 03:00 (a, b), 07:00 -08:00 area-averaged precipitation in region Ⅱ to 0.3 km wind at 06:00 (c, d), ensemble-mean 0.3 km wind field (vector, unit: m·s-1) and topographic height (contour, unit: m).Slash areas pass the significance test with 90% confidence level |