

1 引言
在干旱和半干旱地区, 内陆河流域水资源的变化影响着流域内绿洲的演变和荒漠化的程度和方向(孙琪等, 2021), 水资源短缺是限制内陆河流域经济-生态可持续发展的根本原因(王玉纯等, 2018; 王韦婷, 2021)。以中国河西三大内陆河之一黑河流域为例, 其上游区域位于祁连山区, 丰富的降水和冰川积雪融水为流域提供了大量水资源, 是流域中下游径流的主要来源(Zhang et al, 2016), 通常被用来维持中下游的经济-生态平衡, 是全流域的“水塔”区域。随着人类生产生活需求的增加, 中游的耗水量增加是必然趋势, 中下游之间水资源供需矛盾将会进一步加剧。因此, 探究黑河上游产水服务的时空演变及驱动因素对区域水资源合理开发和利用尤为重要。
对于区域产水服务的研究, 大多采用模型模拟的方法, 其中InVEST模型基于水量平衡原理计算产水量, 可实现产水服务空间分布与动态变化空间制图, 目前已经得到广泛应用。研究领域多涉及区域产水量时空演变及驱动因素分析。杨洁等(2020)利用InVEST模型的产水模块分析了黄河流域产水量的时空格局, 发现降水变化比土地利用/覆被变化对产水量的影响更显著。王晓峰等(2021)基于InVEST模型评估2000 -2018年秦岭地区产水服务, 研究表明产水量较大的区域主要受降水主导而产水量中等的区域主要受植被净初级生产力(Net Primary Productivity, NPP)和实际蒸散量影响。孙琪等(2021)利用InVEST模型模拟了2000 -2015年和田河流域、 开都-孔雀河流域和叶尔羌河流域产水量的时空分布, 得出西北干旱区内陆河典型流域产水量主要受气温和降水的影响这一结论。王蓓等(2016)基于InVEST模型对黑河流域2011年产水服务等进行估算和空间格局分析。吴健等(2017)利用InVEST模型分析了中国东北区域产水量的时空变化并采用结构方程模型分析气候、 土地利用变化对东北地区产水量的影响。丁家宝等(2022)基于InVEST模型的产水模块对2000 -2015年青海湖流域的产水量进行模拟, 并对2025 -2050年产水量的时空分布进行预测分析。
本研究以黑河流域上游为例, 基于InVEST模型对研究区1990-2018年的产水服务进行估算, 探究产水服务时空演变特征, 结合土地利用/覆被变化揭示流域不同下垫面下产水能力及差异, 采用时空地理加权回归模型(Geographically and Temporally Weighted Regression, GTWR)从时空维度模拟了降水、 潜在蒸散发及植被净初级生产力对产水服务的影响能力, 识别不同区域的主导驱动因素及驱动强度, 以期为黑河上游乃至整个流域水资源配置与管理、 生态环境保护与流域综合治理提供科学依据。
2 材料来源与方法介绍
2.1 研究区域
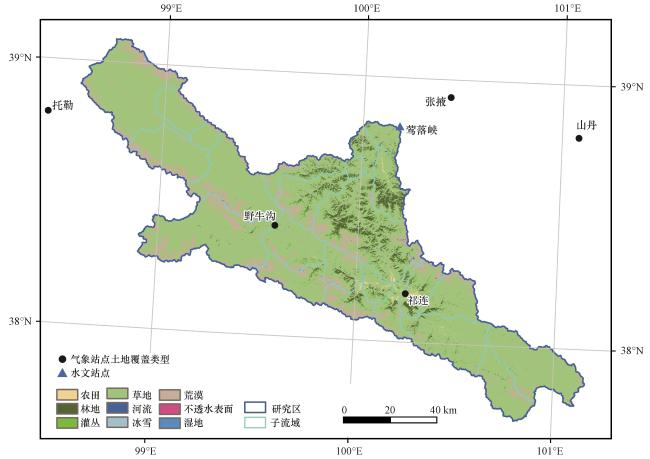
黑河发源于青海省祁连山区的走廊南山和托勒山之间, 是我国第二大内陆河流域。莺落峡水文站(38°48′N, 100°11′E)是黑河上游出山口控制断面, 其控制流域面积为1.0×10⁴ km2, 占黑河总流域面积的7.8%左右(邹悦等, 2011)。据水文资料统计结果显示, 莺落峡水文站1965 -2018年多年平均径流量为16.55×10⁸ m3, 年平均径流深为163.9 mm。研究区域为黑河上游莺落峡控制流域范围(98°33′E -101°11′E, 37°42′N -39°06′N), 位于黑河流域南部的祁连山区, 地势高寒, 海拔在1670~5062 m, 植被属山地森林草原(戴春霞, 2010), 生长有高山灌丛和乔木林, 气候阴湿, 气温低, 蒸发弱, 冰川积雪发育, 降水较多, 是黑河流域的主要产流区域(蔡树香, 2015)(图1 )。作为流域的“水塔”区域和周边区域的“生态屏障”, 其产流和生态可持续性对于全流域具有重要意义(Guo et al, 2016; 苏同宣, 2021)。
2.2 数据来源
气象数据包括降水数据、 潜在蒸散发数据。其中降水数据采用研究区内及周边气象站点及水文站1990, 2000, 2010和2018年的日降水观测数据, 在ArcGIS中采用IDW插值方法对站点年降水量进行空间插值, 并通过矢量数据裁剪获得研究区的降水数据。气象台站观测数据来源于中国气象数据网(http: //data.cma.cn)。潜在蒸散发数据来源于国家地球系统科学数据中心(http: //www.geodata.cn/)中国1 km逐月潜在蒸散发数据集。莺落峡水文站1990, 2000, 2010和2018年的年径流及降水观测数据来源于青海省水文水资源勘测局。土地覆被数据来源于欧洲泽诺多数据知识库1990 -2018年全国土地覆被栅格数据集(https: //zenodo.org/), 空间分辨率为30 m。土壤类型、 质地和土壤深度数据来源于国家冰川冻土沙漠科学数据中心(http: //data.casnw.net/portal/)第二次全国土壤数据库。生物物理系数表: 包括蒸散系数( )和根系深度, 参考InVEST模型指南和联合国粮农组织蒸散系数指南及刘洋(2020)的研究成果获得。NPP数据来源于全球变化科学研究数据出版系统(http: //www.geodoi.ac.cn/)逐月净初级生产力1 km栅格数据集。流域和子流域边界基于从美国地质调查局(United States Geological Survey, USGS)(http: //eros.usgs.gov/ elevation-products)下载的30 m DEM 数据, 在ArcGIS中的水文分析中进行填洼处理, 然后在ArcSWAT-Watershed Delineator中进行处理, 得到流域和24个子流域范围。所有数据均按照研究区范围进行裁剪, 重采样后生成研究区1990, 2000, 2010和2018年4期空间分辨率为30 m的数据集。
2.3 研究方法
2.3.1 基于InVEST模拟产水量服务
采用InVEST模型中的产水量模块获取研究区1990, 2000, 2010和2018年产水量空间分布。该模块以水量平衡原理为依据, 将产水量定义为栅格范围内的降水量减去植物蒸腾和地表蒸发后剩余的水量, 并假设栅格单元的产水量都通过地表和地下径流最终到达流域出口。通过降水、 潜在蒸散发、 根系和土壤深度等参数估算出产水量, 用流域出口水文站的径流量数据进行校正, 最终求取流域栅格产水量。模型主要算法如下:
式中: 为产水量(单位: mm); 为实际蒸散量(单位: mm); 为降水量(单位: mm); 为潜在蒸散发量(单位: mm); 为非物理参数, 无量纲, 反映自然气候条件下流域土壤和植被等实际状况。
式中: 为植被有效可利用水(单位: mm), 表示植被生长所利用的土壤的水量, 其值由土壤质地和有效土壤深度决定; 为Zhang系数, 是利用流域实测径流量进行数据校验后获得的经验参数(赵亚茹等, 2019)。本研究Zhang系数经校验取2.8。
式中: 为土壤深度(单位: mm); 为根系深度(单位: mm), 是指根系生物量的90%所能达到的土壤最大延伸深度; 为植被可利用水率(单位: %), 即土壤有效含水量, 与土壤结构、 有机质含量、 土壤容重因子有关, 为田间持水量和永久萎蔫系数两者的差值, 可采用土壤质地数据分别由经验公式计算(Gupta and Larson, 1979)。
式中: 为Budyko干燥指数, 无量纲; 为参考蒸散量(单位: mm); 为植被蒸散系数。
2.3.2 时空地理加权回归模型
地理空间加权回归模型(Geographical Weighed Regression, GWR)是传统线性回归模型的空间扩展, 是研究地理空间数据之间关系空间异质性的经典模型(马勇和黄智洵, 2017; Brunsdon et al, 1998), 模型强调了空间数据中包含的位置信息, 从而能够对变量之间的局部特性进行有效表达, 对探索空间非平稳性有很好的效果(Du and Mulley, 1977)。然而GWR模型只能使用截面数据, 且对样本数量有要求, 现实中截面数据样本量有限, 往往会影响建模。时空地理加权回归模型(Geographically and Temporally Weighted Regression, GTWR)将时间维度引入地理空间加权回归模型(GWR)能够得到时间和空间双重信息, 使得估计效果更加有效(王海军等, 2018)。GTWR模型表达式如下:
式中: 和 分别为重心点经纬坐标; 为第 个样本点的时空坐标; 为 点的回归常数, 即常数项; 为 点的第 个回归参数; 为独立变量 在 点的值, 即模型指标体系中各量化指标的值; 为模型的残差项。
3 结果与分析
3.1 黑河流域上游产水量模拟精度分析
采用同时期黑河流域上游莺落峡水文站径流量对模型模拟得到的产水量数据进行验证, 纳什系数NSE值为0.92, 1990, 2000, 2010和2018年的验证结果相对误差分别为-0.8%、 -6.3%、 -2.2%、 2.5%。说明InVEST模型的产水量模块计算得到的结果是可靠的。
3.2 黑河流域上游产水量时空变化特征分析
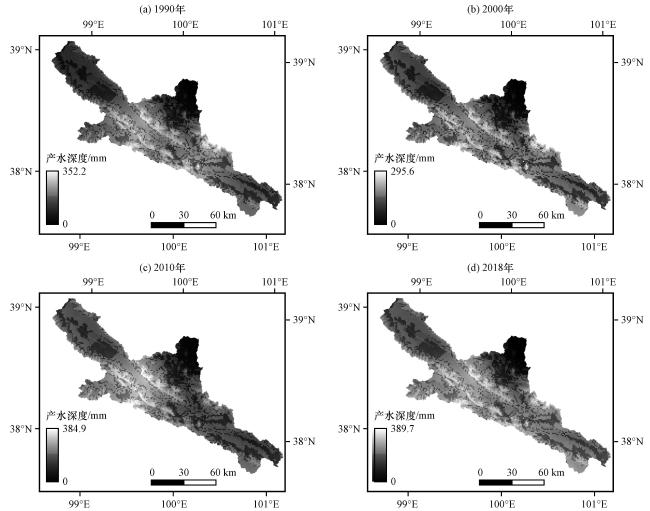
1990 -2018年4期产水总量均值为1.67×10⁹ m3, 产水深度均值为167.11 mm, 2018年产水量最大, 产水深度为205.80 mm, 2000年产水量最少, 产水深度为137.01 mm(表1 )。从空间分布来看, 研究区西北部和中部以北地区是产水量低值区, 其他区域产水深度较高(图2 )。
表1 1990 -2018年产水深度(模拟值)与径流深度(实测值)Table 1 Simulated water yield and measured runoff of the Upper Heihe River Basin from 1990 to 2018 |
| 深度 | 1990年 | 2000年 | 2010年 | 2018年 |
|---|---|---|---|---|
| 径流深度/mm | 158.4 | 146.2 | 172.4 | 200.8 |
| 产水深度/mm | 157.1 | 137.0 | 168.6 | 205.8 |
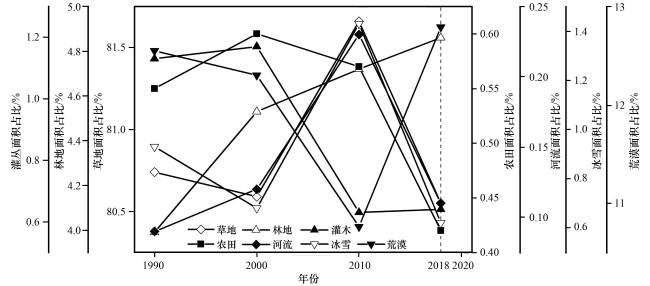
研究区土地覆被类型以草地为主(占比80%以上), 其次是荒漠、 林地, 灌丛、 冰雪、 农田及河流面积较少, 仅有极少量不透水表面和湿地, 面积占比不到0.01%, 本文只讨论除不透水表面和湿地以外其他的土地覆被类型。不同土地覆被类型面积占比的时间变化发现: 研究区土地覆被变异明显。林地面积处于不断上升趋势, 面积占比在2018年较1990年增加了0.87%; 农田和灌丛面积在2000年后逐渐减少; 草地、 河流和冰雪面积在2010年均达到4期峰值, 而在2018年面积陡然减少, 尤其是草地面积, 在2010年较2000年增加了1.07%, 在2018年较2010年面积占比降低了1.11%; 研究区荒漠面积占比在2010年较2000年降低了1.54%, 而在2018年较2010年增加了约2.00%(图3 )。研究区林地面积不断增加, 一方面受气候影响, 另一方面与黑河上游自20世纪80年代、 90年代普遍开展的生态恢复工程有一定关系(苏同宣, 2021)。
从产水总量来看, 研究区草地面积最大, 对研究区产水总量的贡献也最大, 4期平均产水总量为(12.77±2.30)×108 m3, 其次是荒漠[(3.09±0.53)×108 m3], 林地((0.40±0.10)×108 m3)和冰雪((0.26±0.11)×108 m3)。从产水深度来看, 冰雪和荒漠的产水深度分别为285.34±32.74 mm和255.19±36.17 mm, 明显高于其他土地覆盖类型, 其次是河流(166.39±15.90 mm)、 农田(159.65±32.67 mm)和草地(157.60±28.56 mm), 灌丛(122.03±26.21 mm)和林地(88.16±17.79 mm)的产水深度最低。冰雪和荒漠主要分布在中部海拔较高区域, 年降水量高[图6 (f)], 产水深度相应也比较高。林地和灌丛主要分布在研究区中部以北, 该区域海拔较低, 降水量偏少[图6 (f)], 蒸散发比较强[图7 (f)], 且林地和灌丛通过林冠层、 枯枝落叶层和土壤层拦截降雨, 并通过蒸腾作用散失水分, 产水效果相对较差。草地分布面积最广, 受降雨影响, 产水量空间差异明显。可以发现, 受降水量及土地覆被类型面积变化等因素影响, 4期不同土地覆被类型的产水深度变异较大(表2 , 图4 )。
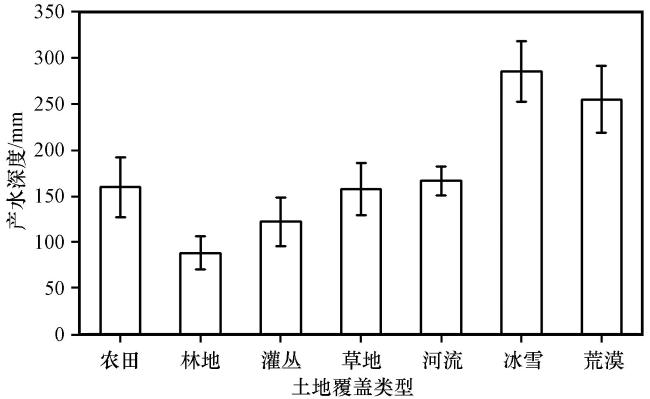
图4 不同土地覆被类型下平均产水深度的差异Fig.4 Significant difference in the annual water yield depth for different land cover type |
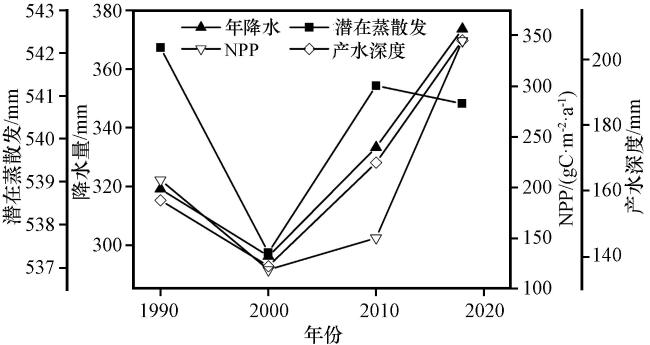
图5 研究区降水量、 潜在蒸散发、 NPP及产水深度均值的时间变化Fig.5 Temporal variation of precipitation, potential evapotranspiration, NPP and water yield depth in the study area |
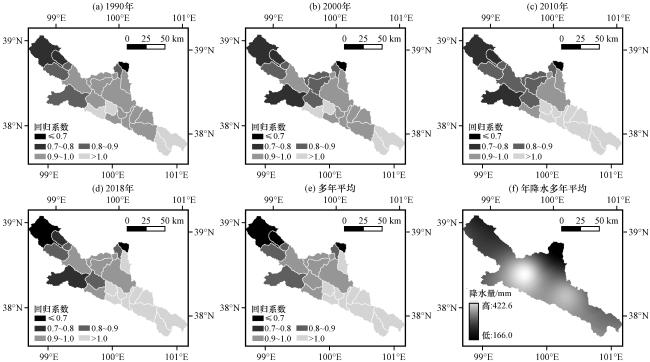
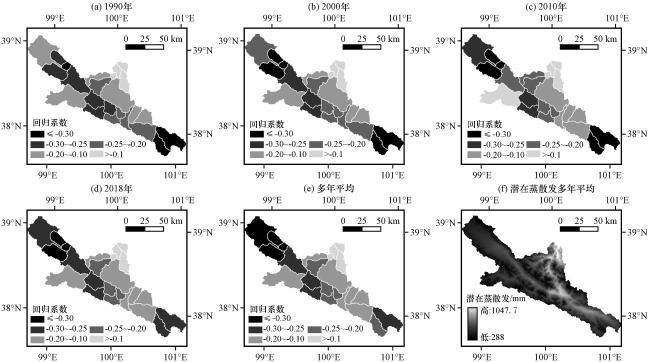
图7 潜在蒸散发对产水量影响的时空变化Fig.7 Spatiotemporal variation of potential evapotranspiration on water yield |
表2 黑河流域上游产水量时间变化Table 2 Temporal variation of water yield of the Upper Heihe River Basin |
| 年份 | 指标 | 研究区 | 农田 | 林地 | 灌丛 | 草地 | 河流 | 冰雪 | 荒漠 |
|---|---|---|---|---|---|---|---|---|---|
| 1990年 | 总量/(×108 m3) | 15.71 | 0.10 | 0.36 | 0.13 | 11.88 | 0.02 | 0.25 | 3.00 |
| 产水深度/mm | 157.07 | 182.98 | 88.95 | 114.10 | 146.86 | 174.15 | 272.36 | 238.49 | |
| 2000年 | 总量/(×108 m3) | 13.70 | 0.08 | 0.31 | 0.12 | 10.34 | 0.02 | 0.17 | 2.68 |
| 产水深度/mm | 137.01 | 138.50 | 69.28 | 98.96 | 128.06 | 144.76 | 250.90 | 217.72 | |
| 2010年 | 总量/(×108 m3) | 16.86 | 0.07 | 0.39 | 0.07 | 13.07 | 0.04 | 0.42 | 2.83 |
| 产水深度/mm | 168.56 | 125.34 | 82.55 | 115.31 | 159.74 | 165.12 | 289.85 | 262.60 | |
| 2018年 | 总量/(×108 m3) | 20.58 | 0.08 | 0.54 | 0.10 | 15.79 | 0.02 | 0.21 | 3.87 |
| 产水深度/mm | 205.80 | 191.78 | 111.84 | 159.73 | 195.73 | 181.52 | 328.24 | 301.95 |
3.3 黑河流域上游产水服务驱动因素探究
参考大量关于产水量驱动因素的研究成果(范亚宁等, 2017; 赵亚茹等, 2019; 宁亚洲等, 2020; 胡砚霞等, 2022), 发现产水量变化与降水量、 温度、 蒸散量、 气压、 风速等气候因子及土地利用变化等因素有关, 与降水量、 蒸散量、 植被净初级生产力NPP的相关性较高(王晓峰等, 2021)。本文选取降水量、 潜在蒸散发和NPP 这3个主要驱动因子, 借助ArcGIS10.2软件平台实现最小二乘法模型(Ordinary Least Square, OLS模型)和时空地理加权回归模型(GTWR模型)对驱动因子的分析。GTWR模型拟合结果中的修正的赤池信息量准则(corrected Akaike Information Criterion, AICc值)与OLS模型得到的AICc值分别为881.6和935.0, 其差值大于3, 表示GTWR模型的模拟结果更加合理, 与OLS模型的R 2(0.97)相比, GTWR模型的R 2增加至0.99, 进一步表明GTWR模型拟合结果更适用于研究区产水服务驱动因素探究。GTWR模型在不同年份和不同区域的回归系数不同, 反映出各驱动因素对产水量的影响存在时空差异。
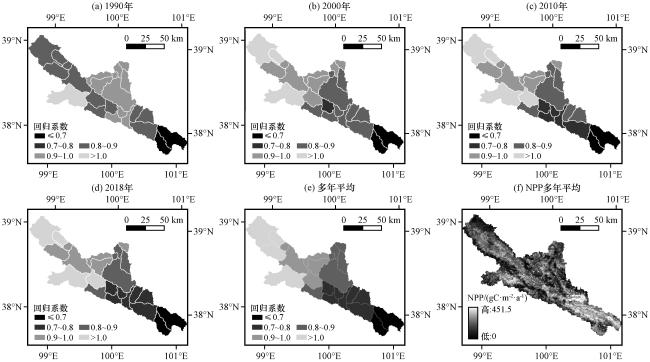
从研究区1990 -2018年降水量、 潜在蒸散发、 NPP及产水深度均值的时间变化(图5 )可知, 产水深度和降水量的变化趋势完全吻合。进一步结合空间维度来探究各驱动因素对产水量的影响(图6 ~8 )。1990 -2018年期间, 产水量与降水表现为正相关关系, 降水对研究区产水量变化正向效应显著, 同时表现出显著的空间异质性。4期平均水平上产水量与降水的GTWR回归系数的变化范围分布在0.66~1.54, 影响模式呈现由西北向东南逐渐增强的特点, 研究区西北部产水量对降水的敏感性程度相对较弱, 而敏感性较低的区域降水量相应较少。从时间序列上看, 2010年和2018年, 研究区降水对产水量的驱动强度呈现西北弱东南强较前期空间分布差异更大。1990 -2018年, 潜在蒸散发对产水量负向驱动明显, 4期平均水平上产水量与降水的GTWR回归系数的变化范围分布在-0.38~0.02, 影响模式整体上呈现西强中弱的特点, 中部以北区域产水量对蒸散发的敏感性程度最弱, 而该区域的潜在蒸散发相对较大。东南部区域潜在蒸散发对产水量的抑制作用在2018年较前期有明显减弱。植被净第一性生产力(NPP)对产水量影响的复杂性和差异性更加明显, 回归系数分布较为分散, 4期平均水平上回归系数变化范围分布在-0.25~0.09, 对产水的影响表现为在中部以南和东部大部分地区负向效应显著, 而西部则表现为正向驱动, 整体上负向驱动较强, 正向驱动微弱。从时间序列上看, 2010年和2018年, 西北部NPP正向驱动强度较前期(尤其1990年)有明显增加, 而东部NPP对产水量变化负向效应相比前期更加显著。


4 讨论
本文基于InVEST模型定量评价了黑河上游莺落峡水文站控制流域产水服务, 研究发现, 研究区产水量受降水正向驱动显著, 降水与产水量深度空间基本吻合, 降水量越高, 产水量越大。这与苏同宣(2021)研究发现以降水量增加为代表的气候变化是黑河上游产流增加的主要原因这一结论相一致。
本文通过研究NPP对产水量的影响间接分析植被对区域产水的影响, 发现NPP对产水具有一定抑制作用, 且发生在NPP值较高的区域, 这与Ran et al(2020)研究发现产水量与NPP之间以权衡关系为主的结论相一致, 此外, 杨明楠(2021)研究发现植被恢复情况下, 生态用水量增大, 径流量衰减。
区域产水受气候和土地利用综合影响, 气候变化通过影响植被及地表环境间接影响土地利用/覆被变化(孟宪红等, 2020; 赵倩倩等, 2021; 杨耀先等, 2022)。土地覆被变化对产水服务的影响是研究的难点, 本文的研究成果未能表现土地覆被变化对产流的直接影响。在生态恢复背景下, 研究区植被变化显著, 林地面积持续增加, 草地面积波动明显, 后续研究需要从更小的尺度量化植被动态对降雨产流产生的影响, 引导后期的生态恢复策略及实践。
5 结论
基于InVEST模型产水模块模拟研究区1990, 2000, 2010和2018年4期产水量, 揭示流域不同下垫面产水能力及差异, 采用时空地理加权回归方法(GTWR)探究流域产水服务的主要驱动因素。主要结论如下:
(1) 研究区产水量年代际波动较大, 产水服务整体不稳定。1990 -2018年4期产水总量均值为1.67×10⁹ m3, 产水深度均值为167.11 mm, 2018年产水量最高(205.80 mm), 2000年产水量最低(137.01 mm)。
(2) 1990, 2000, 2010和2018年研究区4期不同土地覆被类型面积在2000年后波动较大, 林地面积在1990年开始持续上升, 2000年后草地面积和荒漠面积存在陡增陡减, 相互转化的现象, 2010年较2000年大量荒漠转化成草原, 而2018年较2010年大量草原转化成荒漠。
(3) 从产水总量看, 研究区草地面积居多, 对研究区总产水量的贡献也最大(76.5%)。从平均产水深度看, 冰雪和荒漠平均产水深度最高, 林地最低。1990 -2018年, 同一土地覆被产水深度差异显著, 草地年际间产水总量存在大幅波动, 荒漠次之。
(4) 降水、 潜在蒸散发、 NPP 3个因素对产水量的影响存在明显的空间异质性。降水影响的正向效应显著(回归系数波动在0.66~1.54), 呈现由西北向东南逐渐增强的特点。潜在蒸散发对产水量负向驱动明显(回归系数波动在-0.38~0.02), 影响模式整体上呈现西强中弱的特点, 中部以北区域潜在蒸散发高值区域产水量对蒸散发的敏感性程度最弱。NPP对产水量影响的复杂性和差异性更加明显(回归系数波动在-0.25~0.09), 整体上负向驱动较强, 正向驱动微弱, 东部NPP高值区负向效应显著。