1 引言
2 观测资料和模式定制
2.1 观测数据
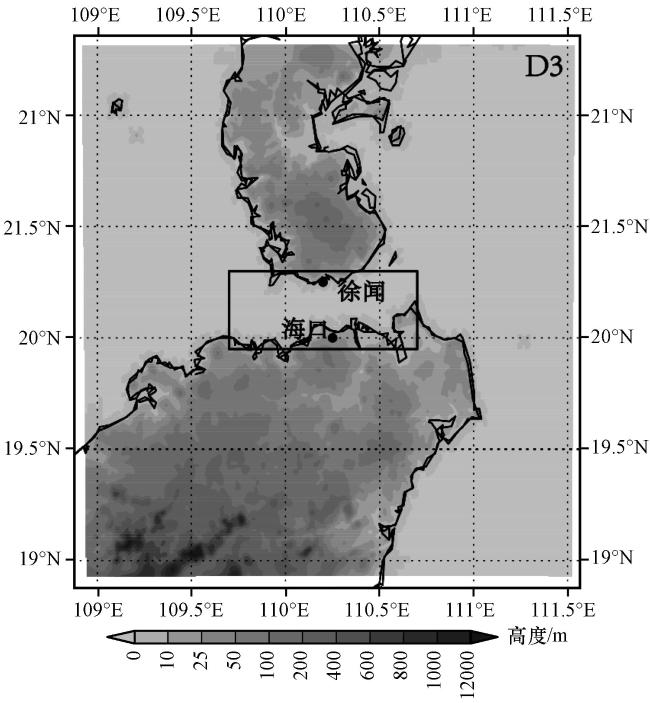
2.2 模式定制
表1 模式参数化设置Table 1 WRF physical parameterizations |
| 区域 | D1 | D2 | D3 |
|---|---|---|---|
| 水平格点 | 300×300 | 286×286 | 270×268 |
| 分辨率 | 9 km | 3 km | 1 km |
| 积云方案 | Kain-Fritsch | 不使用 | 不使用 |
| 微物理方案 | Lin | Lin | Lin |
| 边界层方案 | YSU | YSU | YSU |
| 辐射方案 | RRTM长波/Dudhia短波 | RRTM长波/Dudhia短波 | RRTM长波/Dudhia短波 |
| 陆面方案 | Noah | Noah | Noah |
3 海雾过程简介
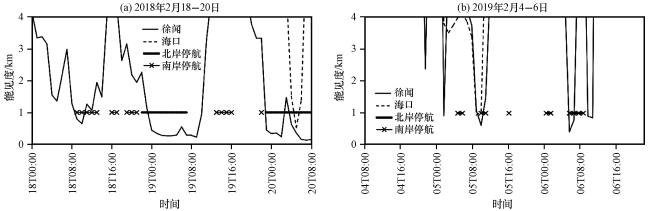
3.1 能见度实况
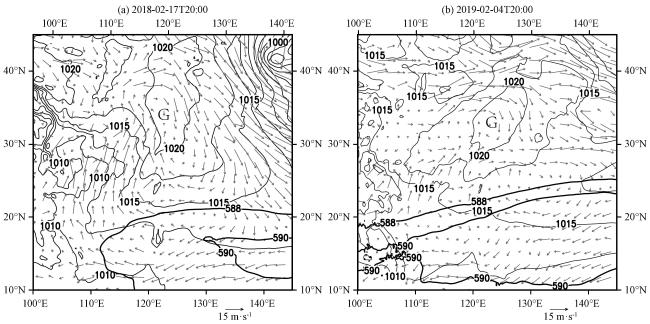
3.2 大气环流形势背景
4 数值模拟结果验证
4.1 大雾水平分布的对比分析
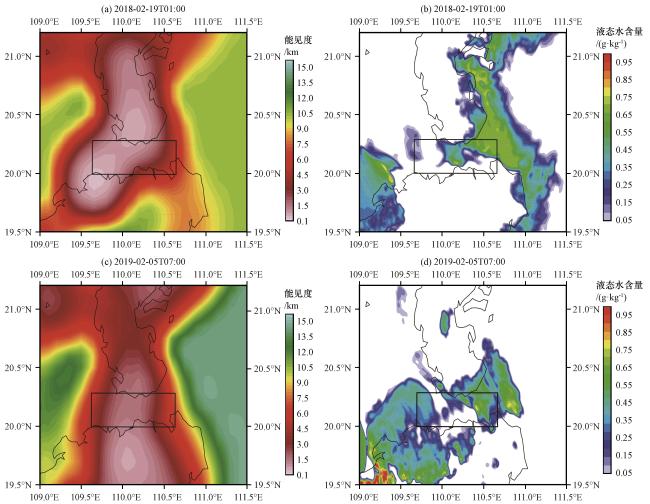
图4 CLDAS能见度(左, 单位: km)和模拟的15 m高处大于0.05 g·kg-1液态水含量(右, 单位: g·kg-1)的水平分布方框代表琼州海峡区域 Fig.4 The horizontal distributions of observed visibility (left, unit: km) from CLDAS Data and simulated liquid water content that more than 0.05 g·kg-1 (right, unit: g·kg-1) at the height of 15 m.Square frame indicates the QiongZhou Strait |
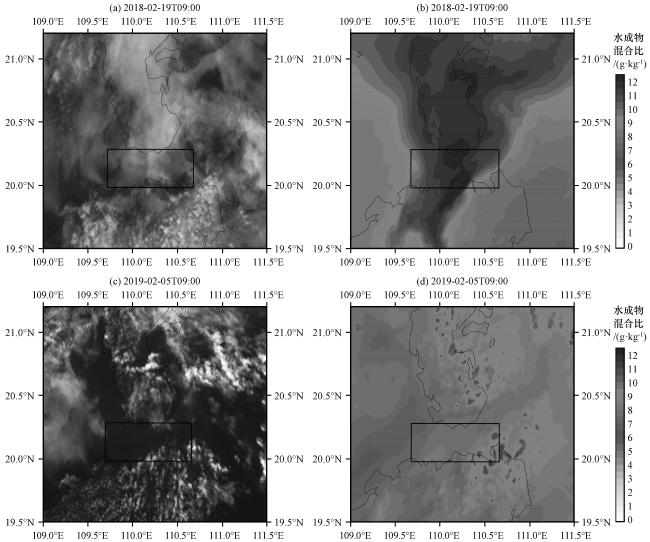
4.2 云区分布的对比分析
4.3 站点气象要素对比
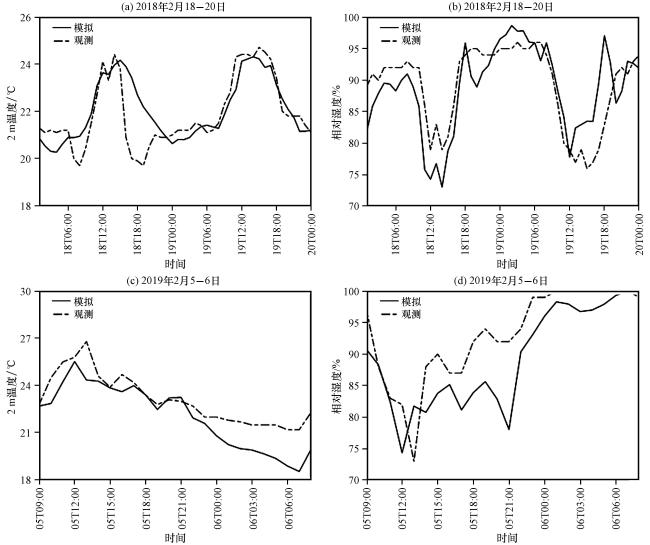
5 模拟结果分析
5.1 海雾发展过程
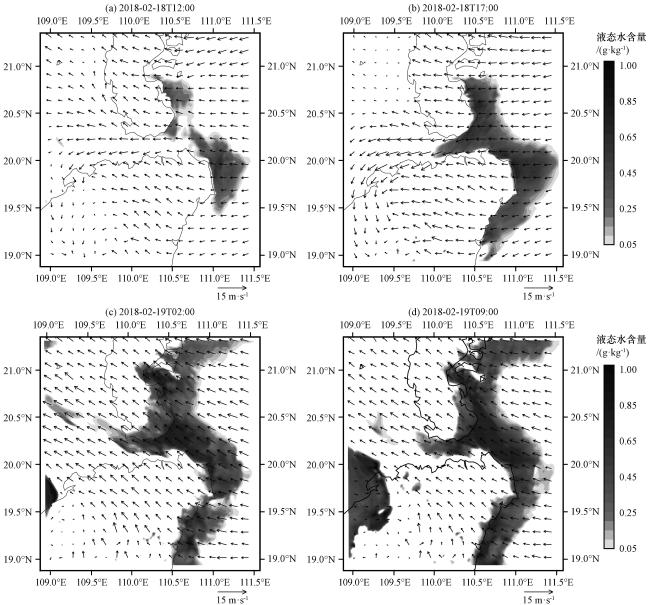
图7 2018年2月19日模拟的15 m高度液态水含量(阴影, 单位: g·kg-1)和100 m高度风场(矢量, 单位: m·s-1)的水平分布Fig.7 Simulated horizontal distributions of liquid water content (shaded, unit: g·kg-1) at the height of 15 m, and wind fields (vector, unit: m·s-1) at the height of 100 m on 19 February 2018 |
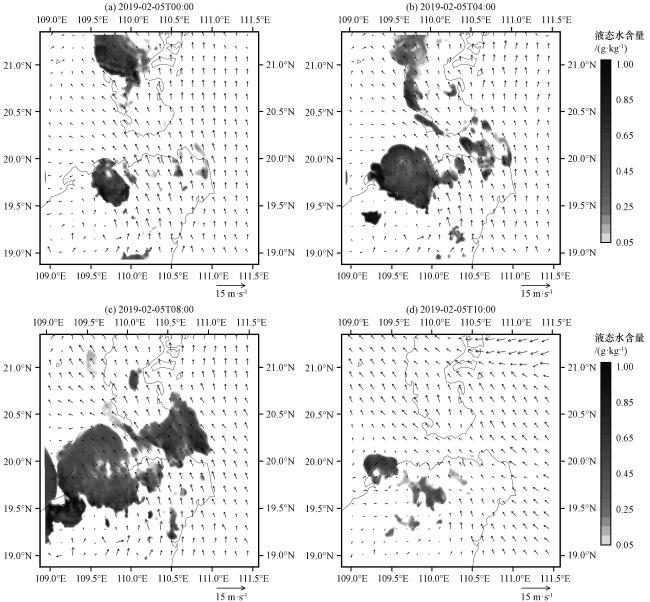
5.2 海雾成因对比分析
5.2.1 水汽条件
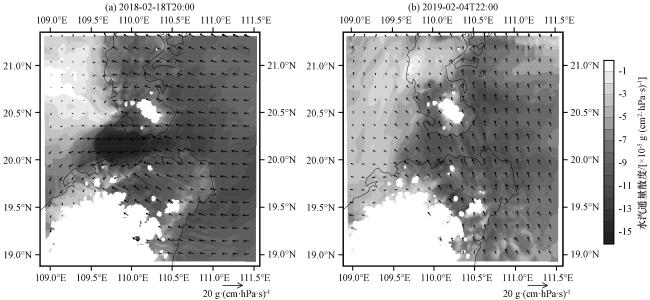
图9 模拟的1000 hPa的水汽通量散度[阴影, 单位: ×10-5 g·(cm2·hPa·s)-1]和水汽通量[矢量, 单位: g·(cm·hPa·s)-1]Fig.9 Simulated divergence of water vapor flux [shaded, unit: ×10-5 g·(cm2·hPa·s)-1] and water vapor flux [vector, unit: g·(cm·hPa·s)-1] at 1000 hPa |
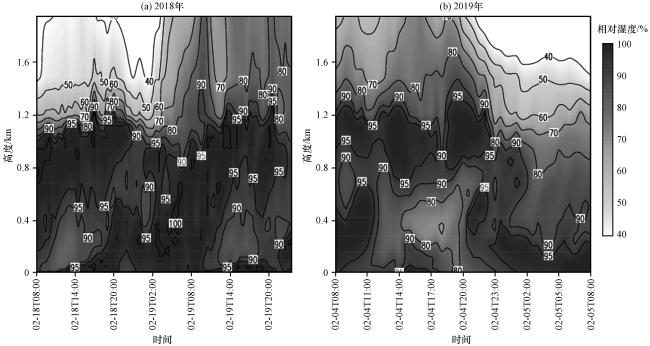
5.2.2 动力条件
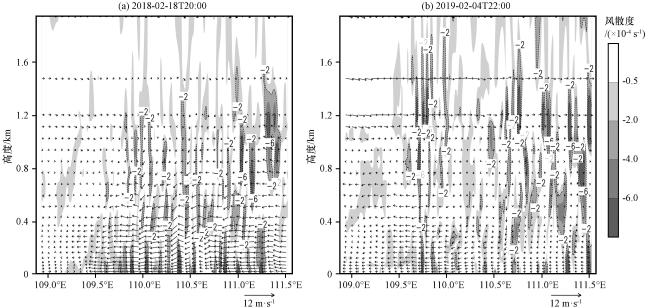
图11 模拟的过琼州海峡(20.1°N)风场 (矢量, 单位: m·s-1)及其散度(阴影, 单位: ×10-4 s-1)的垂直剖面虚线范围为散度小于-2×10⁻⁴ s-1的区域 Fig.11 Vertical section across QiongZhou Strait (20.1°N) of wind field (vector, unit: m·s-1) and the simulated divergence (shaded, unit: ×10-4 s-1).The dotted line range is the area that divergence less than -2×10⁻⁴ s-1 |