

1 引言
2 资料来源与方法介绍
2.1 数据资料
2.2 检验及评估方法
3 模式设置及模拟效果检验
3.1 WRF模式模拟参数设置
3.2 WRF数值模拟效果检验
3.3 敏感性数值试验设计
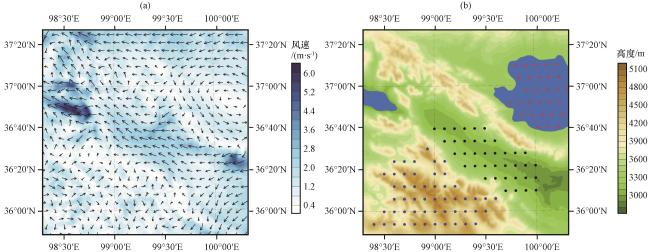
图5 d03区域内2017年7月95 m高度平均风速(彩色区, 单位: m·s-1)和风向(矢量)(a)以及d03区域内风机排布位置(实心圆点)及地形高度(彩色区, 单位: m)(b)试验一为黑色圆点, 试验二为蓝色圆点, 试验三为红色圆点 Fig.5 Averaged wind speed (color area, unit: m·s-1) and wind direction (vector) at 95-meter during July 2017 (a), terrain heights (color area, unit: m) and the location (solid dots) of wind farms will be installed (b).Black, blue, and red dots represent EXP1, EXP2 and EXP3, respectively |
表1 数值试验设计Table 1 Numerical experiment design |
| 试验名称 | 风电场下垫面 | 装机量 | 风机参数化方案 |
|---|---|---|---|
| 参照试验 | 无 | 无 | 无 |
| 试验一 | 平坦峡谷 | 约9 GW(2936台风机) | Fitch风机方案及GW150-3.0风机 |
| 试验二 | 高海拔山地 | 约9 GW(2951台风机) | Fitch风机方案及GW150-3.0风机 |
| 试验三 | 青海湖水体 | 约9 GW(2995台风机) | Fitch风机方案及GW150-3.0风机 |
4 风电场对局地气候的影响分析
4.1 对近地层风速的影响
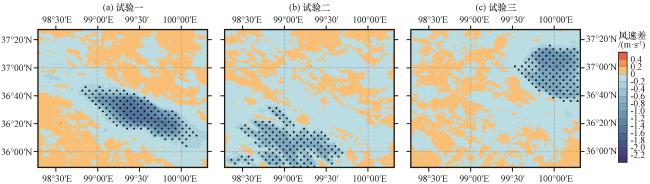
图6 3组敏感性试验与参照试验轮毂高度(95 m)日平均风速差值(单位: m·s-1)打点区为通过90%显著性检验区域 Fig.6 Daily mean wind speed difference at hub height (95-meter) between different sensitivity experiments and control experiment.Unit: m·s-1.Regions with 90% confidence level of differences calculated based on the contrast experiment t-test in Section 2.1 are highlighted with black dots |
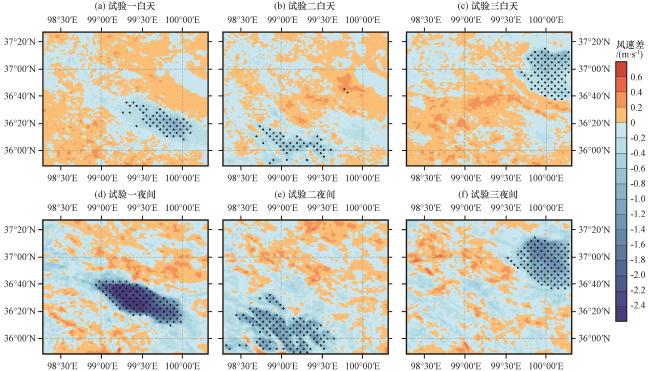
图7 3组敏感性试验与参照试验白天与夜间轮毂高度(95 m)风速的差值(单位: m·s-1)打点区为通过90%显著性检验区域 Fig.7 Daytime and nighttime mean wind speed difference at hub height (95-meter) between different sensitivity experiments and control experiment.Unit: m·s-1.Regions with 90% confidence level of differences calculated based on the contrast experiment t-test in Section 2.1 are highlighted with black dots |
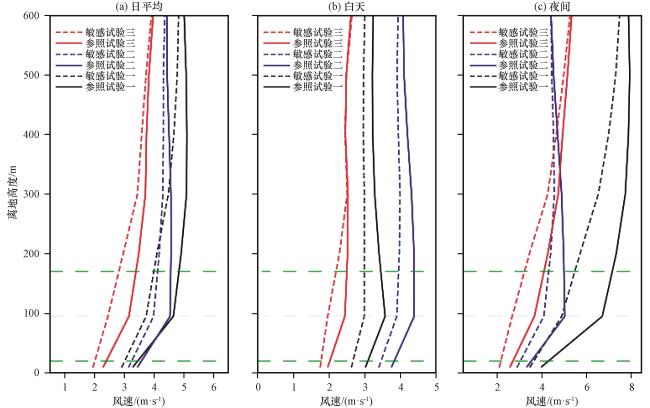
图8 3组敏感性试验中典型区域平均的风速垂直变化特征灰色横虚线为风机轮毂高度, 绿色横虚线为风机叶片扫风范围 Fig.8 Vertical mean wind speeds of different sensitivity experiments and control experiment in typical regional.The dashed gray and green line represent the hub height of the wind turbines and range swept by wind turbines blade, respectively |
4.2 对近地层气温的影响
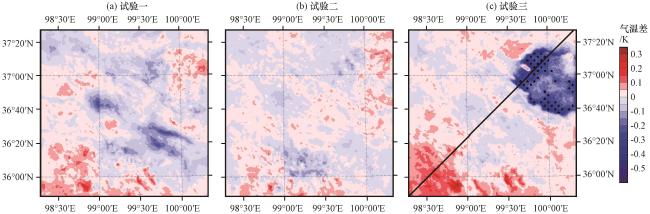
图9 3组敏感性试验与参照试验地面2 m日平均气温差值(单位: K)打点区为通过90%显著性检验区域 Fig.9 Daily mean 2-meter temperature difference between different sensitivity experiments and control experiment.Unit: K.Regions with 90% confidence level of differences calculated based on the contrast experiment t-test in Section 2.1 are highlighted with black dots |
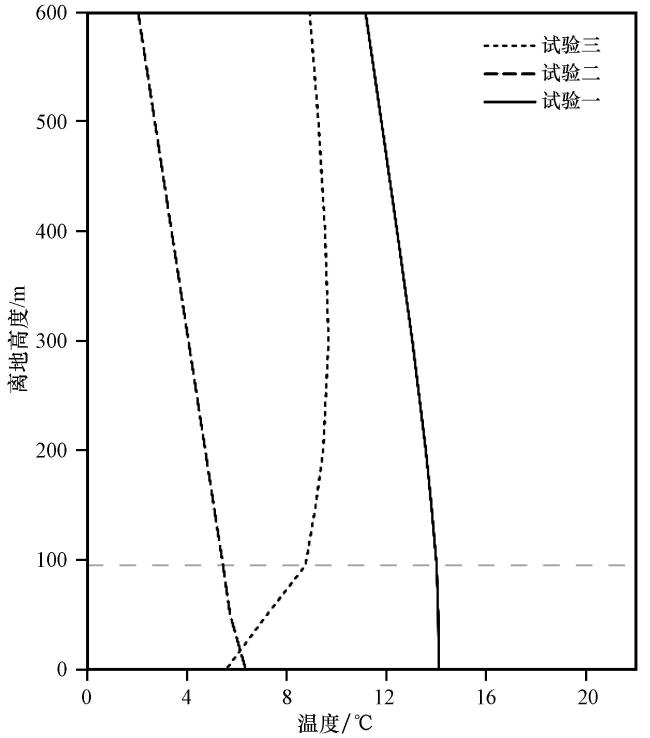
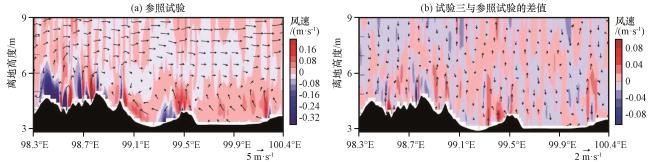
图11 沿图9(c)黑线截面的夜间平均垂直风速(彩色区, 单位: m·s-1)及u、 w合成风(矢量, u和w×100合成风, 单位: m·s-1)垂直剖面Fig.11 Averaged vertical velocity (color area, unit: m·s-1) and the vertical cross-section of the combined wind of u and w in nighttime (vector, combined wind of u and w×100, unit: m·s-1) along the black line in Fig.9(c) |
4.3 对近地面湿度的影响
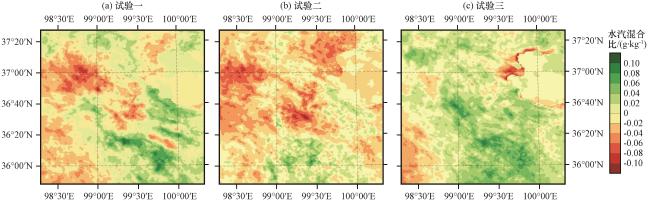
图12 3组敏感性试验与参照试验地面2 m日平均水汽混合比差值(单位: g·kg-1)Fig.12 Daily mean 2-meter water vapor mixing ratio between different sensitivity experiments and control experiment.Unit: g·kg-1.Regions with 90% confidence level of differences calculated based on the contrast experiment t-test in Section 2.1 are highlighted with black dots |
4.4 对边界层高度的影响
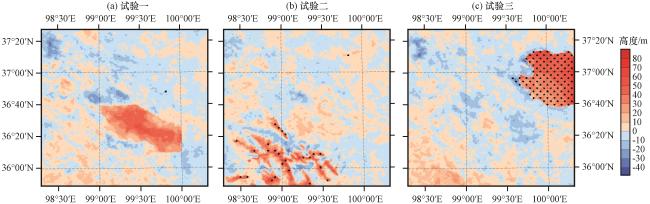


图13 3组敏感性试验与参照试验边界层高度差值(单位: m)打点区为通过90%显著性检验区域 Fig.13 Daily mean planetary boundary layer height between different sensitivity experiments and control experiment.Unit: m.Regions with 90% confidence level of differences calculated based on the contrast experiment t-test in Section 2.1 are highlighted with black dots |