1 引言
2 资料选取
3 降水概况及特点
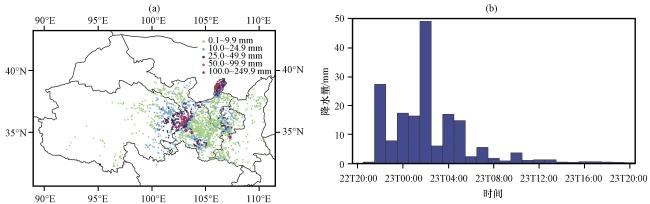
4 大尺度环流特征及环境条件
4.1 环流特征
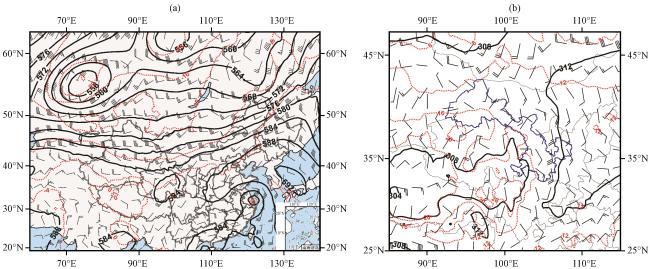
图2 2018年7月22日14:00 500 hPa(a)及700 hPa(b)位势高度场(黑色等值线, 单位: dagpm)、 温度场(红色等值线, 单位: ℃)及风场(风羽, 单位: m·s-1)分布Fig.2 Distribution of 500 hPa (a) and 700 hPa (b) geopotential height field (black contour, unit: dagpm), temperature field (red contour, unit: ℃) and wind field (barb, unit: m·s-1) at 14:00 on 22 July 2018 |
4.2 环境场特征
4.2.1 水汽条件
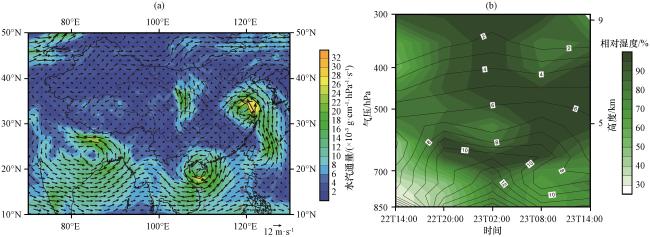
图3 2018年7月23日02:00 700 hPa水汽通量(a, 单位: ×10-3 g·cm-1·hPa-1·s-1)及22日14:00至23日14:00罗山村比湿(等值线, 单位: g·kg-1)、 相对湿度(阴影区, 单位: %)的时间-高度剖面(b)(a)中矢量为风场分布(单位: m·s-1) Fig.3 Distribution of moisture flux on 700 hPa at 02:00 on 23 July (a, unit: ×10-3 g·cm-1·hPa-1·s-1), time-height profile of specific humidity (contour, unit: g·kg-1) and relative humidity (the shaded, unit: %) at Luoshan village station from 14:00 on 22 to 14:00 on 23 July 2018.In Fig.3(a), the vector denotes wind field (unit: m·s-1) |
4.2.2 不稳定能量条件
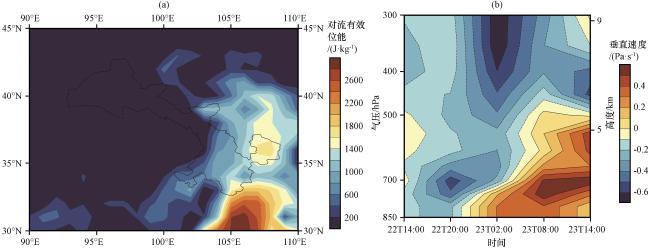
图4 2018年7月22日20:00的对流有效位能分布(a, 单位: J·kg-1)及22日14:00至23日14:00永靖罗山村垂直速度的时间-高度剖面(b, 单位: Pa·s-1)Fig.4 Distribution of convection effective potential energy at 20:00 on 22 (a, unit: J·kg-1), time-height profile of vertical velocity at Luoshan village station from 14:00 on 22 to 14:00 on 23 (b, unit: Pa·s-1) July 2018 |
4.2.3 抬升条件
5 中尺度对流系统的结构、 发展及其触发机制
5.1 FY-4云图上中尺度对流系统的结构特征
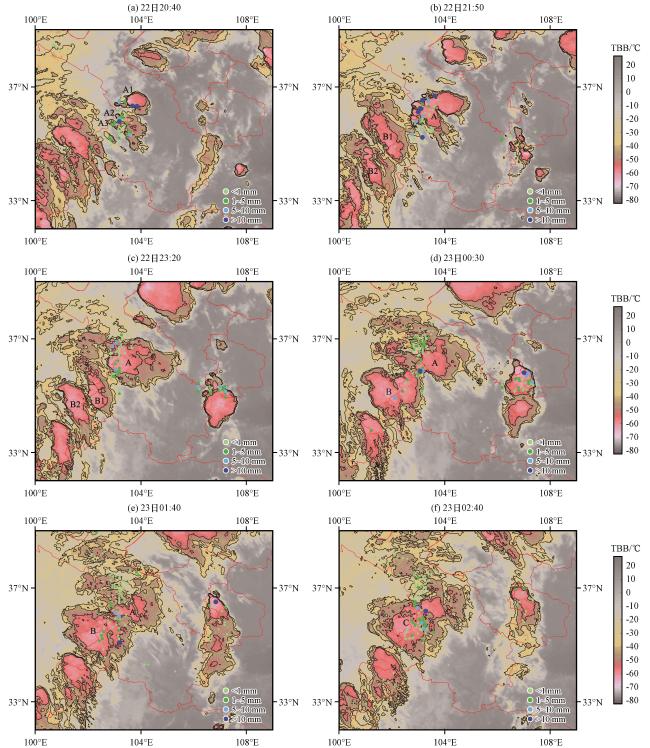
图5 2018年7月22 -23日FY-4高分辨率红外云图云顶亮温(彩色区, 单位: ℃)及区域站10 min降水量(圆点, 单位: mm)的变化Fig.5 FY-4A infrared satellite TBB (color area, unit: ℃) and variation of precipitation (dot, unit: mm) in 10 minutes divided into four degrees (<1 mm, 1~5 mm, 5~10 mm and >10 mm) at regional stations from 22 to 23 July 2018 |