
1 引言
1.1 冷事件在变暖背景下的响应
1.2 冷事件相关的影响因子
2 资料选取与方法介绍
2.1 资料选取
2.2 冷事件的挑选
2.3 波作用通量(T-N通量)
3 结果分析
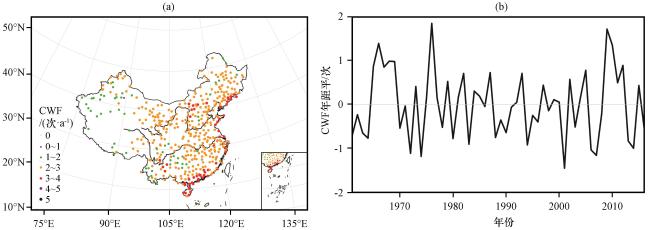
3.1 中国区域CWF的变化特征
3.2 CWF年际变化与NAO/AO之间的联系及其差异
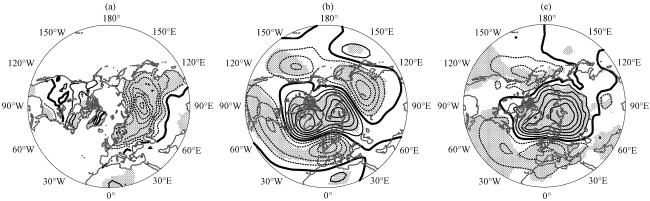
图2 1961 -2016年冬季CWF指数[定义为图1(b)对应的时间序列]与表面气温(a, 单位: ℃)、 500 hPa位势高度(b, 单位: gpm)以及海平面气压场(c, 单位: hPa)的线性回归系数分布打点表示通过0.10信度检验区域 Fig.2 Regressed surface air temperature (a, unit: ℃), 500 hPa geopotential height (b, unit: gpm) and sea level pressure (c, unit: hPa) onto the CWF index during winter of 1961 -2016.Stippled regions are statistically significant at the 0.10 level |
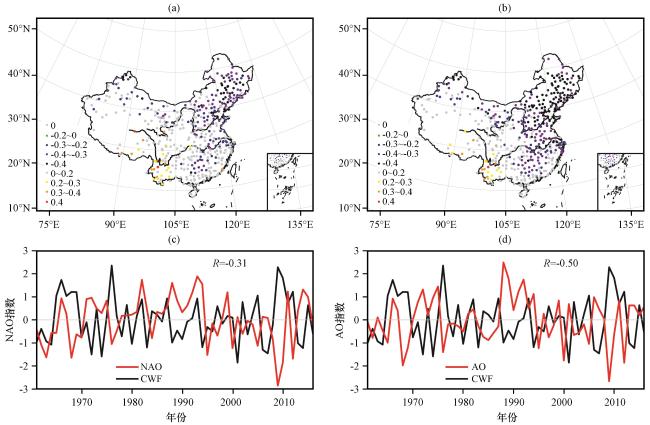
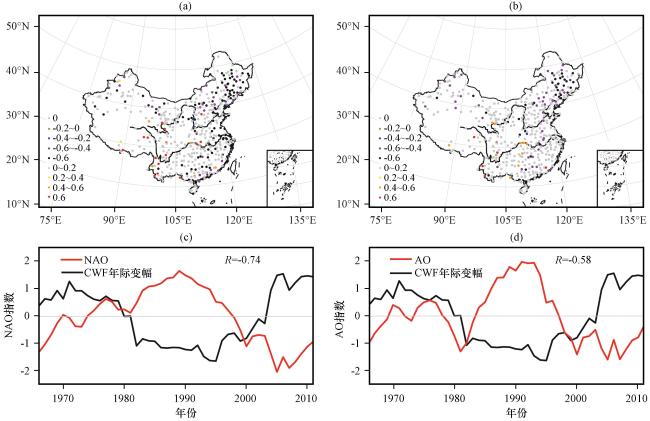
图3 NAO指数(a)、 AO指数(b)与中国457个站点CWF的相关系数分布(a, b), 标准化的NAO指数(c)、 AO指数(d)与中国区域平均CWF指数序列(c, d)灰色圆圈均为没有通过0.10信度检验的站点 Fig.3 Distribution correlation coefficients between the CWF of 457 stations in China and NAO index (a), AO index (b), the standardized time series of CWF index and NAO index (c), AO index (d).The gray dots indicate that correlation coefficient of the station cannot exceed 0.10 confidence level |
表1 超过CWF指数一个标准差的年份及其对应的CWF指数、 AO指数和NAO指数Table 1 The CWF index, AO index and NAO index corresponding to the year exceeding one standard deviation |
| 年份 | CWF异常偏多年 | 年份 | CWF异常偏少年 | ||||
|---|---|---|---|---|---|---|---|
| CWF | AO | NAO | CWF | AO | NAO | ||
| 1965年 | 1.05 | -0.99 | -0.56 | 1961年 | -1.01 | -0.07 | -0.36 |
| 1966年 | 1.73 | 0.92 | 0.94 | 1964年 | -1.08 | -0.46 | -0.57 |
| 1967年 | 1.03 | 0.39 | 0.26 | 1972年 | -1.5 | 1.32 | 0.96 |
| 1968年 | 1.21 | -1.98 | -1.64 | 1974年 | -1.59 | 0.96 | 0.3 |
| 1969年 | 1.21 | -1.21 | -0.63 | 1980年 | -1.04 | -0.5 | 0.23 |
| 1976年 | 2.36 | -1.4 | -1.05 | 1983年 | -1.2 | -0.26 | 0.46 |
| 2005年 | 1.05 | -1.04 | -1.12 | 1994年 | -1.18 | 1.12 | 1.55 |
| 2009年 | 2.28 | -2.66 | -2.85 | 2001年 | -1.85 | 0.69 | 0.12 |
| 2010年 | 1.82 | -0.63 | -1.85 | 2006年 | -1.3 | 0.98 | 0.14 |
| 2012年 | 1.22 | -1.86 | -1.68 | 2007年 | -1.46 | 0.47 | 0.08 |
| 2013年 | -1.01 | 0.63 | 0.4 | ||||
| 2014年 | -1.22 | 0.63 | 1.31 | ||||
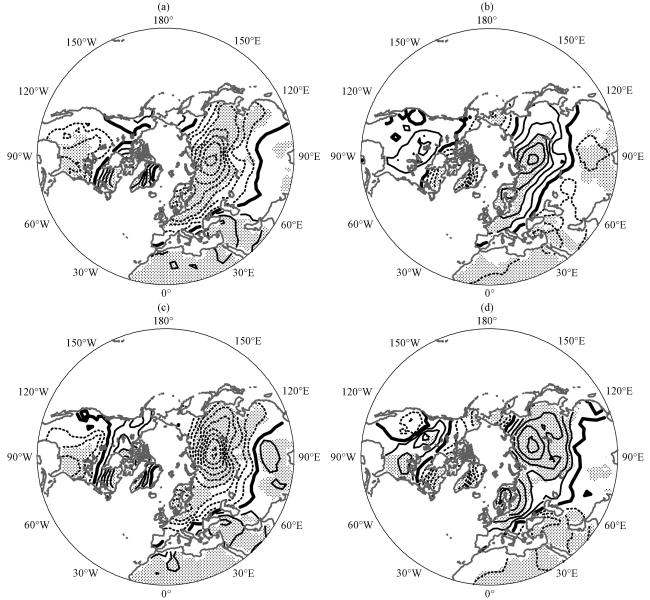
图4 冬季表面气温异常在NAO负异常年(a)、 NAO正异常年(b)、 AO负异常年(c)、 AO正异常年(d)的合成分布(等值线, 单位: ℃)打点表示通过0.10信度检验的区域 Fig.4 Composites of surface air temperature anomalies (contours, unit: ℃) for winter in negative NAO years (a), positive NAO years (b), negative AO years (c) and positive AO years (d).Stippled regions are statistically significant at the 0.10 level |
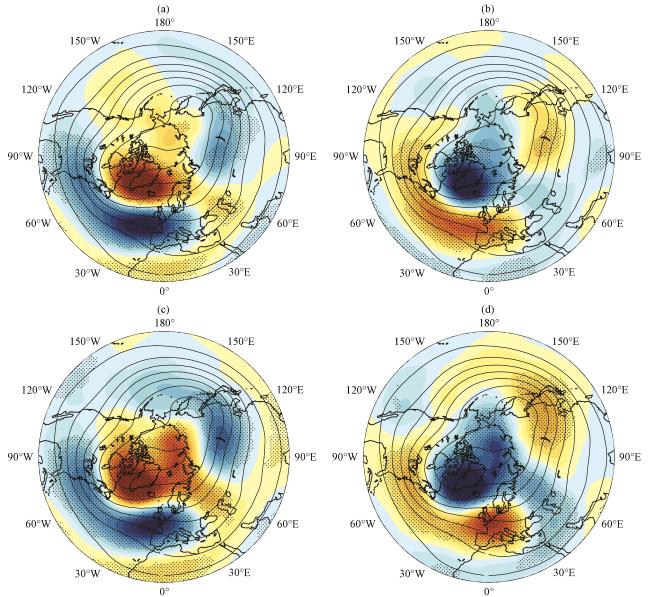
图5 冬季500 hPa高度异常在NAO负异常年(a)、 NAO正异常年(b)、 AO负异常年(c)、 AO正异常年(d)的合成分布(阴影, 单位: gpm)等值线为1961 -2016年冬季平均的500 hPa高度场, 打点表示通过0.10信度检验的区域 Fig.5 Composites of 500 hPa geopotential height anomalies for winter (shaded, unit: gpm) in negative NAO years (a), positive NAO years (b), negative AO years (c) and positive AO years (d).The contours are the averaged 500 hPa height field in winter from 1961 to 2016, stippled regions are statistically significant at the 0.10 level |
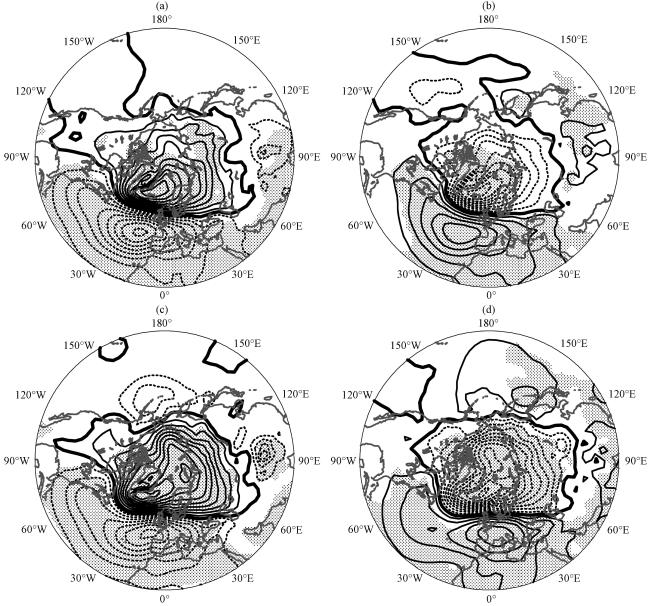
图6 冬季海平面气压异常在NAO负异常年(a)、 NAO正异常年(b)、 AO负异常年(c)、 AO正异常年(d)的合成分布(等值线, 单位: hPa)打点表示通过0.10信度检验的区域 Fig.6 Composites of sea level pressure anomalies (contours, unit: hPa) for winter in negative NAO years (a), positive NAO years (b), negative AO years (c) and positive AO years (d).Stippled regions are statistically significant at the 0.10 level |
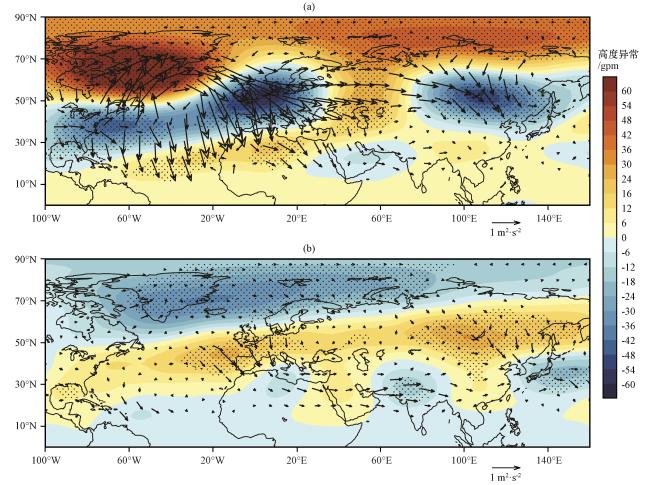
图7 冬季300 hPa高度异常(阴影, 单位: gpm)和波作用通量(矢量, 单位: m²·s-²)在CWF异常偏多年(a)、 CWF异常偏少年(b)的合成分布打点表示通过0.10信度检验的区域 Fig.7 Composites of 300 hPa wave activity fluxes anomalies (vectors, unit: m²·s-²) and geopotential height anomalies (shaded, unit: gpm) for winter in significant more CWF years (a) and significant less CWF years (b).Stippled regions are statistically significant at the 0.10 level |
3.3 CWF年际变幅的年代际变化归因
图8 11年滑动平均后的NAO指数(a)、 AO指数(b)与中国457个站点11年滑动窗口CWF年际变幅的相关系数分布(a, b); 标准化11年滑动平均后的NAO指数(c)、 AO指数(d)与标准化11年滑动窗口CWF年际变幅序列(c, d)灰色圆圈均为没有通过0.10信度检验的站点 Fig.8 The distribution of correlation coefficients between the variance of interannual variation of CWF in 11-year running window and 11-year-running average NAO index (a), AO index (b), and the standardized time series of the variance of interannual variation of CWF in 11-year running window and 11-year-running average NAO index (c), AO index (d).The gray dots indicate that the stations in China cannot exceed 0.10 confidence test |