
1 引言
以地球系统科学为指导的全球气候变化研究是当今科学领域的一个重大课题(Alley et al, 2003; 王绍武, 2011; Cheng et al, 2012), 据IPCC第五次评估报告: 1880 -2012年全球平均地表温度升髙了0.86 ℃; 1951 -2012年, 全球平均地表温度的升温速率为0.12 ℃·(10a)-1, 几乎是1880年以来升温速率的两倍(IPCC, 2013; 秦大河等, 2007)。地处我国西北的干旱半干旱地区, 在近50年来变暖的强度就明显高于全国平均值, 以0.2 ℃·(10a)-1的趋势升温(王鹏祥等, 2007; 李新武等, 2016)。除了观察到温度呈现出升温的变化趋势, 愈来愈多的研究发现, 越来越多的地区降水也呈增加的变化趋势, 不管是降水的频率、 强度亦或是降水量, 而且区域间的差异也更加明显(许建伟等, 2020)。祁连山地区受西风带、 偏南季风(南亚季风和高原季风)和东亚季风的共同影响, 是多个复杂气候系统的过渡区, 气候较为干燥, 使该区对气候变化的响应更为敏感(戎战磊, 2019; 张良等, 2014a, 2014b)。
针对祁连山地区气温和降水长时间尺度的研究, 前人已经做了大量的工作。祁连山气候变化的研究成果较多, 付建新等(2018)应用R/S分析法结合ArcGIS对祁连山地区气候变化作了相应的研究, 结果显示祁连山地区气温变化趋势为波动上升, 整体上表现出西南部气温低, 东、 北部气温高; 贾文雄等(2008, 2012)对祁连山多年极端气候的时空变化进行了研究, 认为祁连山地区极端高温天气和极端降水事件呈显著增加趋势, 山区对全球气候变暖的响应更为敏感; 张存杰和郭妮(2002)将祁连山地区开始出现变暖的时间界定到了20世纪80年代, 除此之外, 还有好多学者(刘琼等, 2018; 孟秀敬等, 2012; 林纾等, 2014; 曹立国等, 2014; 折远洋等, 2020; 王海军等, 2009)都对祁连山北麓地区的气候变化特征进行了大量的研究, 但大都注重于单一气象因子或是典型极端气候事件的分析。本文以祁连山北麓及其附近地区为研究区域, 搜集整理了1965 -2018年各代表性站点的气温和降水数据, 从时间和空间尺度上对其变化格局进行了分析, 在研究内容和时间序列上是前人研究的改进和补充, 研究结果可为当地政府应对气候变化和防灾减灾提供决策依据。
2 研究区域与研究方法
2.1 研究区域
研究区位于祁连山北麓, 地理坐标为37°17′N -42°48′N, 92°12′E -103°48′E。东起乌鞘岭, 西至甘肃、 新疆两省界, 南与祁连山和青海省相接, 处于内蒙古高原、 黄土高原和青藏高原的三大高原交会处, 自然条件复杂, 使得处于该区域的水文、 土壤、 气候、 生物等具有不同的生态格局。行政区包括嘉峪关、 酒泉、 张掖、 金昌、 武威(除天祝县在黄河流域的一部分)5个地级市以及白银景泰县的一部分。河流有石羊河、 黑河和疏勒河三大水系, 出山口大小河流共有58条。气候属大陆性干旱气候, 冷热变化剧烈, 风大沙多, 气候干燥。年均温5.8~9.3 ℃, 年降水量少且分布不均匀, 日照时间长, 光照资源丰富。自东而西年降水量渐少, 干燥度渐大。降水年际变化大, 夏季降水占全年总量50%~60%, 春季15%~25%, 秋季10%~25%, 冬季3%~16%(候启等, 2020)。
2.2 研究方法
2.2.1 数据来源
由于祁连山北麓及附近地区部分站点建站较晚或记录缺失, 为保证各站点资料的同步性, 建立较为完整的气候序列, 选取祁连山北麓及其附近地区具有典型代表性的12个气象站1965 -2018年逐月的气温和降水的监测资料, 时间跨度为1965年1月1日至2018年12月31日, 站点气温和降水数据均来源于中国气象数据网http: //data.cma.cn/。文中通过均值法和回归法进行插补, 为了更好地“修复”原值, 本文引入层次聚类方法, 首选对气温和降水数据进行归类分层, 然后利用组内均值法进行插补。同时使用多元回归分析方法对12个气象站1965 -2018年逐月的气温和降水进行了重建, 通过与实际观测值的误差分析, 得到采用多元回归重建的模拟预估值具有较高的精度, 能很好地反映12个气象站逐月的气温和降水变化规律和特征, 具体的计算步骤参考余予等(2012)和黄嘉佑(2000)的技术思路, 确保监测数据的真实性和有效性。各气象站点分布及地理位置见图1 和表1 。
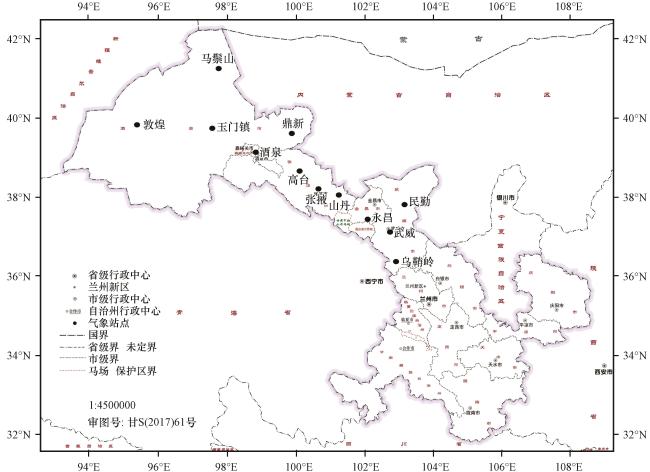
图1 祁连山北麓及其附近地区气象站点分布示意图Fig.1 The distribution of the meteorological stations in northern parts of Qilian Mountains and the nearby regions |
表1 祁连山北麓及其附近地区气象站点地理位置表Table 1 The location of the meteorological stations in northern parts of Qilian Mountains and the nearby |
| 地理要素 | 乌鞘岭 | 武威 | 民勤 | 永昌 | 山丹 | 张掖 | 高台 | 酒泉 | 鼎新 | 玉门镇 | 敦煌 | 马鬃山 |
|---|---|---|---|---|---|---|---|---|---|---|---|---|
| 经度/(°E) | 102.87 | 102.87 | 103.09 | 101.93 | 101.08 | 100.28 | 99.83 | 98.49 | 99.52 | 97.03 | 94.68 | 97.03 |
| 纬度/(°N) | 37.20 | 37.89 | 38.63 | 38.22 | 38.79 | 39.80 | 39.37 | 39.77 | 40.31 | 40.27 | 40.14 | 41.80 |
| 海拔/m | 3045.10 | 1540.20 | 1367.50 | 2093.90 | 1765.50 | 1461.10 | 1332.20 | 1477.20 | 1177.40 | 1526.00 | 1137.50 | 1770.40 |
本研究对祁连山北麓及其附近地区气温和降水量的季节、 年代际进行了划分, 其中季节分为4个季节: 春季(3 -5月)、 夏季(6 -8月)、 秋季(9 -11月)、 冬季(12月至翌年2月)。年代际划分为6个阶段: 1965 -1969年, 1970 -1979年, 1980 -1989年, 1990 -1999年, 2000 -2009年和2010 -2018年。将12个气象站的气温和降水量数据进行处理后, 利用一元线性趋势分析法分析气温和降水的年际、 年代际、 季节变化趋势; 利用Mann-Kendall趋势检验进行气温和降水的突变检验; 利用Morlet小波变换法对气温和降水进行变化周期分析, 结合反距离加权插值法(IDW), 对气候因子的空间分布特征进行插值。
2.2.2 分析方法
本文采用一元线性回归模型定量分析气候要素变化的线性趋势, 针对气候的突变分析和年代际的周期变化采用Mann-Kendall检验和Morlet小波分析。
(1) Mann-Kendall突变检验是指在时间和空间上, 气候要素均表现为从一个统计特性到另一个统计特性的激烈变化(Gocic and Trajkovic, 2013), 具体算法如下:
假设有 个样本量的 , 拟合一个秩序列:
式中: 表示时间序列x的第i个值大于第j个值的数量累计值。
在时间序列随机独立的假设条件下, 构造如下统计量:
式中: UF 1=0; E(Sk )是秩序列Sk 的均值; Var(Sk )是其方差。
时间序列x的各样本值连续分布且互相独立的条件下:
以时间尺度上的x顺序x 1, x 2,…, xn 为基数的统计量 呈正态分布, 在进行显著性检验时, 设定显著性水平α, 则时间序列x变化趋势明显。同理, 将x序列倒置, 得到新的秩序列 , 式中UB 1=0, K=n, n-1,…,1。
(2) Morlet小波分析亦称多分辨率分析, 是较为成熟的数理统计方法(罗光坤, 2007)。具体算法如下:
小波函数:
式中: ψ(t)为基本小波函数。通过在时间轴上进行缩放和平移, 形成一组函数:
式中: ψa, b (t)为子小波; a表示伸缩尺度; b表示平移距离。
小波变换: 根据(7)式中的小波函数ψa, b (t), 以及既定的有线信号f(t)∈ L 2(R), 可以进行如下小波变换:
式中: Wf (a, b)是变换系数; f(t)是单位平方可积函数; a是伸缩尺度; b是平移参数; 为 的复共轭函数。
小波方差:
式中: Var(a)为小波方差; Wf (a, b)是变换系数; a是伸缩尺度, b是平移参数区域。
3 结果与讨论
3.1 气温和降水量的时间变化
3.1.1 气温和降水量的年际变化
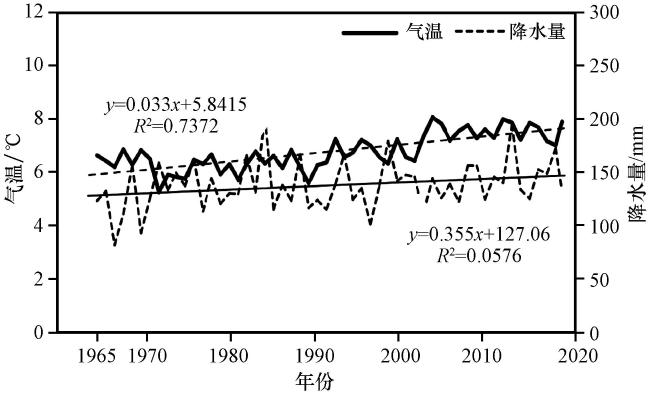
祁连山北麓及附近地区1965 -2018年气温和降水均呈上升趋势(图2 )。近半个多世纪以来, 祁连山北麓及附近地区平均气温为7.68 ℃, 最大值8.07 ℃, 最小值5.22 ℃; 平均降水量140.17 mm, 最大值201.58 mm, 最小值为81.2 mm(图2 )。气温和降水量的倾向率分别为0.33 ℃·(10a)-1和3.55 mm·(10a)-1, 这与施雅风等(2003)研究的西北地区由暖干向暖湿转型结论相符合。相较于降水来说, 气温上升趋势更为显著, 倾向率为0.33 ℃·(10a)-1, 高于全国平均水平0.22 ℃·(10a)-1, 与西北地区的增温速率0.2~0.9 ℃·(10a)-1较为一致(王鹏祥等, 2007)。平均最高气温上升趋势更为明显, 说明最高气温对气温上升贡献最大, 气候变化由暖干向暖湿转型; 该区域平均气温变化与其他区域有异同, 相较于降水, 气温增暖趋势更为显著, 与西北地区的增温速率0.2~0.9 ℃·(10a)-1(王鹏祥等, 2007)和黑河流域的平均气温变化较为一致(刘浏等, 2017), 高于河西走廊均温升温速率0.27 ℃·(10a)-1(孟秀敬等, 2012)。
3.1.2 气温和降水量的年代际变化
据表2 可知, 祁连山北麓及附近地区气温在1965 -1989年为负距平, 1965 -1969年、 1970 -1979年和1980 -1989年的距平值分别为-0.46 ℃、 -0.47 ℃、 -0.26 ℃, 1990 -2018年为正距平, 值分别为0.34 ℃、 0.84 ℃和1.24 ℃; 降水量在1965 -1969年和1980 -1989年为负距平, 1970 -1979年、 1990 -2018年为正距平。综上, 20世纪60年代, 祁连山北麓及附近地区气温偏低, 降水量偏少, 偏冷、 偏干的区域性气候波动较为明显, 70年代气温偏低, 这种波动变现为降水量的持续性增加, 进入80年代, 气温和降水虽然呈负距平, 但是幅度在减小, 到90年代, 气温和降水呈正距平, 并在21世纪以来的近20年里, 气温和降水的累计距平值明显增大。
表2 祁连山北麓及其附近地区气温和降水量的年代际距平Table 2 Decadal anomaly of the temperature and precipitation in northern parts of Qilian Mountains and the nearby regions |
| 物理量 | 1965 -1969年 | 1970 -1979年 | 1980 -1989年 | 1990 -1999年 | 2000 -2009年 | 2010 -2018年 |
|---|---|---|---|---|---|---|
| 气温距平/℃ | -0.46 | -0.47 | -0.26 | 0.34 | 0.84 | 1.24 |
| 降水距平/mm | -10.52 | 6.6 | -4.09 | 0.05 | 7.96 | 9.76 |
3.1.3 气温和降水量的季节变化
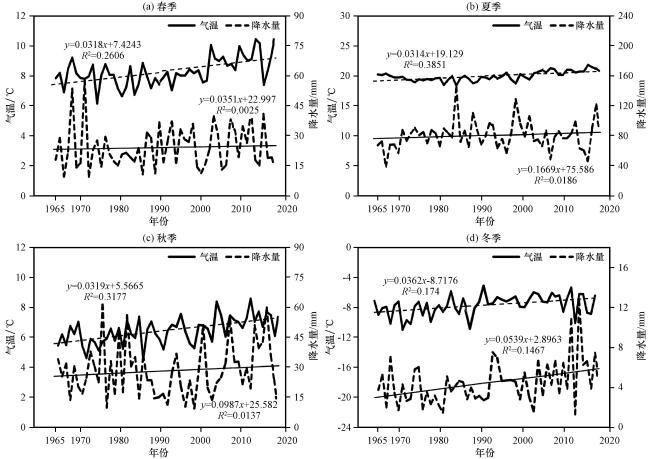
本区气温和降水的季节性变化速率也呈现出上升态势, 尤以冬季更甚, 冬季气温和降水的均值、 高值、 低值的上升速率分别0.36 ℃·(10a)-1、 0.73 ℃·(10a)-1、 0.03 ℃·(10a)-1和1.68 mm·(10a)-1、 1.36 mm·(10a)-1、 0.02 mm·(10a)-1, 说明相对较为寒冷的冬季对全球气候变暖的响应更为敏感, 同时证明了全球变暖下冬季气温升高最快的观点; 这与天山山区冬季平均气温和降水的上升趋势明显高于其他季节一致(袁玉江等, 2004), 而与祁连山相近的其他地区则出现春季气温倾向率异常高于其他季节(李宗省等, 2010)。
3.2 气温和降水量的空间格局
3.2.1 气温和降水量的空间叠加分析
由气温和降水的倾向率分布(图4 )可以看出, 近54年来祁连山北麓及其附近地区气温呈上升趋势, 12个站中有4个站(山丹、 武威、 民勤、 张掖)增温趋势显著, 平均增温幅度是0.33 ℃·(10a)-1。气温上升幅度较大的地区为石羊河水系中部、 北部大部分地区与黑河水系东南部, 增温幅度最大值[0.44 ℃·(10a)-1]位于河西地区山丹; 增温幅度最小的地区为疏勒河水系靠南部山区, 其中乌鞘岭为气温变化幅度最小的地区[0.21 ℃·(10a)-1]。以张掖和高台地区邻界为界线可以将气温分布分为两大区域, 界线以东为普遍增温趋势迅速, 以张掖和武威为增温中心; 界线以西为慢速增温趋势, 以酒泉和玉门镇为增温低值中心。年降水量普遍呈现增加趋势, 平均增加幅度为4.28 mm·(10a)-1。空间变化特征是增幅由东南向西北递减, 南部山区的增幅大于北部低海拔地区, 年降水量增加幅度最大的地区为乌鞘岭[16.98 mm·(10a)-1], 最小的地区马鬃山地区降水量呈递减趋势, 减少幅度为-4.30 mm·(10a)-1。
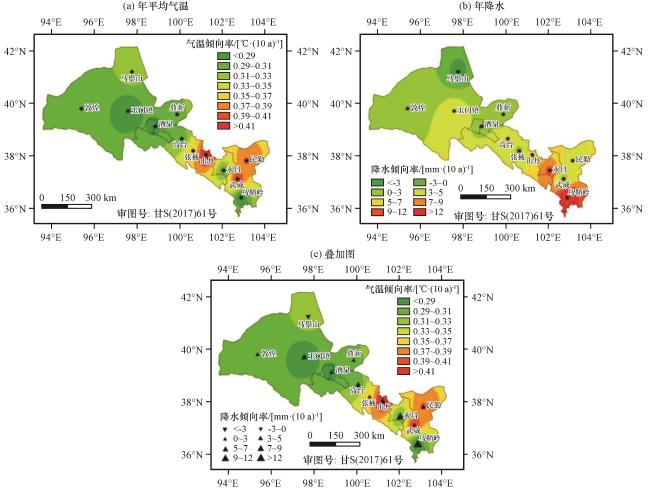
将二者叠加[图4 (c)], 总体可以观察到, 祁连山北麓及其附近地区呈现变暖变湿的趋势, 其速率由南向北, 由东向西递减。可以清晰看到, 以张掖与高台邻界处为分界线, 将其速率分为两大区域, 界线以东为普遍“快速暖湿”的趋势, 其中, 暖湿速率较高的地区是山丹、 民勤; 暖湿速率次高的地区是张掖、 武威。但是, 乌鞘岭地区增温幅度较小, 而降水增加幅度最大, 为16.98 mm·(10a)-1, 由此可见, 乌鞘岭地区是“冷湿”的趋势; 分界线以西是暖湿速率较平稳和较慢的地区, 在这一区域, 玉门镇、 酒泉增温幅度较小, 降水增加幅度较大, 可见是缓慢变暖变湿的趋势, 以玉门镇和酒泉为中心, 四周暖湿速率逐渐增大, 但是以缓慢而平稳的速度在增湿; 马鬃山气温呈现增加趋势, 降水却是减少的趋势, 那么, 马鬃山是“暖干”趋势。
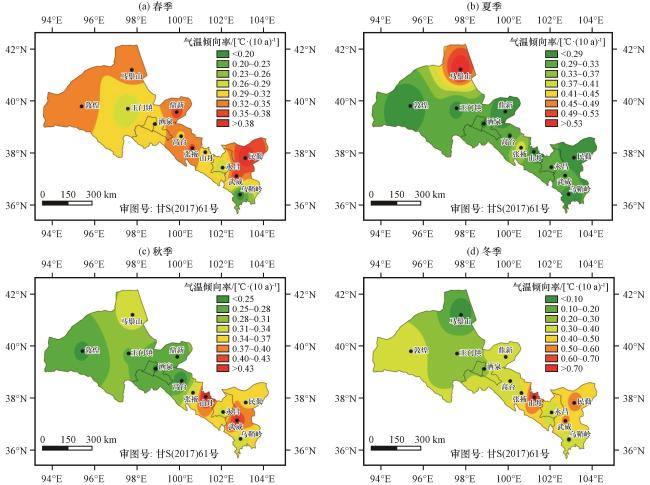
3.2.2 空间尺度上气温的季节性变化
从空间尺度上来看, 祁连山北麓及其附近地区四季气温增加率均呈上升的变化趋势, 其对应的平均增温幅度分别为0.32 ℃·(10a)-1、 0.31 ℃·(10a)-1、 0.32 ℃·(10a)-1和0.36 ℃·(10a)-1。增温率空间分布在不同的季节具有不同的分布特点(图5 ), 在春季, 增温率自东南向西北递减, 气温增幅较大的为石羊河水系, 增幅最大值出现在民勤[0.41 ℃·(10a)-1]; 增幅较小的地区为疏勒河水系中部和南部山区, 增幅最小值出现在永昌[0.27 ℃·(10a)-1]。在夏季, 增温率随海拔升高而递减, 增温幅度较大的地区为疏勒河水系北部与黑河水系中部, 增幅最大值出现在马鬃山[0.59 ℃·(10a)-1]; 增温幅度较小的地区为石羊河水系与疏勒河水系南部, 增幅最小值出现在鼎新[0.25 ℃·(10a)-1]。在秋季, 增温率以高台、 张掖为临界线划分为两个区域, 临界线以西除马鬃山外增温幅度均小于0.3 ℃·(10a)-1, 临界线以东增温幅度均大于0.3 ℃·(10a)-1。在冬季, 增温率从高纬度地区向低纬度逐渐增大, 增温幅度最大的地区在黑河水系与石羊河水系相临界处, 增温最大值出现在山丹[0.73 ℃·(10a)-1]; 增幅较小的地区为疏勒河水系, 增幅最小值出现在马鬃山[0.03 ℃·(10a)-1]。
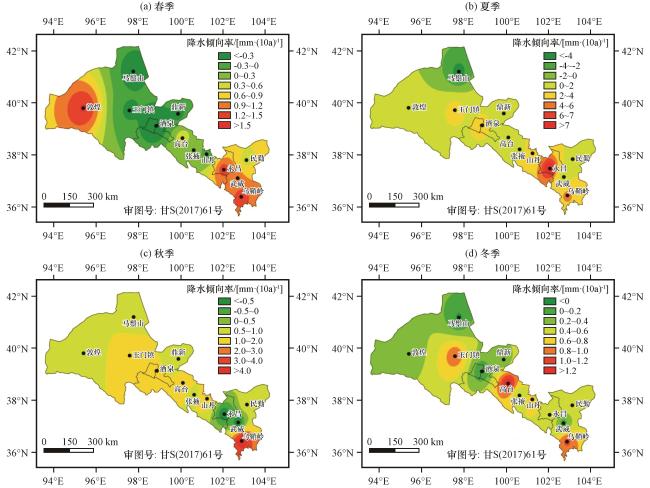
3.2.3 空间尺度上降水量的季节性变化
祁连山北麓及其附近地区四季降水量增加幅度均呈上升的变化趋势, 其对应的平均增加幅度分别为0.35 mm·(10a)-1、 0.51 mm·(10a)-1、 0.99 mm·(10a)-1和1.68 mm·(10a)-1。降水量增加幅度的空间分布在不同的季节具有不同的分布特点(图6 ), 在春季, 降水量增加幅度较大的地区是疏勒河水系西部, 增幅最大的地区是敦煌[1.52 mm·(10a)-1]; 黑河水系降水量呈减少趋势, 平均减少幅度为 -0.19 mm·(10a)-1, 减少最大值出现在酒泉[-0.69 mm·(10a)-1]。在夏季, 降水量增加幅度最大的地区为石羊河水系, 增幅最大地区为永昌[7.10 mm·(10a)-1]; 增幅最小的地区是疏勒河水系, 其中马鬃山降水量呈减少趋势, 平均减少幅度为 -4.55 mm·(10a)-1。在秋季, 降水量呈减少趋势的地区为石羊河上游地区的武威[-0.93 mm·(10a)-1]、 永昌[-0.89 mm·(10a)-1]; 黑河水系与石羊河水系东南部地区降水量增加幅度较大, 增幅最大的地区是乌鞘岭[4.69 mm·(10a)-1]。在冬季, 降水量增加幅度较大的地区为黑河水系中部、 石羊河水系东南部以及疏勒河水系东部。增幅最大的地区是高台[1.36 mm·(10a)-1]; 冬季降水量增加幅度较小的地区是疏勒河水系[0.02 mm·(10a)-1]。
3.3 气温和降水量的Mann-Kendall检验
用Mann-Kendall法对祁连山北麓及其附近地区1965 -2018年的年均气温和年降水进行突变检验分析(图7 )发现, 气候突变较为明显[图7 (a)], 曲线在1975年前呈现波动下降的趋势, 之后呈现波动上升趋势, 曲线在置信区间(图7 中两条横线区间)内与 曲线存在一个交点, 由此判断研究区年均气温在1998年发生了突变, 即: 年均气温发生了由低温到高温的突变。由年降水的Mann-Kendall突变分析[图7 (b)]可以看出, 曲线在置信区间内与 曲线交点较多, 主要集中在1970 -1998年, 年降水量有轻微突变, 但突变幅度并不是很明显。
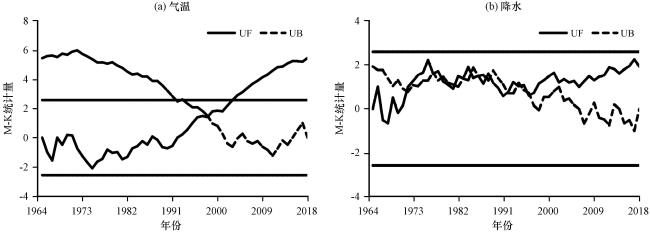
通过非参数Mann-Kendall法进行突变检验分析, 得出多年平均气温突变年份为1998年, 这与贾文雄等(2008)研究的祁连山季节气温突变时间(1997年)较为相近, 气温检验曲线在2005 -2018年持续超过了临界线, 变暖趋势更加明显; 多年降水突变检验UF曲线在置信区间内与UB曲线交点较多, 主要集中在1970 -1998年, 明显看出年降水量突变幅度虽然大部分时段较为缓和, 但突变幅度在1994 -1997年较为明显, 与贾文雄等(2008)研究的祁连山地区降水突变时间自1994年突变增多的结果相符。
3.4 年均气温和年降水量的周期变化分析
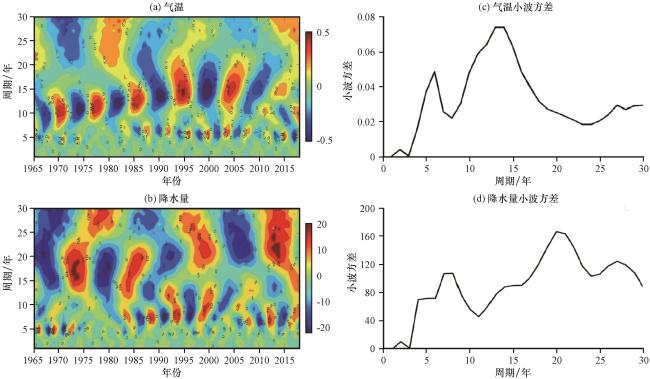
用Morlet小波分析对祁连山北麓及其附近地区年均气温和年降水量进行实部等值线和方差分析(图8 )发现, 年均气温的小波变换系数实部等值线在5~6年、 13~14年、 26~27年的时间尺度上表现较为密集, 且发生了小波系数高、 低值中心的变化。同时小波方差分析表明, 年均气温小波方差在6年、 13年和27年处存在极值[图8 (a)]。综上可以看出, 研究区年均气温存在6年、 13年和27年的变化周期, 其中13年周期是第一主周期, 且贯穿整个时间序列。年降水量的小波变换系数实部等值线在2~3年、 7~8年、 20~21年和27~28年的时间尺度上表现较为密集, 且亦发生了小波系数高、 低值中心的变化[图8 (b)]。其小波方差分析表明, 年降水量小波方差在2年、 8年、 20年和27年处存在极值。由此可推断祁连山北麓及其附近地区年降水量存在2年、 8年、 20年和27年尺度变化周期, 其中20年周期是第一主周期, 且贯穿整个时间序列。
根据小波分析的主周期变化趋势, 可为今后祁连山北麓及其附近地区的气候变化进行初步预测。在未来的几年内, 气温和降水量的变化将均处于高于常年的水平, 两大气候因子受第1主周期的影响, 将处于偏暖湿时期, 这种偏暖(湿)多雨期的气候变化状况将会持续至21世纪30年代末, 祁连山北麓及其附近地区气候变化趋势处于“暖干”向“暖湿”的过渡阶段, 且这种暖湿化受气候周期性变化的影响较大。
4 结论
基于祁连山北麓及其附近地区12个气象站点54年(1965 -2018年)的气温和降水的监测数据, 从时间和空间尺度上对当地的气温和降水变化格局进行了分析, 得到了如下结论:
(1) 祁连山北麓其附近地区多年平均气温升温速率为0.33 ℃·(10a)-1, 多年平均最高气温升温速率为0.44 ℃·(10a)-1、 多年平均最低温度升温速率为0.21 ℃·(10a)-1; 平均降水量为140.17 mm, 平均最大降水量201.58 mm, 平均最小降水量为81.2 mm, 降水的气候倾向率为3.55 mm·(10a)-1, 气温和降水均表现出上升趋势。气温和降水的季节性变化速率也呈现出上升态势, 尤以冬季更甚, 冬季气温和降水的均值、 高值、 低值的上升速率分别0.36 ℃·(10a)-1、 0.73 ℃·(10a)-1、 0.03 ℃·(10a)-1和1.68 mm·(10a)-1、 1.36 mm·(10a)-1、 0.02 mm·(10a)-1。
(2) 祁连山北麓及附近地区气温及降水的演化趋呈现出由东南向西北递减的走势, 气温上升幅度较大的地区为石羊河水系中部和北部大部分地区与黑河水系东南部; 降水南部山区的增幅大于北部低海拔地区。两者中间低值区走向为由东南向西北, 与祁连山系的走向一致, 形成了黑河流域的酒泉低值中心和石羊河流域的民勤高值中心。从演化趋势来看, 年均温和降水的东西差异显著, 东侧比西侧不论是气温还是降水其上升速率都比较快, 最高气温和降水东侧比西侧上升速率快, 总体形成了以张掖和高台为分界线, 以东呈“快速暖湿”的趋势、 以西呈“缓慢暖湿”的空间特征。
(3) 祁连山北麓及附近地区多年平均气温突变年份为1998年, 变暖趋势更加明显; 多年降水突变检验UF曲线在置信区间内与UB曲线交点较多, 主要集中在1970 -1998年, 年降水量突变幅度虽然大部分时段较为缓和, 但突变幅度在1994 -1997年较为明显。
(4) 祁连山北麓及附近地区年均气温在1965 -2018年的时间尺度上存在13年的强显著周期, 此外还有6年和27年的尺度变化周期。年降水量在54年的时间尺度上存在8年和20年的强显著周期, 此外还存在2年和27年的小尺度变化周期。