
1 引言
2 MWHS-2辐射率资料及前处理方法
2.1 MWHS-2辐射率资料
表1 MWHS-2各频率通道信息Table 1 MWHS-2 channel characteristics |
| 通道序号 | 中心频率/GHz | 星下分辨率/km | 极化方式 |
|---|---|---|---|
| 1 | 89 | 29 | V |
| 2 | 118.75±0.08 | 29 | H |
| 3 | 118.75±0.2 | 29 | H |
| 4 | 118.75±0.3 | 29 | H |
| 5 | 118.75±0.8 | 29 | H |
| 6 | 118.75±1.1 | 29 | H |
| 7 | 118.75±2.5 | 29 | H |
| 8 | 118.75±3.0 | 29 | H |
| 9 | 118.75±5.0 | 29 | H |
| 10 | 150 | 29 | V |
| 11 | 183.31±1 | 16 | H |
| 12 | 183.31±1.8 | 16 | H |
| 13 | 183.31±3 | 16 | H |
| 14 | 183.31±4.5 | 16 | H |
| 15 | 183.31±7 | 16 | H |
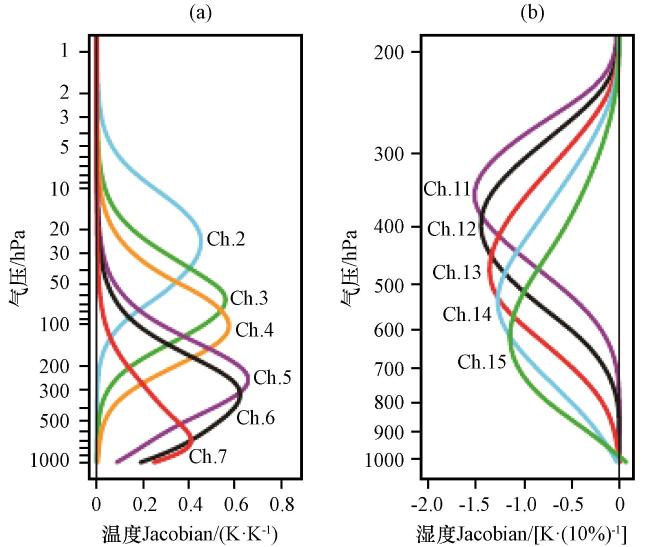
图1 标准大气条件下, MWHS-2晴空大气在118 GHz通道的温度Jacobian(a), 183 GHz通道的湿度Jacobian(b) [引自Lawrence et al (2018)]Fig.1 Clear-sky temperature Jacobians for the 118-Ghz channels (a) and clear-sky temperature Jacobians for the 183-Ghz channels (b) in the standard atmosphere[from Lawrence et al (2018)] |
2.2 质量控制
2.3 偏差订正
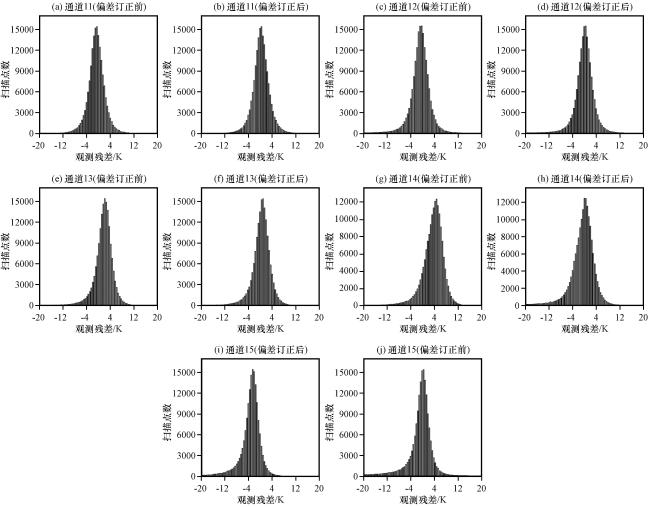
图4 2019年7月20 -31日MWHS-2通道11~15观测残差在偏差订正前、 后直方图Fig.4 The histogram of the observed versus RTTOV-calculated brightness temperature for channel 11~15 without and with bias correction, valid from 00:00 on 20 to 21:00 on 31 July 2019 |
表2 MWHS-2各通道偏差订正前、 后观测残差峰值对比Table 2 The comparison of OMB peak values before and after bias correction of MWHS-2 channels |
| 通道 | 通道11 | 通道12 | 通道13 | 通道14 | 通道15 |
|---|---|---|---|---|---|
| 偏差订正前/K | -0.96 | -1.70 | 1.25 | 3.34 | -3.49 |
| 偏差订正后/K | 0.08 | -0.24 | -0.27 | -0.74 | -0.89 |
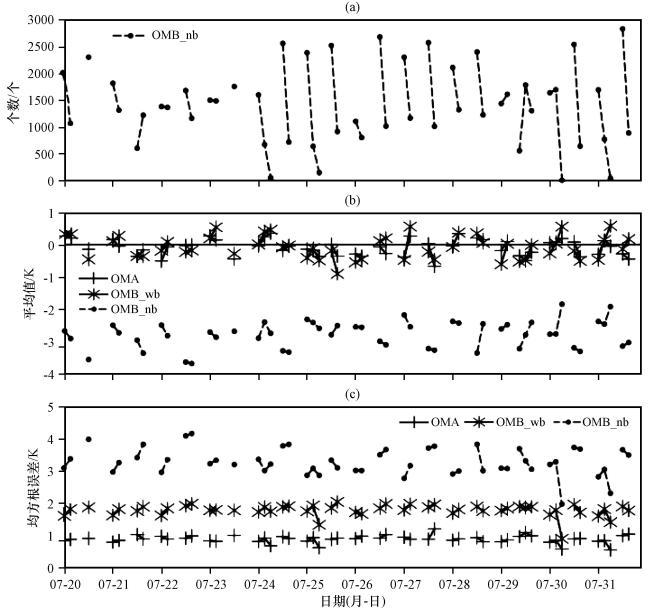
图5 2019年7月20 -31日MWHS-2通道15逐时次同化观测个数(a), 偏差订正前(OMB_nb)、 偏差订正后(OMB_wb)以及分析场(OMA)的观测残差平均值(b)与均方根误差(c)Fig.5 The number of observations(a), mean bias(b), and root mean square error (Rms)(c) of MWHS-2 channel 15 for OMB (OMB_nb) and with (OMB_wb)bias correction and OMA, valid from 00:00 on 20 to 21:00 on 31 July 2019 |
3 试验结果
3.1 试验设计
表3 RMAPS-ST系统配置Table 3 Model and configurations of RMAPS-ST |
| 参数 | 配置 |
|---|---|
| 模式版本 | WRFv3.8.1+ WRFDAv3.8.1 |
| 模拟区域 | D01(模式第1层嵌套区域): 649×500, 水平分辨率9 km |
| D02(模式第2层嵌套区域): 550×424, 水平分辨率3 km | |
| 垂直分层 | 50层, 层顶50 hPa |
| 物理参数化 方案 | 微物理方案: Thompson双参 |
| 边界层方案: ACM2 | |
| 长波辐射方案: RRTMG | |
| 短波辐射方案: RRTMG | |
| 陆面方案: NOAH | |
| 对流参数化方案: Kain-Fritsch(仅D01) |
表4 同化试验设计Table 4 The design of experiments |
| 试验名称 | 同化资料 |
|---|---|
| 控制试验(CTRL) | 常规地面、 探空、 飞机报, 加密自动气象站资料(以下简称常规观测资料) |
| 同化试验(DA_RAD) | 常规观测资料, FY3C MWHS-2资料 |
3.2 对预报要素的影响评估
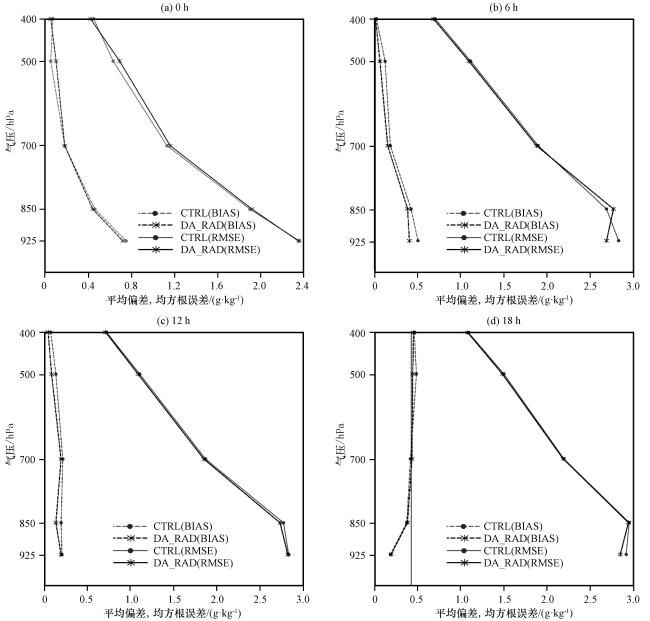
图6 控制试验与同化试验预报的比湿在预报时效的平均偏差及均方根误差的垂直分布Fig.6 The vertical profiles of average BIAS and RMSE for specific humidity for retrospective run forecasts from 20 to 31 July 2019 without (CTRL) and with (DA_RAD) satellite radiances |
表5 控制试验与同化试验预报的比湿在12 h预报时效的平均偏差及均方根误差对比Table 5 The comparison of average BIAS and RMSE for specific humidity in 12 hours for retrospective run forecasts without(CTRL) and with (DA_RAD) satellite radiances |
| 气压 /hPa | 平均偏差/(g·kg-1) | 均方根误差/(g·kg-1) | ||||
|---|---|---|---|---|---|---|
| 控制 试验 | 同化 试验 | 改进率 /% | 控制 试验 | 同化 试验 | 改进率 /% | |
| 400 | 0.10 | 0.08 | 20 | 0.72 | 0.71 | 1.3 |
| 500 | 0.12 | 0.08 | 33.3 | 1.10 | 1.08 | 1.8 |
| 700 | 0.22 | 0.19 | 13.6 | 1.86 | 1.83 | 1.6 |
| 850 | 0.19 | 0.14 | 26.3 | 2.76 | 2.71 | 1.8 |
| 925 | 0.19 | 0.18 | 5.2 | 2.82 | 2.80 | 0.7 |