

1 引言
2 资料来源和方法介绍
3 冰雹概率预报方法构建
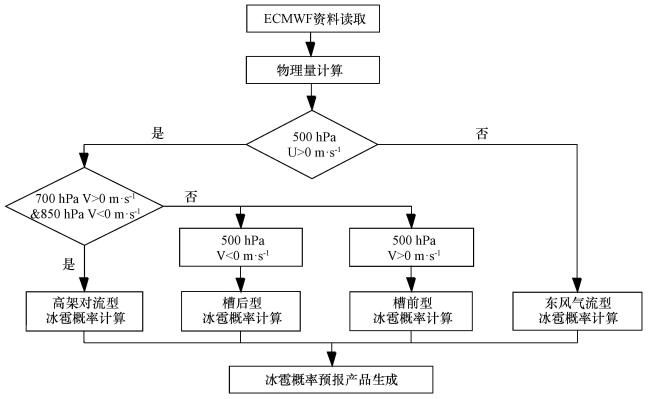
3.1 预报方案设计
3.2 连续概率方法建模
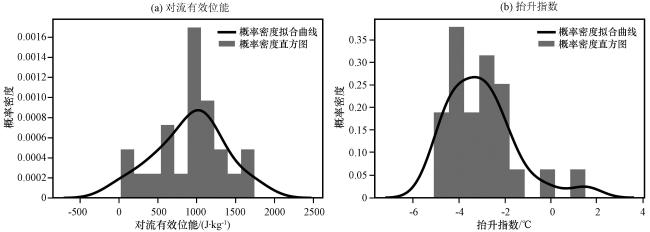
表1 各天气型预报参数及取值Table 1 Forecast parameters and values of various types of weather situation |
| 物理量 | 槽前型 | 槽后型 | 东风气流型 | ||
|---|---|---|---|---|---|
| 隶属函数 | a、 b取值 | 隶属函数 | a、 b取值 | 取值 | |
| 850 hPa Td/℃ | 升半岭 | 升半岭 | ≥16 | ||
| 925 hPa Td /℃ | 升半岭 | 升半岭 | ≥18 | ||
| 850 hPa T-Td/℃ | 降半岭 | 降半岭 | ≤4 | ||
| CAPE/(J·kg-1) | 升半岭 | 升半岭 | ≥1000 | ||
| 抬升指数/℃ | 降半岭 | 降半岭 | ≤-2 | ||
| 沙氏指数/℃ | 降半岭 | 降半岭 | ≤-2 | ||
| T 850-500/℃ | 升半岭 | 升半岭 | ≥26 | ||
| K指数/℃ | 升半岭 | - | - | ≥35 | |
| 地面3 h变压/hPa | 降半岭 | 降半岭 | ≤ -2.5 | ||
| 925 hPa散度/(×10-5 s-1) | 降半岭 | 降半岭 | <0 | ||
| 925 hPa水汽通量散度/(×10-7 g·hPa-1·cm-2·s-1) | 降半岭 | 降半岭 | <0 | ||
| 0~6k m垂直风切变/(m·s-1) | 升半岭 | 升半岭 | ≥12 | ||
| 0 ℃高度/(×103 m) | 降半岭 | 降半岭 | ≤4 | ||
| -20 ℃高度/(×103 m) | 降半岭 | 降半岭 | ≤8 | ||
| 500 hPa全风速/(m·s-1) | - | - | 升半岭 | - | |
-表示无数据 |
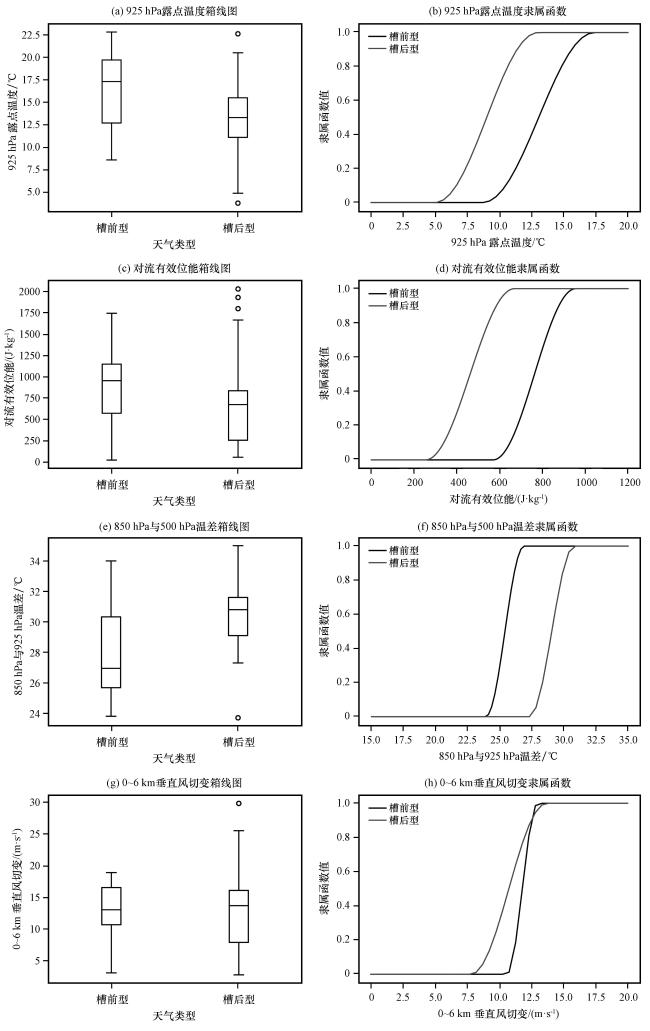
3.3 各天气型预报参数
4 冰雹概率预报产品个例检验
4.1 2019年4月8日槽前型
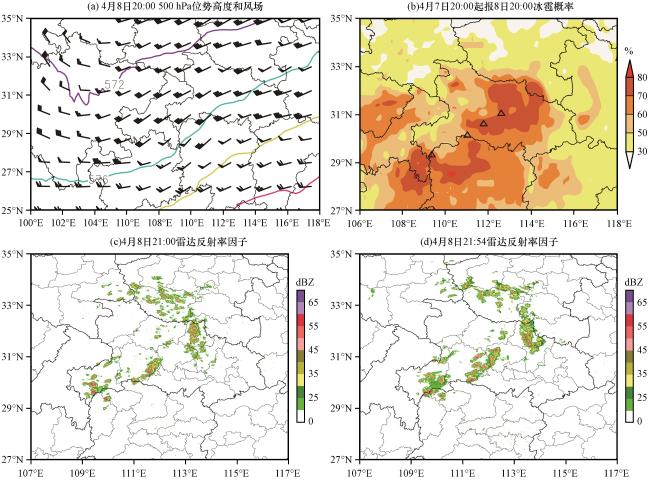
图4 2019年4月8日个例检验(a)中实线为位势高度等值线(单位: dagpm), 风羽为风场(单位: m·s-1); (b)中色斑为冰雹概率(单位: %), 三角形为4月8日20:00 -23:00冰雹实况 Fig.4 The evaluation of example on 8 April 2019.In Fig.4(a), the solid line is the contour of geopotential height (unit: dagpm), the wind plume is the wind field (unit: m·s-1), and in (b), the color spot is the hail probability (unit: %), and the triangle is the actual hail situation from 20:00 to 23:00 on 8 April 2019 |
4.2 2020年3月21日槽前型
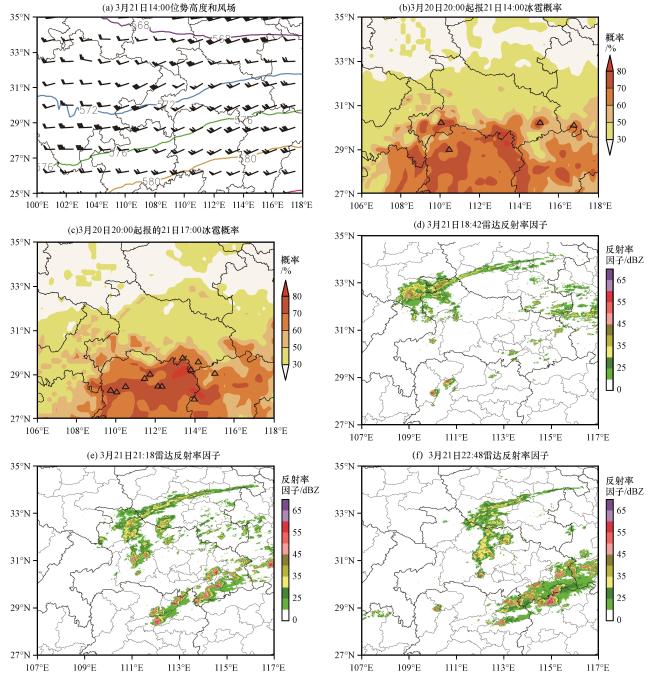
图5 2020年3月21日个例检验(a)中实线为位势高度等值线(单位: dagpm), 风羽为风场(单位: m·s-1); (b)、 (c)中色斑为冰雹概率(单位: %), 三角形分别为3月21日13:00 -17:00和17:00 -23:00冰雹实况 Fig.5 The evaluation of example on 21 March 2020.In Fig.5(a), the solid line is the contour of geopotential height (unit: dagpm), the wind plume is the wind field (unit: m·s-1).The color spots in Fig.5(b) and (c) are the hail probability (unit: %), and the triangles are the actual hail situation from 13:00 to 17:00 and from 17:00 to 23:00 on 21 March 2020, respectively |
4.3 2019年6月3日槽后型
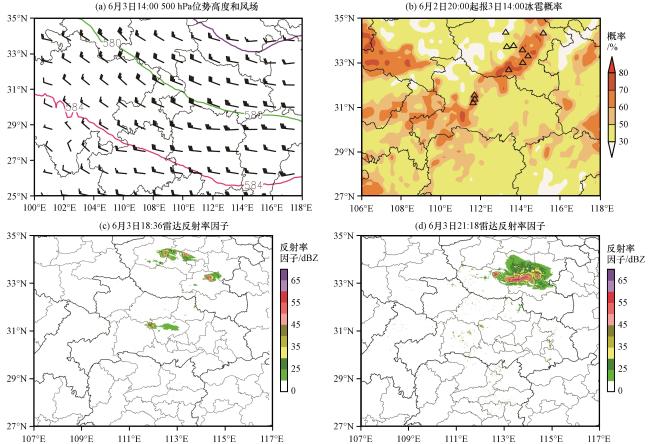
图6 2019年6月3日个例检验(a)中实线为位势高度等值线(单位: dagpm), 风羽为风场(单位: m·s-1); (b)中色斑为冰雹概率(单位: %), 三角形为6月3日18:00 -22:00冰雹实况 Fig.6 The evaluation of example on 3 June 2019.In Fig.6(a), the solid line is the contour of geopotential height (unit: dagpm), the wind plume is the wind field (unit: m · s-1), and in Fig.6(b), the color spot is the hail probability (unit: %), and the triangle is the actual hail situation from 18:00 to 22:00 on 3 June 2019 |
4.4 2017年7月11日东风气流型
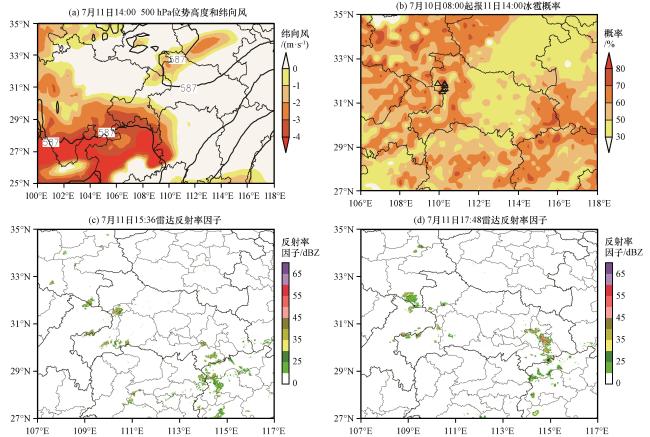


图7 2017年7月11日个例检验(a)中实线为位势高度等值线(单位: dagpm), 色斑为纬向风(单位: m·s-1); (b)中色斑为冰雹概率(单位: %), 三角形为7月11日14:00 -17:00冰雹实况 Fig.7 The evaluation of example on 11 July 2017.In Fig.7(a), the solid line is the contour of geopotential height (unit: dagpm), the color spot is zonal wind (unit: m · s-1), and in Fig.7(b), the color spot is the hail probability (unit: %), and the triangle is the actual hail situation from 14:00 to 17:00 on 11 July 2017 |