

1 引言
2 资料来源与方法介绍
2.1 使用资料
2.2 研究方法
表1 极端降雪指数相关要素Table 1 Factors related to extreme snowfall index |
| 指数 | 名称 | 定义 | 单位 |
|---|---|---|---|
| R90p | 强降雪总量 | 冬季RR≥全部RR的90%分位点的累积降雪总量 | mm |
| R6 | 大雪日数 | 冬季RR≥6.0 mm的累积降雪日数 | d |
| R90d | 强降雪日数 | 冬季RR≥全部RR的90%分位点的累积降雪日数 | d |
| Rx1 | 最大一日降雪量 | 冬季最大的日降雪量 | mm |
2.3 数值模拟
3 结果与讨论
3.1 中亚地区极端降雪的时空演变特征
3.1.1 中亚地区极端降雪的空间分布特征
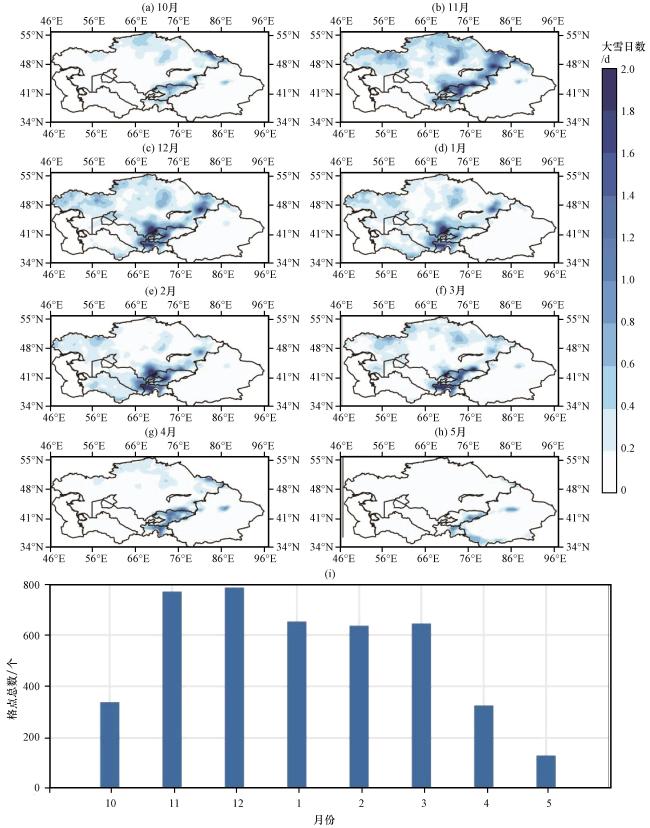
图1 1979 -2017年中亚地区10月至次年5月大雪日数均值的空间分布(a~h, 单位: d)和发生大雪格点总数的时间序列(i)Fig.1 Spatial distribution of the average monthly heavy snow days (a~h, unit: d) and time series of the total number of grid points with heavy snow (i) from October to May of the following year from 1979 to 2017 in Central Asia |
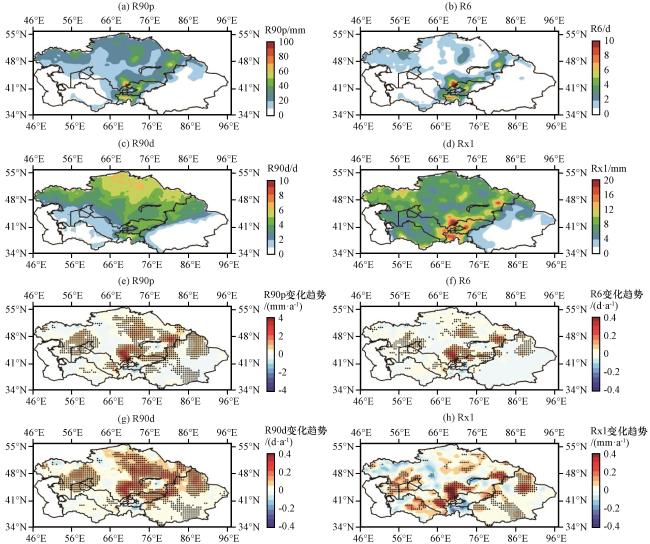
图2 中亚地区冬季极端降雪指数的均值(a~d)和1982 -2017年变化趋势(e~h)的空间分布打点区域表示通过0.05显著性水平检验 Fig.2 Spatial distribution of the average (a~d)and the variation trend from 1982 to 2017 (e~h)of the extreme snowfall indices during winter in Central Asia.The dotted area means that it passes the 0.05 significance level test |
3.1.2 中亚地区不同气候区冬季降雪及极端降雪指数变化特征
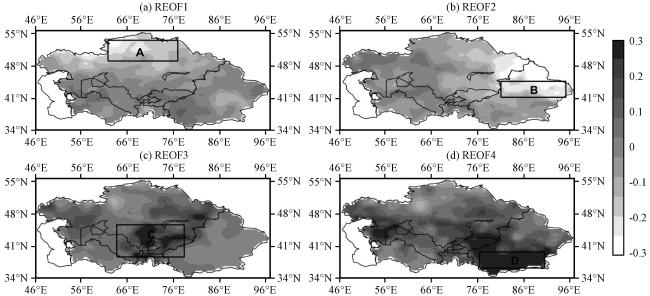
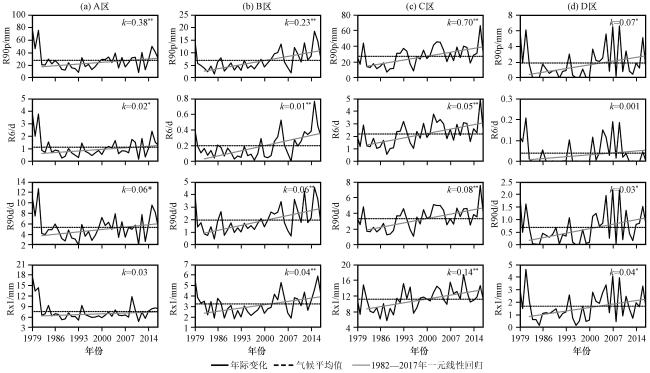
图4 1979 -2017年中亚地区冬季各气候区极端降雪指数年际变化*表示趋势率通过0.05显著性水平检验, **表示趋势率通过0.01显著性水平检验 Fig.4 Inter-annual change of the extreme snowfall indices in the climate subregions of Central Asia during winter from 1979 to 2017.* means the trend rate passing the 0.05 significance level test, ** means the trend rate passing the 0.01 significance level test |
3.2 极端降雪的大气环流特征
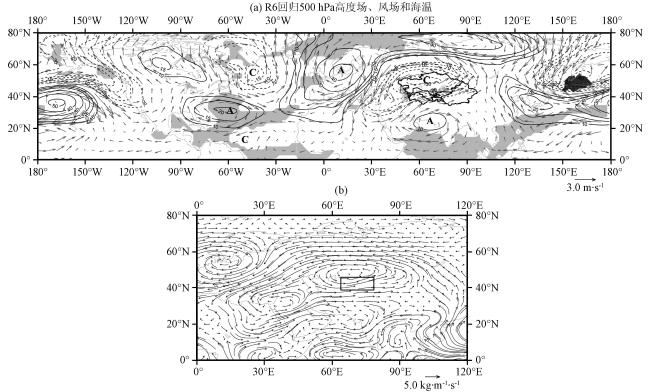
图5 12月南部关键区R6回归的500 hPa高度场(等值线, 单位: dagpm)、 风场(矢量, 单位: m·s-1)和海温(阴影, 单位: ℃)的回归系数(a)以及整层积分水汽输送通量(b, 矢量, 单位: kg·m-1·s-1)(a)中浅(深)色阴影表示正(负)回归系数通过0.05显著性水平检验, “A”和“C”分别代表反气旋和气旋中心, 黑色加粗实线为中亚区域; (b)中黑色方框为南部关键区 Fig.5 The regression coefficients of 500 hPa geopotential height field (contour, unit: dagpm), wind field (vector, unit: m·s-1) and sea surface temperature (the shaded) (a), and integral water vapor transport flux of the whole layer(b, vector, unit: kg·m-1·s-1) against R6 for December in the key southern subregion.Light (dark) shading in (a) means that the positive (negative) regression coefficient passes the 0.05 significance level test, the letters “A” and “C” indicate the centers of anticyclonic and cyclonic anomalies, respectively, and the black bold solid line represents the Central Asia; the black box in (b) is the key southern subregion |
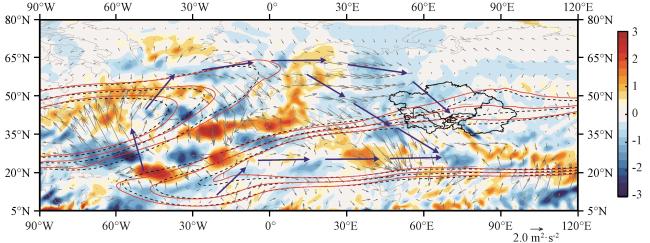
图6 12月南部关键区R6回归的200 hPa波作用通量(矢量, 单位: m2·s-2)与波通量散度(彩色区, 单位: m·s-2)分布黑色虚线为气候态西风急流, 红色实线为回归的西风急流, 蓝色箭头表示水平波作用通量传播方向 Fig.6 Regression of the wave activity fluxes (vector, unit: m2·s-2) and their divergence (color area, unit: m· s-2) at 200 hPa against R6 for December in the key southern subregion.The dotted black line is climatic westerly jet, the solid red line represents the regression of the westerly jet against R6, the blue arrow indicates the direction of the horizontal wave activity fluxes |
3.3 与北大西洋海温的关系
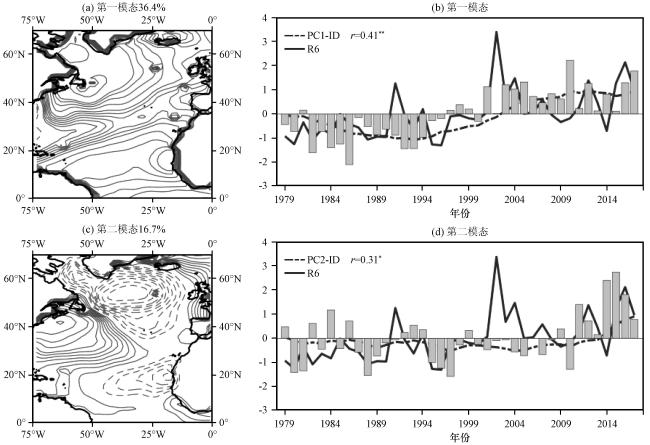
图7 北大西洋12月海表温度EOF第一(a, b)、 第二(c, d)模态空间分布(左)及其对应的标准化时间序列(右)左列实线数值大于0, 虚线数值小于0; 右列黑色虚线为10年滑动平均(PC1-ID, PC2-ID), 黑色实线为R6, 其中r为时间序列与R6的相关系数 Fig.7 The first (a, b) and second (c, d) EOF modes (left) and corresponding time seires (right)of the sea surface temperature over the North Atlantic for December.The solid line value of the left panel is greater than 0, and the dashed line value is less than 0; the black dashed lines indicate 10-year running means, the black solid lines are R6 in right panel, r is the correlation coefficient between time seires and R6 |
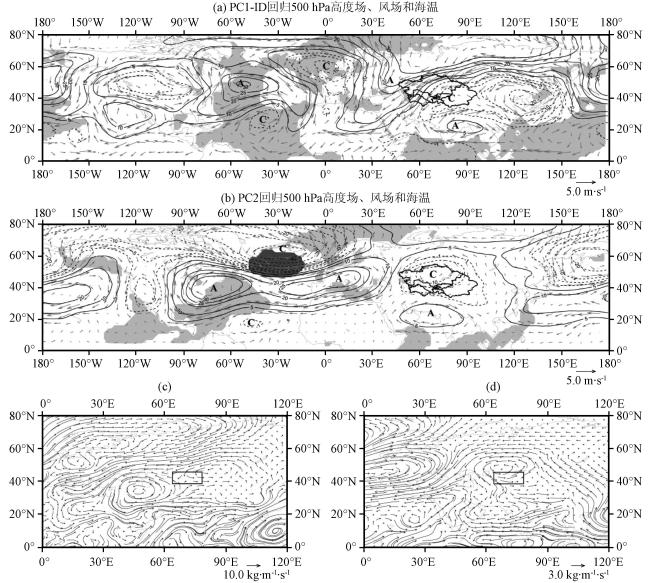
图8 12月北大西洋海温模态PC1-ID(a, c)和PC2(b, d)回归的500 hPa高度场(等值线, 单位: dagpm)、 风场(矢量, 单位: m·s-1)和海温(阴影, 单位: ℃)的回归系数(a, b)和整层积分水汽输送通量(c, d, 单位: kg·m-1·s-1)浅(深)色阴影表示正(负)回归系数通过0.05显著性水平检验, “A”和“C”分别代表反气旋和气旋中心, 黑色加粗实线为中亚区域; (c)和(d)中黑色方框为南部关键区 Fig.8 The regression coefficients of 500 hPa geopotential height field (contour, unit: dagpm), wind field (vector, unit: m·s-1) and sea surface temperature (the shaded)(a, b) and integral water vapor transport flux of the whole layer(c, d, unit: kg·m-1·s-1) against the PC1-ID (a, c) and PC2 (b, d) of the first two EOF modes of the sea surface temperature over the North Atlantic for December.Light (dark, unit: ℃) shading in (a) and (b)means that the positive (negative) regression coefficient passes the 0.05 significance level test, the letters “A” and “C” indicate the centers of anticyclonic and cyclonic anomalies, respectively, and the black bold solid line represents the Central Asia; the black box in (c) and (d) is the key southern subregion |
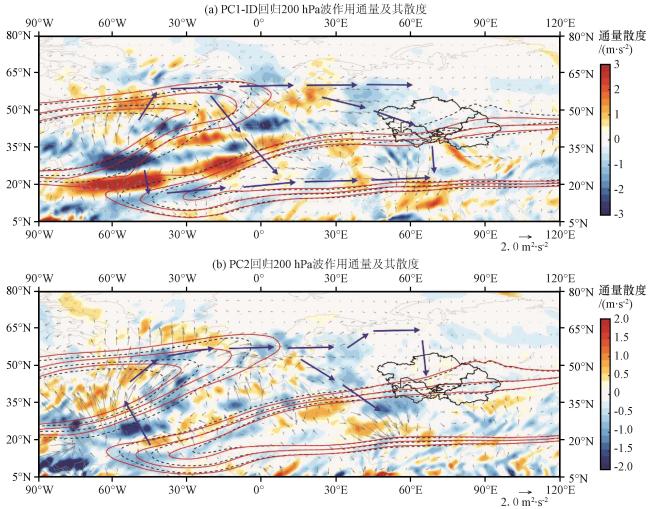
图9 12月北大西洋海温模态PC1-ID(a)和PC2(b)回归的200 hPa波作用通量(矢量, 单位: m2·s-2)与波通量散度(彩色区, 单位: m·s-2)分布黑色虚线为气候态急流, 红色实线为回归的急流, 蓝色箭头表示水平波作用通量传播方向 Fig.9 Regression of the wave activity flux(vector, unit: m2·s-2) and their divergence (color area, unit: m·s-2) at 200 hPa against the PC1-ID (a) and PC2 (b) of the first two EOF modes of the sea surface temperature over the North Atlantic for December.The dotted black line is climatic westerly jet, the solid red line represents the regression of the westerly jet against PC1-ID and PC2, the blue arrow indicates the direction of the horizontal wave activity fluxes |
3.4 数值模拟
3.4.1 数值试验方案
3.4.2 试验结果分析
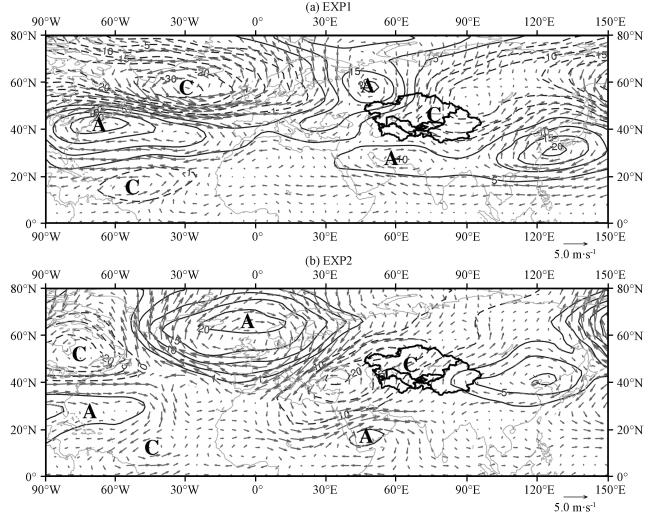
图10 敏感性试验1(a)和敏感性试验2(b)分别与控制试验的12月500 hPa高度差值场(等值线, 单位: dagpm)和风速差值场(矢量, 单位: m·s-1)“A”和“C”分别代表反气旋和气旋中心, 黑色加粗实线表示中亚区域 Fig.10 Differences of the geopotential height (contour, unit: dagpm) and wind field (vector, unit: m·s-1) at 500 hPa for December between the EXP1 (a), EXP2 (b) and CTRL.The letters “A” and “C” indicate the centers of anticyclonic and cyclonic anomalies, respectively, and the black bold solid line represents the Central Asia |
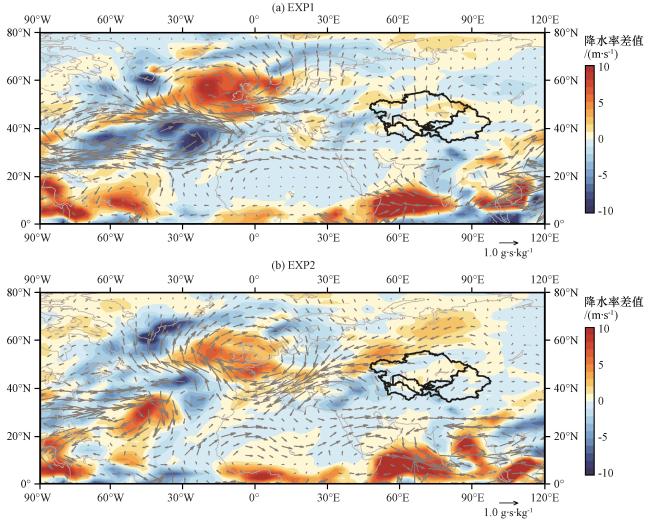
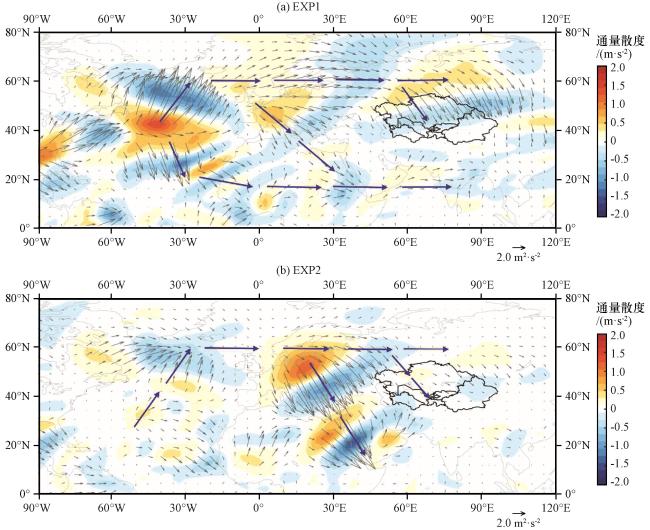


图12 敏感性试验1(a)和敏感性试验2(b)模拟的12月200 hPa水平波作用通量(矢量, 单位: m2·s-2)及其散度(彩色区, 单位: m·s-2)蓝色箭头表示水平波作用通量传播方向, 黑色加粗实线表示中亚区域 Fig.12 The wave activity flux (vector, unit: m2·s-2) and its divergence (color area, unit: m·s-2) at 200 hPa of the EXP1 (a) and EXP2 (b), the blue arrow indicates the direction of the horizontal wave activity fluxes, and the black bold solid line represents the Central Asia |