1 引言
2 资料来源
表1 scPDSI干湿等级分级标准表Table 1 Classification of the scPDSI values |
| scPDSI | 湿润等级 | scPDSI | 干旱等级 |
|---|---|---|---|
| ≥4.00 | 极端湿润 | -2~-1 | 轻微干旱 |
| 3.00~4.00 | 严重湿润 | -3~-2 | 中度干旱 |
| 2.00~3.00 | 中度湿润 | -4~-3 | 严重干旱 |
| 1.00~2.00 | 轻微 | ≤-4.00 | 极端干旱 |
| -1~1 | 正常 |
3 结果和分析
3.1 极端干旱个例分析
3.2 合成分析检验
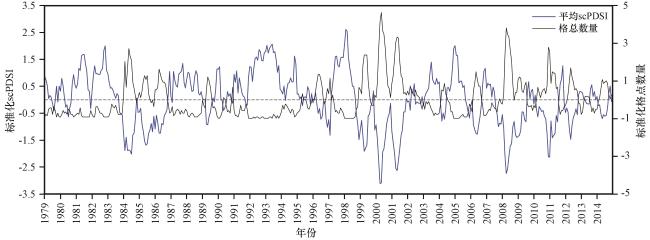
图4 1979 -2014年关键区内区域平均scPDSI标准化逐月序列(蓝线, 左轴)和严重及以上干旱(scPDSI<-3)格点的数量标准化序列(黑线, 右轴)Fig.4 The scPDSI standardization sequence areal averaged (blue line, left y-axis) and standardization number of severe and above drought grid points (black line, right y-axis) over the key area from 1979 to 2014 |
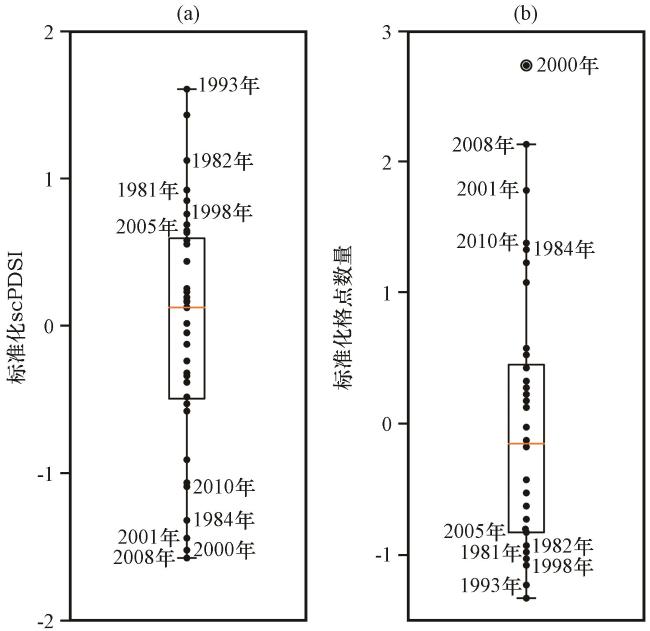
表2 中西亚主要国家干旱受灾年Table 2 Drought-suffered years in major countries of Central and West Asia |
| 国家 | 年份 |
|---|---|
| 吉尔吉斯斯坦 | 2009年 |
| 乌兹别克斯坦 | 2000 -2001年 |
| 塔吉克斯坦 | 2000 -2001年, 2008年 |
| 阿富汗 | 2000 -2002年, 2006年, 2008年, 2011年 |
| 巴基斯坦 | 1999 -2003年 |
| 叙利亚 | 1999 -2000年, 2008 -2010年 |
| 伊拉克 | 1998 -2001年 |
| 伊朗 | 1999 -2001年 |
| 约旦 | 1999年, 2000年 |
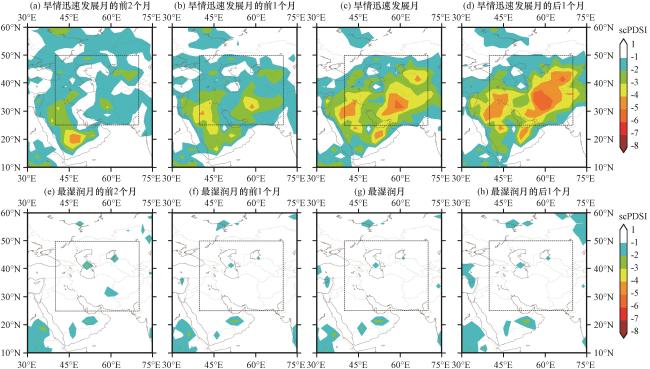
3.3 极端干旱地区的水汽分布特征
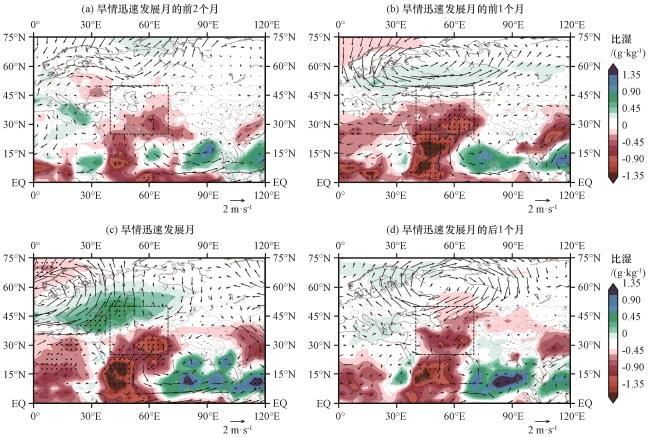
图7 极端干旱事件合成的850 hPa风场异常(矢量, 单位: m·s-1)和比湿异常场(彩色区, 单位: g·kg-1)分布黑色虚线框为研究区域, 黑点表示通过了0.05的显著性水平检验 Fig.7 850 hPa wind (vector, unit: m·s-1) and specific humidity (color area, unit: g·kg-1) anomaly for 4 months of composite extreme drought events.Black dots indicate that pass 0.05 levels significant tests.The black dotted line bound the key area |
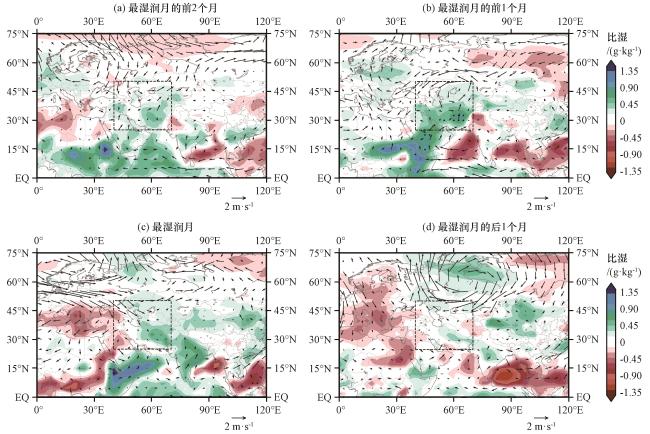
图8 湿润事件合成的850 hPa风场异常(矢量, 单位: m·s-1)和比湿异常场(彩色区, 单位: g·kg-1)分布黑色虚线框为研究区域, 黑点表示通过了0.05水平的显著性检验 Fig.8 850 hPa wind (vector, unit: m·s-1) and specific humidity (color area, unit: g·kg-1) anomaly for 4 months of composite wet events.Black dots indicate that pass 0.05 levels significant tests.The black dotted line bound the key area |
3.4 极端干旱形成的机理研究
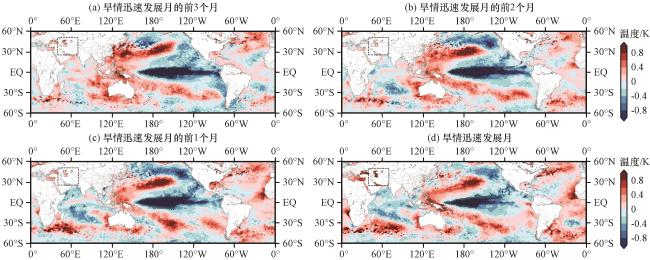
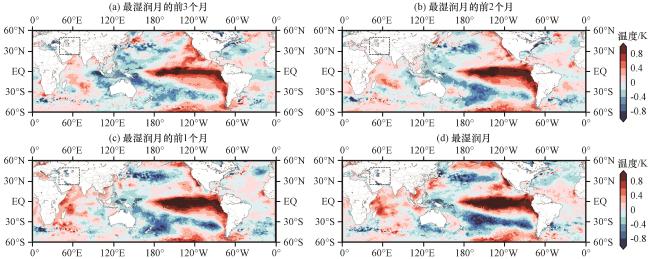
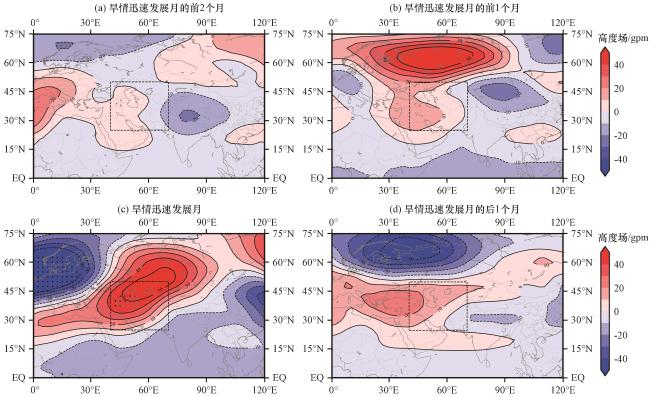
图11 极端干旱事件合成的500 hPa高度场异常空间分布(单位: gpm)黑点表示通过了0.05水平的显著性检验, 黑色虚线框内为旱情发展关键区 Fig.11 Spatial distribution of geopotential height anomaly at 500 hPa for 4 months of composite extreme drought events.Unit: gpm.Black dots indicate that pass 0.05 levels significant tests, the black dotted line bound the key area |
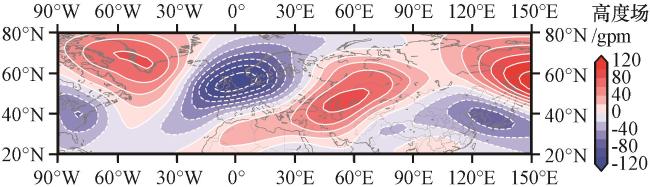
图12 极端干旱事件干旱最强月合成的300 hPa高度场异常空间分布 (单位: gpm)Fig.12 Spatial distribution of 300 hPa geopotential height field anomalies composited in the strongest month of extreme drought events.Unit: gpm |