

1 引言
2 研究区概况
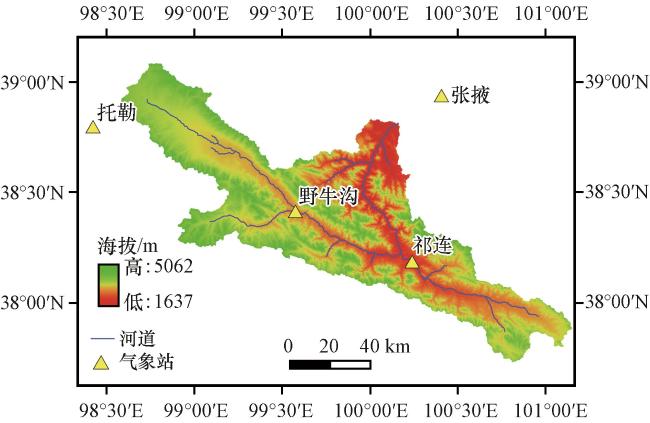
3 数据来源与研究方法
3.1 数据来源
表1 国家标准气象台站基本信息Table 1 Basic information of the selected national standard meteorological stations |
| 气象站点 | 纬度 | 经度 | 海拔/m | 时间跨度 |
|---|---|---|---|---|
| 野牛沟 | 38.40°N | 99.60°E | 3320.00 | 1959 -2018年 |
| 祁连 | 38.20°N | 100.30°E | 2787.40 | 1956 -2018年 |
| 托勒 | 38.80°N | 98.40°E | 3367.00 | 1956 -2018年 |
| 张掖 | 38.90°N | 100.40°E | 1482.70 | 1951 -2018年 |
表2 CMIP6中7个GCMs模式基本信息Table 2 Basic information of the selected 7 GCMs from CMIP6 |
| 模式名称 | 研发机构 | 格点数 | 分辨率 |
|---|---|---|---|
| ACCESS-CM2 | 澳大利亚联邦科学与工业研究组织 | 192×144 | 1.875°×1.250° |
| ACCESS-ESM1-5 | 澳大利亚联邦科学与工业研究组织 | 192×144 | 1.875°×1.250° |
| BCC-CSM2-MR | 北京国家气候中心 | 320×160 | 1.125°×1.125° |
| CNRM-CM6-1 | 法国国家气象研究中心 | 256×128 | 1.406°×1.406° |
| EC-Earth-Veg | 欧洲EC-Earth联盟 | 512×256 | 0.703°×0.703° |
| GFDL-ESM4 | 美国大气海洋局 | 288×120 | 1.250°×1.000° |
| MRI-ESM2-0 | 日本气象厅气象研究所 | 320×160 | 1.125°×1.125° |
表3 CMIP6情景比较计划-核心试验情景的基本信息Table 3 Basic information about core experiments in ScenarioMIP in CMIP6 |
| 情景 | SSPs | 强迫类型 | RCPs /(W·m-2) |
|---|---|---|---|
| SSP1-2.6 | SSP 1(可持续发展) | 低强迫 | 2.6 |
| SSP2-4.5 | SSP 2(中度发展) | 中等强迫 | 4.5 |
| SSP3-7.0 | SSP 3(局部发展) | 中等至高强迫 | 7.0 |
| SSP5-8.5 | SSP 5(常规发展) | 高强迫 | 8.5 |
3.2 研究方法
3.2.1 泰勒图
3.2.2 综合评级指标
3.2.3 Mann-Kendall趋势检验
3.2.4 MBC校正方法
4 结果与分析
4.1 历史情景降水/气温模拟能力评估
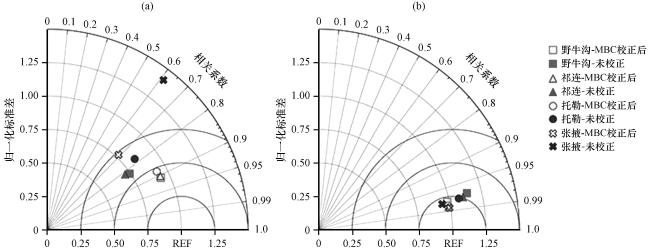
4.1.1 基于泰勒图的模拟能力评估
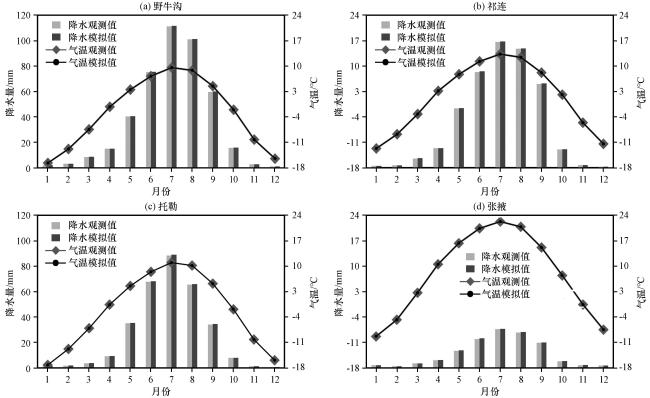
4.1.2 多年月平均降水/气温模拟评估
4.2 未来降水/气温变化趋势分析
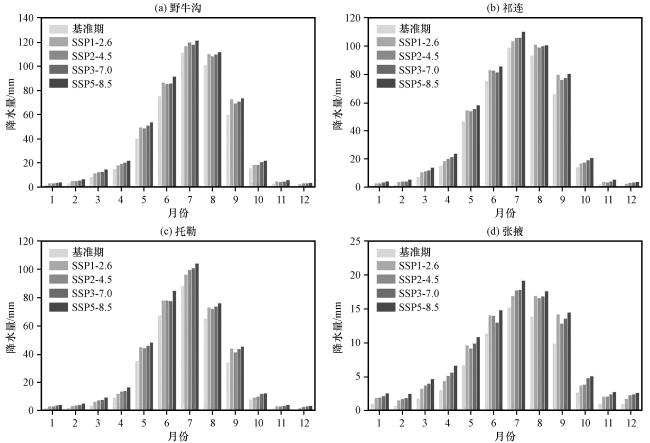
4.2.1 未来多年月平均降水/气温变化分析
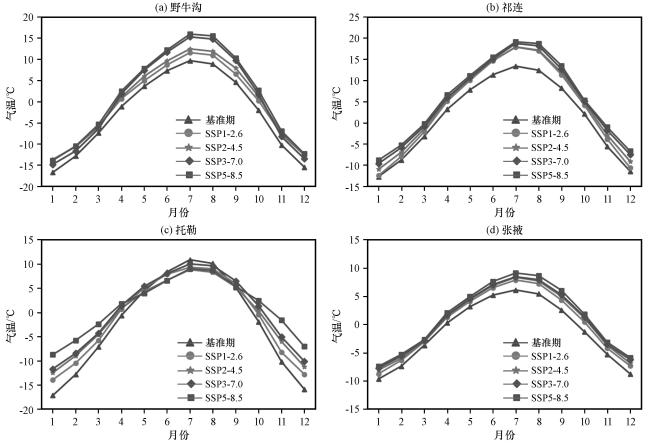
4.2.2 未来逐年降水/气温变化分析
表4 未来每10年降水和气温的变化Table 4 Future decadal changes in precipitation and temperature |
| 站点 名称 | 排放情景 | 降水变化 /[mm·(10a)-1] | 温度变化 /[℃·(10a)-1] |
|---|---|---|---|
| 野牛沟 | SSP1-2.6 | 7.60* | 0.10** |
| SSP2-4.5 | 14.76* | 0.41** | |
| SSP3-7.0 | 14.35* | 0.62** | |
| SSP5-8.5 | 20.56* | 0.78 | |
| 祁连 | SSP1-2.6 | 6.70* | 0.10** |
| SSP2-4.5 | 8.69* | 0.35** | |
| SSP3-7.0 | 4.35* | 0.53** | |
| SSP5-8.5 | 15.22* | 0.71** | |
| 托勒 | SSP1-2.6 | 7.10* | 0.15** |
| SSP2-4.5 | 10.79* | 0.33** | |
| SSP3-7.0 | 11.81* | 0.53** | |
| SSP5-8.5 | 9.75* | 0.74** | |
| 张掖 | SSP1-2.6 | 2.00* | 0.27** |
| SSP2-4.5 | 1.57* | 0.41** | |
| SSP3-7.0 | 4.62* | 0.62** | |
| SSP5-8.5 | 6.01* | 0.81** |
*和**分别表示通过了0.05和0.01的显著性水平检验 |
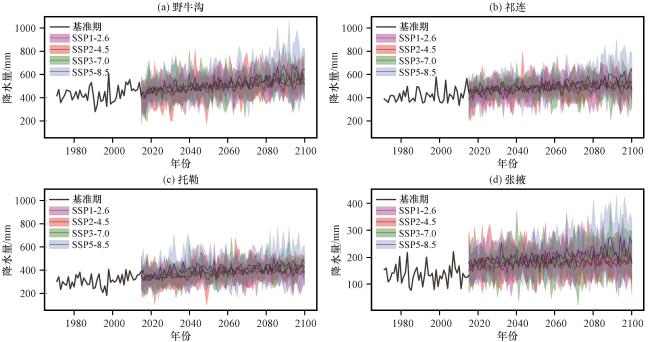
图6 1971 -2100年4个气象台站不同情景下年降水量变化实线为情景下多模式集合平均; 彩色阴影部分是各情景下年降水量最大最小值分布, 表征模式的不确定性 Fig.6 The variations of annual precipitation of four meteorological stations in different SSPs from 1971 to 2100.The solid line represented multimode ensemble average, the shaded parts represent the distribution (maximum and minimum) annual precipitation to indicate the uncertainty of the model under each scenario |
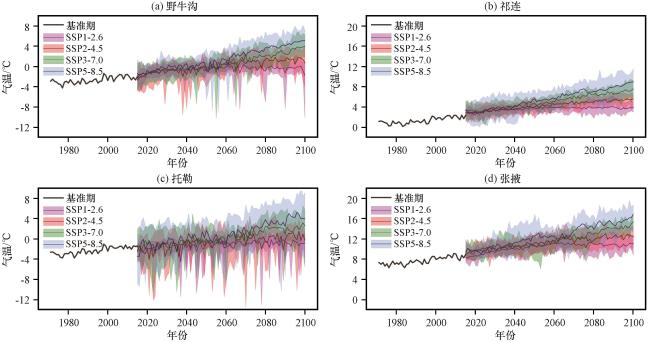
图7 1971 -2100年4个站点不同情景下的年平均气温变化实线为情景下多模式集合平均; 彩色阴影部分是各情景下年平均气温分布, 表征模式的不确定性 Fig.7 The variations of annual average temperature of four meteorological stations in different SSPs from 1971 to 2100.The solid line represented multimode ensemble average, the shaded parts represent the distribution (maximum and minimum) of annual average temperature to indicate the uncertainty of the model under each scenario |
4.2.3 未来不同时期降水/气温分析
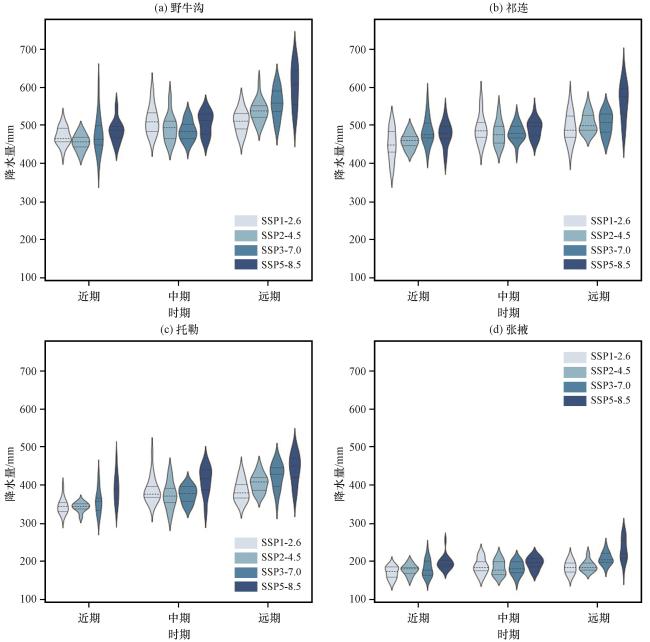
图8 未来不同时期4个站点年降水分布小提琴形状体现年降水量的分布特征, 宽度表示年降水量集中程度, 横线代表四分位数, 颜色由浅到深表示随辐射强迫增大的情景 Fig.8 The distribution of annual precipitation of four meteorological stations in future periods.The violin shape indicates the distribution characteristics of annual precipitation, the width represents the concentration degree of annual precipitation, the horizontal line shows the quartile, and the color from light to dark represents the scenario with increasing radiative forcing |
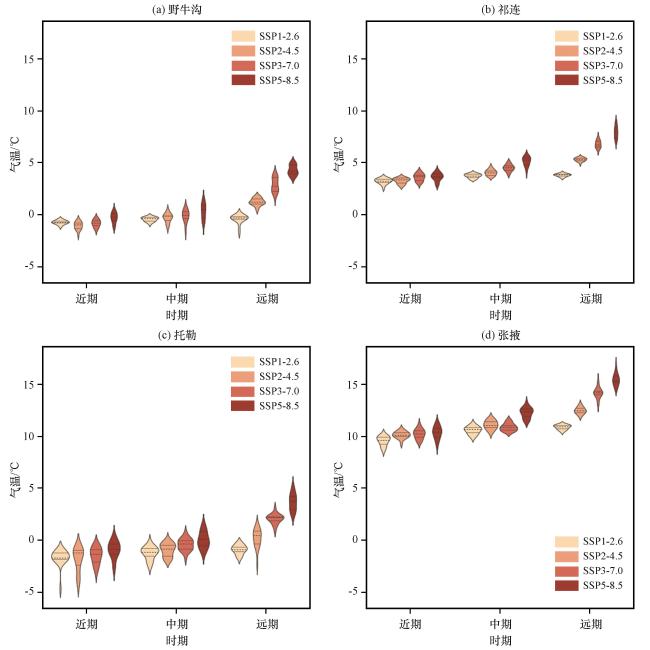


图9 未来不同时期4个站点年平均气温分布小提琴形状体现年平均气温的分布特征, 宽度反映年平均气温集中程度, 横线代表四分位数, 颜色由浅到深表示随辐射强迫增大的情景 Fig.9 The distribution of annual average temperature of four meteorological stations in future periods.The violin shape indicates the distribution characteristics of annual average temperature, the width represents the concentration degree of annual temperature, the horizontal line shows the quartile, and the color from light to dark represents the scenario with increasing radiative forcing |