

1 引言
植被气候生产潜力是指在假设其他因子均适宜的条件下, 由气候因子决定的单位时间、 单位面积上的作物生产力(周广胜和张新时, 1996)。联合国政府间气候变化专门委员会(IPCC)第六次研究报告强调了全球变暖水平稳定在1.5~2.0 ℃(IPCC, 2021)。近几年来全球气温升高趋势明显加快, 2015 -2019年全球气温升高了1.1 ℃, 是有记录以来最暖的5年(WMO, 2020)。在全球气候变化背景下, 通过对植被气候生产潜力的研究, 可以评估并预测某地区植被气候生产潜力的未来发展趋势, 对区域农林牧业的生产布局以及生态系统管理、 气候资源的充分利用和全球气候变化的应对均有重要的指导意义。
由世界气候研究计划(WCRP)耦合模拟工作组(WGCM)在1995年发起和组织的国际耦合模式比较计划(CMIP)已先后组织六次, 其对气候模拟性能的评估、 对当前气候变化的模拟以及未来气候变化的情景预估结果数次被IPCC气候评估报告引用(周天军等, 2014)。与依靠历史数据和规律来预测未来气候变化的方式不同的是, CMIP采用的是基于一系列内部逻辑一致的人为假设开发的未来发展情景(van Vuuren et al, 2012; Maier et al, 2016)。CMIP6模式采用的共享社会经济路径(Shared Socioeconomic Pathways, SSPs)能够反映辐射强迫和社会经济发展间的关联, 体现气候因素与社会经济因素间的综合作用, 满足了气候变化影响、 适应和减缓等不同研究领域的需求, 对于推动气候变化预估与影响研究、 支撑气候政策决策的作用逐渐凸显(曹丽格等, 2012; 翁宇威等, 2020)。
国内众多学者曾利用二元一次回归分析法、 小波分析以及R/S分析法等数学方法预测了大兴安岭(赵慧颖等, 2017)、 黑龙江(卢玢宇等, 2017)、 甘肃、 青海及新疆(张锐, 2011)等地未来植被气候生产潜力的变化趋势。由于气候固有的复杂性, 传统的预测方法精度较低, 基于耦合气候系统模式的预测方法相对更加科学精确。国内外学者已经有利用RCPs来预估不同情景下全球小麦产量(Juraj Balkovič et al, 2014)、 长江中下游稻麦气候生产潜力(刘文茹, 2017)以及中国2021 -2099年气候生产潜力的变化情况(徐雨晴等, 2019)。CMIP6模式在一带一路地区(Lü et al, 2021)、 中国全境(Yang et al, 2021)和国内部分流域(赵梦霞等, 2021; 张建梅, 2020; 詹明月等, 2020)的气候模拟能力表现较好, 其模拟能力得到了众多学者的验证。
陕西、 甘肃以及宁夏三省区地理位置特殊, 处于我国季风区与非季风区的过渡地带, 生态环境脆弱, 河西走廊、 宁夏平原等地是我国西北地区重要的商品粮生产基地, 人口经济的发展与生态保护之间矛盾突出。此外, 有研究表明我国西北地区气候逐渐向暖湿方向发展(王亚俊, 2003; 秦大河, 2002), 在气候变化背景下, 对陕甘宁三省区植被气候生产潜力的预测为处理好经济发展与生态保护之间的关系, 合理调整农林牧业的生产布局, 真正做到“绿水青山就是金山银山”提供了有效的科学依据。目前, 对于陕甘宁三省区植被气候生产潜力的研究多数以历史气象数据为依据研究近几十年来植被气候生产潜力的变化趋势, 对未来植被气候生产潜力的研究仅限于借用历史气象数据建立函数关系而进行预测, 缺少对植被气候生产潜力驱动因素的深入探讨(张娟等, 2020; 董思等, 2016; 罗永忠等, 2011)。本文选取陕甘宁三省区共享社会经济路径(SSPs)下的SSP126、 SSP245和SSP585三种路径2025 -2100年温度和降水的模拟数据, 运用Thornthwaite Memorial模型计算陕甘宁三省区未来植被气候生产潜力的空间分布特征, 并深入探讨气候变化与植被气候生产潜力的驱动机制, 以期对区域生态环境建设与社会经济可持续发展提供科学依据。
2 数据来源与方法介绍
2.1 研究区概况
陕西省、 甘肃省以及宁夏回族自治区(以下简称陕甘宁三省区)位于中国西北地区, 地处黄河中上游, 介于31°42′N -42°57′N, 92°13′E -111°15′E之间(图1 ), 三省区总面积约6.98×10⁵ km2。该地区境内黄土高原、 青藏高原、 内蒙古高原交汇, 地形复杂多样, 山脉纵横交错。该地横跨多个气候区, 陇南及陕南地区属亚热带季风气候, 向北依次为温带季风气候和温带大陆性气候, 甘肃省部分地区还分布有高原山地气候, 全境夏季降水集中, 南北气温和降水差异大。受气候地形等因素影响, 该地生态环境脆弱, 植被类型多样, 从常绿阔叶林到荒漠草原, 干湿地带性分异规律显著。
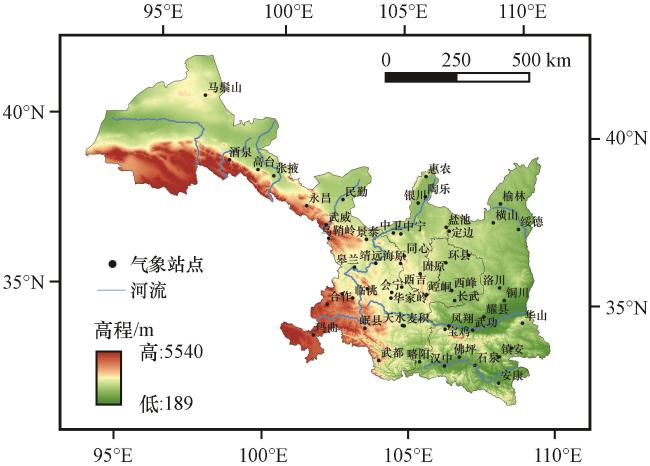
文中涉及的地图是基于中华人民共和国自然资源部地图技术审查中心标准地图服务系统下载的审图号为GS(2019)1711号的中国地图制作, 底图无修改。
2.2 数据来源
2.2.1 历史气象数据
本文选取陕甘宁三省区1960 -2019年地面气象站点的月平均气温和降水资料作为基准期, 各站点中去除数据缺失过多的泾河气象站点, 最后得到55个站点的气象数据(图1 )。对部分站点个别月份资料缺失的, 将采用临近两个站点的线性趋势对缺失值进行插值(王彧等, 2017; 安彬等, 2020)。该气象数据来源于中国气象科学数据共享服务网(http: //data.cma.cn/)。
2.2.2 模拟气象数据
国家气候中心(BCC)在CMIP5中推出的模式得到国内外学者的大量使用。在此次CMIP6模式中BCC推出的BCC-CSM2-MR模式水平分辨率较高且对全球气温和降水、 气候分布、 大气辐射和东亚降水季节移动等方面相对于早期版本改进明显。在1850 -2005年期间, BCC-CSM2-MR模式对中国气温模拟与观测的相关系数达到0.86, 对中国降水模拟与观测的空间相关系数达到0.73(辛晓歌等, 2019)。可见BCC-CSM2-MR模式对中国气温与降水的模拟能力很好。此外, 部分学者利用该模式预测甘肃省疏勒河流域气温降水的变化趋势也取得了不错的效果(李雅培等, 2021)。
共享社会经济路径(SSPs)包括可持续发展路径(SSP126)、 中间发展路径(SSP245)、 区域竞争发展路径(SSP370)、 不均衡发展路径(SSP460)和常规发展路径(SSP585)五种路径(孔锋, 2020)。本文选用国家气候中心研发的BCC-CSM2-MR模式下SSP126、 SSP245和SSP585三种路径2025 -2100年气温和降水的模拟数据, 以期能全面预估不同路径下植被气候生产潜力的空间变化特征及驱动机制。另选取该模式下1980 -2014年模拟历史气象数据用于偏差订正。SSPs数据来源于The Earth System Grid Federation(https: //esgf-node.llnl.gov/search/cmip6/)。
2.3 研究方法
2.3.1 偏差订正
对过去一百多年全球平均气温的再现能力是衡量模式模拟能力的一个重要标准。为进一步提高BCC-CSM2-MR模式对研究区的模拟精度, 本文选取1980 -2014年同时段历史与模拟气象数据进行偏差订正, 本文订正用到如下两种方法。
(1) 双线性内插法
为减小误差将模拟数据分辨率精确到0.25°×0.25°, 并运用双线性内插法把各路径气象格点数据插值到55个气象站点上。
(2) 气候漂移法
气候漂移是指在外强迫不变的情况下, 耦合模式所固有的虚假长期变化(赵静, 2018)。将1980 -2014年每月各站点模拟数据的平均气温和降水数据减去对应站点实测气象数据的各月平均值得到各站点每月的气候漂移误差, 再用模拟数据减去气候漂移误差即得到订正后的模拟气象数据。
本文用到的检验方法主要有均方根误差、 空间距平相关系数(ACC)以及偏差分析(尹姗等, 2020; 苏琪骅, 2017)。从图2 (a)可以看出, 该模型较好地模拟了研究区气温由南向北逐渐降低的空间变化趋势, 并且准确地模拟出了陕南和陇南地区的气温极大值区域和玛曲等地区的气温极小值区域。模拟值与实测值的空间距平相关系数达到0.71, 通过了0.01显著性水平检验。可见, 该模式对陕甘宁三省区气温的空间分布特征具有很好的模拟效果。温度绝对偏差在2 ℃以内, 视为模拟准确(尹姗等, 2020)。通过对比可以看出, 受地形等因素影响陕西华山和甘肃乌鞘岭地区模拟气温比实测气温偏高4 ℃左右, 陇南和陕南地区模拟气温比实测气温偏低5~7 ℃, 其他地区均存在模拟气温偏低的情况, 且整体均方根误差达到2.28 ℃。订正后均方根误差降低到0.64 ℃, 使误差整体降低了72%。很好地消除了地形以及插值对误差造成的影响。可见, 订正后该模式对陕甘宁三省区气温的空间分布特征模拟情况良好。
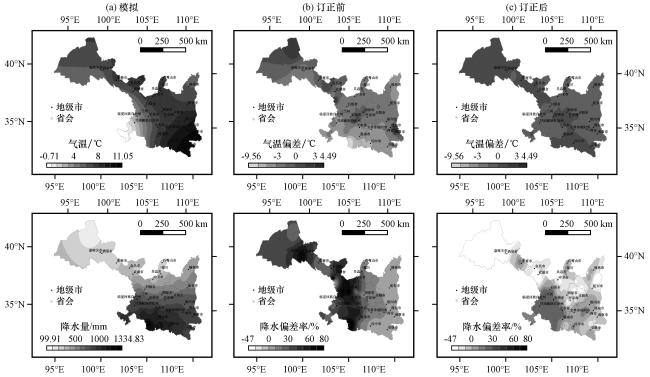
图2 1980 -2014年模拟气温(上)和降水量(下)空间分布(a)及其订正前(b)和订正后(c)分别与观测值的空间偏差率分布图Fig.2 Spatial distribution of simulated temperature (up) and precipitation (down) (a) and the spatial deviation rates of the pre-revised (b) and post-revised (c) analog value with the observed values from 1980 to 2014 |
通过对降水空间分布特征进行分析发现[图2 (a)], 该模型很好地模拟了研究区降水量由东南向西北递减的趋势, 并且准确地模拟出甘肃西北等地的降水极小值区域。模拟值与实测值的降水空间距平相关系数为0.84, 通过了0.01显著性水平检验。可见该模式对陕甘宁三省区的降水空间分布特征有很好的模拟效果。降水偏差率在±20%之间, 视为模拟准确(张蓓和戴新刚, 2017)。通过对比发现, 甘肃宁夏等大部分地区降水偏差较大, 陕西等地降水偏差相对较小。但是, 总体来说模拟降水量要比实测降水量整体偏大。订正后整体均方根误差减小到81 mm, 降水偏差率总体控制在了20%以内。可以很好地预测未来陕甘宁三省区的降水空间分布规律。
2.3.2 气候生产潜力模型
在计算气候生产潜力时, 受国内外专家认可的模型有Thornthwaite Memorial、 Miami、 Chikugo等。其中, Thornthwaite Memorial模型充分考虑了光、 热、 水等气候因素对作物干物质积累的综合作用, 定量表征了作物产量与气温、 降水量和蒸发量等要素的关系。而Miami 模型着重反映水热单因子的潜在影响, 与生产实际不符。Chikugo模型精度较高, 但计算数据量大。侯光良和游松才(1990)以及张宪洲(1993)曾对几种气候生产潜力模型进行比对发现, Thornthwaite Memorial模型更接近Chikugo模型, 对我国植被气候生产潜力的估算较准确。利用Thornthwaite Memorial模型计算了陕甘宁三省区1985 -2019年年均气候生产潜力, 发现该值与同时段研究区主要粮食产量的相关系数达0.63, 通过了P<0.01显著性水平检验, 说明该模型在陕甘宁三省区的适用性较好。且此方法使用数据量较小, 便于计算, 因此本文将使用该模型计算陕甘宁三省区植被气候生产潜力, 其计算公式为:
式中: P为气候生产潜力(单位: kg·hm-2·a-1); V为实际年蒸散量(单位: mm); L为年平均蒸散量(单位: mm); R为年降水量(单位: mm); T为年平均气温(单位: ℃)。
2.3.3 偏相关分析
偏相关分析是在不考虑其他要素影响的前提下计算两个变量之间的相关性。本文利用偏相关分析法研究植被气候生产潜力与气温、 降水的偏相关系数, 探讨植被气候生产潜力的驱动机制。
式中: Rxy, z 表示固定自变量 之后因变量x与自变量y的偏相关系数, 这里因变量为植被气候生产潜力, 自变量为平均气温和降水量。R表示相关系数。偏相关系数的显著性检验一般采用t检验法, 通过气温显著性水平检验的地区定义为气温驱动型; 通过降水显著性水平检验的地区定义为降水驱动型; 同时通过气温与降水显著性水平检验的地区定义为气温降水驱动型, 其统计量计算公式为:
式中: Rxy, z 为偏相关系数; n为样本数; m为自变量个数, 取值为2。
3 结果与分析
3.1 陕甘宁三省区植被气候生产潜力的分布特征
3.1.1 SSP126路径下植被气候生产潜力分布特征
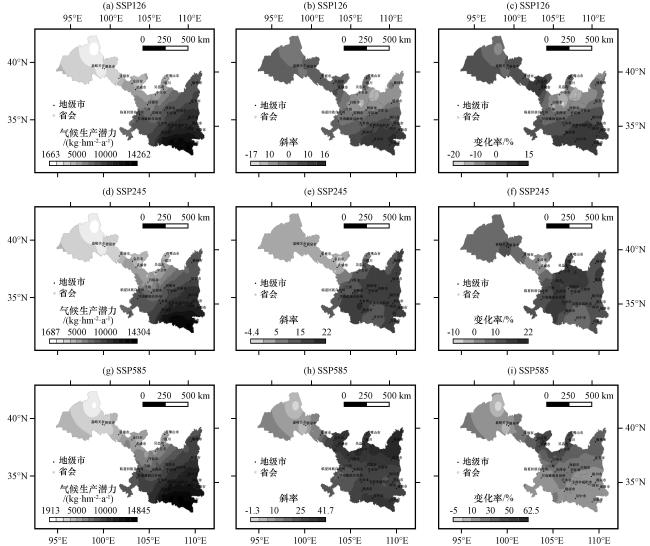
从图3 (a)可知, SSP126路径下未来植被气候生产潜力由东南向西北递减, 变化范围为1662.9~14262.5 kg·hm-2·a-1, 其中, 陕南地区由于气温和降水相对丰富, 植被气候生产潜力最高; 河西走廊受大陆性气候和地形影响, 气候干旱, 降水稀少, 植被气候生产潜力相对最低, 空间差异较大。从陕甘宁三省区增加和减少的区域分布来看[图3 (b), (c)], SSP126路径下2025 -2100年植被气候生产潜力减少的范围空间占比为40.7%, 主要集中在陕北榆林、 延安, 甘肃白银、 兰州、 临夏、 定西、 酒泉北部以及宁夏大部分地区。其中, 宁夏中部海原县斜率和多年变化率出现极小值, 多年增量为 -20%~-15%, 宁夏盐池和陕西定边附近增量在 -15%~-10%, 植被气候生产潜力下降趋势显著(P<0.01)。SSP126路径下未来植被气候生产潜力增加的范围达59.3%, 主要集中在陕西省中南部, 甘肃省东南部以及河西走廊大部分地区。甘肃民勤县增量出现极大值, 植被气候生产潜力增加了10%~15%(P<0.01)。总体来看, SSP126路径下陕甘宁三省区2025 -2100年植被气候生产潜力大部分地区呈上升趋势。河西走廊地区气候条件明显改善, 植被气候生产潜力显著增加。宁夏未来气候条件逐渐恶化, 全省气候生产潜力下降趋势明显。
3.1.2 SSP245路径下植被气候生产潜力分布特征
SSP245路径下研究区植被气候生产潜力与SSP126路径类似, 依然由东南向西北递减[图3 (d)]。平均植被气候生产潜力变化范围为1687.4~14303.7 kg·hm-2·a-1, 空间差异相较SSP126路径更大。从图3 (e)和图3 (f)来看, 相较SSP126路径SSP245路径超过98.7%的地区斜率为正, 大部分地区植被气候生产潜力不断增加, 陕西、 宁夏以及甘肃兰州以东等地区斜率均超过10, 增量超过10%, 上升趋势最明显(P<0.01)。与SSP126路径不同的是, 宁夏中部海原、 盐池, 陕北榆林、 延安, 甘肃白银、 定西、 天水等地植被气候生产潜力显著增加(P<0.01), 而甘肃民勤附近斜率和增量出现极小值, 植被气候生产潜力下降明显(P<0.01), 这与SSP126路径完全相反。SSP245路径下河西走廊整体斜率在0~10, 增量为0~15%, 尤其是嘉峪关、 玉门等地植被气候生产潜力显著上升(P<0.01), 而SSP126路径除了瓜州县以北之外, 整体也呈现上升趋势, 两者是类似的。可见, SSP245路径下未来植被气候生产潜力增加趋势更加明显。并且, 兰州以东的增量整体大于河西走廊。
3.1.3 SSP585路径下植被气候生产潜力分布特征
SSP585路径下植被气候生产潜力空间变化幅度达到12932.3 kg·hm-2·a-1, 大于其他两个路径[图3 (g)]。最小值为1913 kg·hm-2·a-1, 位于甘肃西北部, 最大值为14845.3 kg·hm-2·a-1, 位于陕南地区, 整体依然由东南向西北递减。SSP585路径的空间斜率[图3 (h)]和增量[图3 (i)]均大于其他两个路径。斜率为正的空间范围达到99.1%, 且超过69.1%的地区斜率大于20。甘肃金昌以东植被气候生产潜力的增量呈现由南向北递增的趋势, 金昌以西则呈现由东南向西北递减的趋势, 且超过71.4%的地区增量集中在10%~30%。对比发现, 陕北榆林、 延安, 陕南汉中、 安康, 宁夏大部以及甘肃武威、 白银等地斜率超过30, 占比为29.7%。这与SSP245路径的变化趋势较为相似, 与SSP126路径相反。同时发现, 甘肃民勤变化率出现极大值, 植被气候生产潜力增加超过50%, 这又与SSP126路径较为相似。值得注意的是, 河西走廊除酒泉市瓜州县极少部分地区植被气候生产潜力呈下降趋势以外, 大部分地区植被气候生产潜力显著增加(P<0.01)。总体来看, SSP585路径下未来气候生产潜力无论是增加趋势还是增加的面积均大于其他两个路径。
3.1.4 不同路径植被气候生产潜力的变化幅度
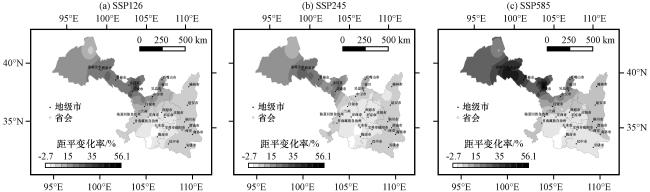
将1960 -2019年的历史平均植被气候生产潜力作为基准期, 得到不同路径下植被气候生产潜力的距平变化率(图4 )。对比发现, 植被气候生产潜力距平减小的区域极少。其中, SSP245路径[图4 (b)]与基准期相比, 甘肃天水秦州区、 甘谷县东南、 麦积区西北, 陇南礼县、 西和县北部、 武都区西北、 文县以及白银市会宁南部、 通渭北部地区减少了0~2.7%, 占比为2.4%。SSP126路径[图4 (a)]减少的地区和幅度与SSP245类似, 空间占比为2.2%。SSP585路径[图4 (c)]与其他两条路径不同, 植被气候生产潜力基于基准期全部增加。总体来看, 大部分地区在不同路径下基于基准期的植被气候生产潜力显著增加, 按照空间占比由大到小依次为SSP585(100%)、 SSP126(97.8%)、 SSP245(97.6%)。其中, 甘肃省除上述部分减少的区域外, 其他地区植被气候生产潜力则显著增加。三条路径在河西走廊的兰州、 白银、 武威、 金昌、 张掖、 酒泉等地区植被气候生产潜力较历史基准期显著提高, 增幅分别集中在10%~40%(SSP126)、 10%~30%(SSP245)、 10%~56.1%(SSP585)。可见, 未来不同路径下河西走廊地区的气候环境都将显著改善, 植被气候生产潜力将不断增加。另外, 陕西省在SSP126和SSP245路径下大部分地区增加了5%~10%, 在SSP585路径下陕南地区增加了10%~15%, 陕西中部和北部则增加更为明显,在15%~20%。宁夏不同路径增幅自南向北逐渐增加, 尤其是吴忠、 银川以及石嘴山地区增加最多, SSP585路径下植被气候生产潜力增加最多, 增加了10%~30%, SSP126路径和SSP245路径下增加了0%~20%。
3.2 陕甘宁三省区气候变化特征
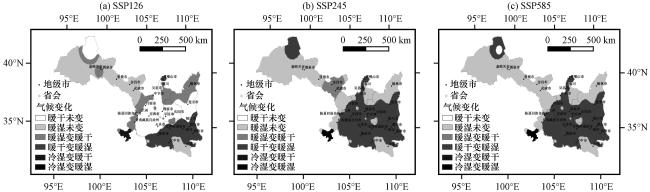
将不同路径的气候空间变化趋势(2025 -2100年)与历史基准期(1960 -2019年)进行对比发现(图5 ), SSP126路径下[图5 (a)]有30.07%的地区依旧保持暖干趋势(P<0.01), 16.9%的地区由“暖干型”向“暖湿型”转变(P<0.01), 转变的地区有陕西渭南、 咸阳、 西安、 宝鸡、 汉中中西部, 甘肃陇南以及宁夏石嘴山。此外, 有32.4%的地区依旧保持暖湿趋势(P<0.01), 另外陕西榆林, 宁夏吴忠、 中卫沙坡头区, 甘肃景泰县、 兰州永登、 皋兰西部及兰州城区, 临夏永靖县、 临夏县, 甘南夏河县, 嘉峪关市、 瓜州部分等地区由“暖湿型”向“暖干型”变化(P<0.01), 面积占比19.3%。甘肃玛曲县由“冷湿型”向“暖干型”变化(P<0.01)。SSP245路径下[图5 (b)]46.9%的“暖干型”地区全部转向“暖湿型”方向发展(P<0.01)。此外, 与历史情况相比46.3%的地区依旧保持“暖湿型”(P<0.01), 只有5.4%的地区向“暖干型”变化(P<0.01), 主要集中在甘肃金昌市, 武威民勤、 凉州、 天祝西北, 张掖山丹县等地。甘肃玛曲县由“冷湿型”向“暖湿型”变化(P<0.01)。SSP585路径下[图5 (c)]仅有0.8%的地区保持“暖干型”(P<0.01), 有46.1%的地区由原来的“暖干型”转变为“暖湿型”(P<0.01)。历史时期的“暖湿型”地区依旧保持未变。另外, 1.4%的“冷湿型”气候向“暖湿型”转变(P<0.01)。
3.3 陕甘宁三省区植被气候生产潜力的驱动力
3.3.1 SSP126路径下植被气候生产潜力的驱动力
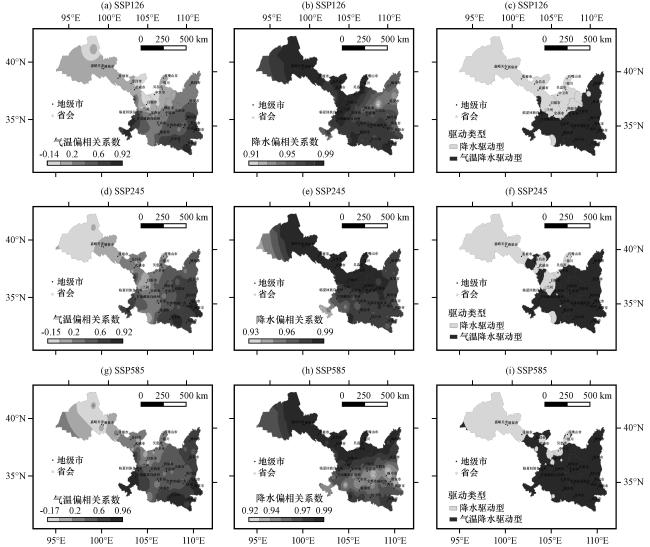
从SSP126路径下植被气候生产潜力与气温[图6 (a)]、 降水[图6 (b)]的偏相关分析结果来看, 植被气候生产潜力与降水的偏相关性最强, 全部呈正相关, 偏相关系数介于0.92~0.99之间, 平均值为0.96, 且全部通过P<0.01水平的显著性t检验。植被气候生产潜力与气温的偏相关系数介于-0.14~0.93, 平均值为0.40。其中, 气温对甘肃瓜州、 白银、 武威北部及宁夏中卫等约占10.9%的地区的植被气候生产潜力呈负向抑制。这些地区在SSP126路径下气候保持“暖干型”或逐渐向“暖干型”发展, 气温的上升加剧了气候的干旱, 使植被气候生产潜力减少。受相同原因影响, 植被气候生产潜力与气温的偏相关系数在甘肃河西走廊、 宁夏、 陕北等地普遍较低, 只有45.5%的地区通过了P<0.01水平的显著性t检验。说明在SSP126路径下降水是陕甘宁三省区植被气候生产潜力最强的驱动力。从SSP126路径下植被气候生产潜力的驱动力类型来看[图6 (c)], 有“降水驱动型”和“气温降水驱动型”两种。河西走廊等地地处内陆, 受夏季风影响小, 降水少, 光照强, 主要受到水分胁迫, 光照通常不构成限制条件, 气温的升高加剧了气候的干旱, 气温对该地区的植被气候生产潜力呈负向抑制。与基准期相比, 宁夏以及甘肃白银等地气候向“暖干型”发展, 降水量对植被气候生产潜力的正向促进显著增加, 暖干的气候环境下, 气温的上升让降水成为最主要的驱动因素。陕西、 甘肃东南等地区则受到气温与降水的联合驱动, 气温与降水对植被气候生产潜力为正向促进。总体来看, SSP126路径下随着部分地区气候变干, 单一受降水驱动的面积较大。


3.3.2 SSP245路径下植被气候生产潜力的驱动力
SSP245路径下植被气候生产潜力与气温的偏相关系数介于-0.15~0.92[图6 (d)], 平均值为0.39。其中, 甘肃酒泉等地区植被气候生产潜力与气温的负向抑制作用明显, 面积占比达27.4%。另外有59.2%的地区通过了P<0.01水平的显著性t检验。植被气候生产潜力与降水的偏相关系数介于0.94~0.99[图6 (e)], 平均值为0.97, 全部通过P<0.01水平的显著性t检验。植被气候生产潜力与降水的偏相关性更强。甘肃河西走廊、 兰州、 白银部分地区以及宁夏银川、 石嘴山等地气候干旱, 降水稀少, 植被气候生产潜力主要受降水驱动。陕西、 宁夏、 甘肃东南部等地区气候向“暖湿型”发展, 植被气候生产潜力受气温和降水正向促进。总体来看[图6 (f)], SSP245路径下随着陕甘宁三省区“暖湿型”面积的扩大, 植被气候生产潜力受气温和降水正向促进的面积较SSP126路径有所增加。
3.3.3 SSP585路径下植被气候生产潜力的驱动力
SSP585路径下植被气候生产潜力与气温的偏相关系数介于-0.17~0.96[图6 (g)], 平均值为0.40。有12.5%的地区植被气候生产潜力与气温呈负相关, 依然是在甘肃酒泉瓜州等地, 气温有65.1%的地区通过了P<0.01水平的显著性t检验, 其对植被气候生产潜力呈正向促进。植被气候生产潜力与降水的偏相关系数介于0.93~0.99[图6 (h)], 平均值达到了0.96, 且全部通过P<0.01水平的显著性t检验。与其他路径原因类似[图6 (i)], 甘肃河西走廊西部宁夏石嘴山、 银川及中卫沙坡头区等地为“降水驱动型”。大部分地区仍然是“气温降水驱动型”, 植被气候生产潜力受气温和降水的共同正向驱动。
4 结论
陕甘宁三省区自然环境复杂多样, 生态环境脆弱, 对气候变化响应敏感。在全球气候变化背景下, 植被气候生产潜力的研究对该地区农林牧业的生产布局以及生态系统管理等方面起到积极作用。通过对陕甘宁三省区2025 -2100年植被气候生产潜力的变化特征以及驱动机制进行研究发现:
(1) 研究区植被气候生产潜力空间差异巨大, 整体由东南向西北递减。从2025 -2100年各省区的变化来看, 不同路径下甘肃河西走廊大部分地区保持历史时期向“暖湿型”发展的气候特点, 气温与降水的正向驱动让农牧业生态环境逐渐改善, 植被气候生产潜力不断增加, 而SSP245路径下甘肃民勤附近则出现下降趋势。
(2) 陕西省在SSP126路径下除榆林和延安等地植被气候生产潜力为下降趋势以外, 其他地区保持“暖湿型”气候特征, 植被气候生产潜力逐渐增加。在SSP245和SSP585路径下陕西全省植被气候生产潜力均呈增加趋势, 且陕北地区增加趋势最强。宁夏回族自治区在SSP126路径下气候向“暖干型”发展, 随着降水的减少, 气温的负向抑制突显, 全区植被气候生产潜力呈下降趋势, 与此相反的是SSP245和SSP585路径下全区植被气候生产潜力显著增加。宁夏不同路径下植被气候生产潜力增幅自南向北递增, 在吴忠、 银川以及石嘴山地区增加最多, 为宁夏平原农牧业的可持续发展提供了保障。
(3) 陕甘宁三省区植被气候生产潜力的驱动类型有两种, 分别是“降水驱动型”和“气温降水驱动型”。部分地区 “暖干型”气候变化趋势下, 气温的负向抑制作用突显。相较气温来说, 研究区植被气候生产潜力均受降水驱动, 且降水是植被气候生产潜力的主要驱动力。
未来气候条件下对位于我国西北的陕甘宁三省区来说气候生产潜力总体增加, 为我国粮食增产和西北生态环境的恢复有着积极影响。常规发展路径(SSP585)下植被气候生产潜力增加趋势最为明显, 中间发展路径(SSP245)次之, 可持续发展路径(SSP126)下呈增加趋势的面积最小, 近年来诸位学者在黄淮海地区以及淮河以南等地也得到类似结论(王胜等, 2020; 赵俊芳等, 2011)。但是, 常规发展路径(SSP585)下全球变暖加剧, 极端气候增多(赵宗慈等, 2021; 向竣文等, 2021), 选择哪条发展路径更为合适, 需要学者进一步的研究, 同样也是摆在决策者面前的一个重要问题。但无论哪条路径, 气候变暖趋势无法阻挡, 面对气候挑战需要决策者科学规避不利气候因素, 合理调整生产布局, 趋利避害, 因地制宜地利用气候资源提高生产力水平, 为区域可持续发展创造有利环境。