
1 引言
2 资料来源和方法介绍
3 结果分析
3.1 南亚高压位置变化与高原降水的关系
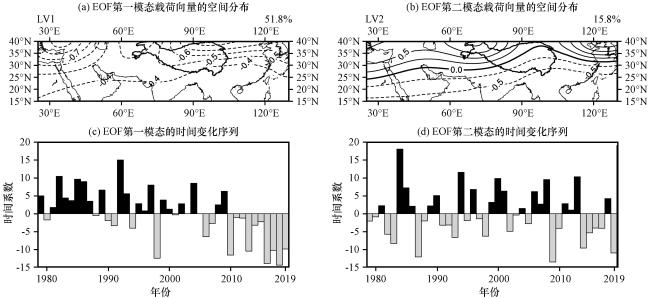
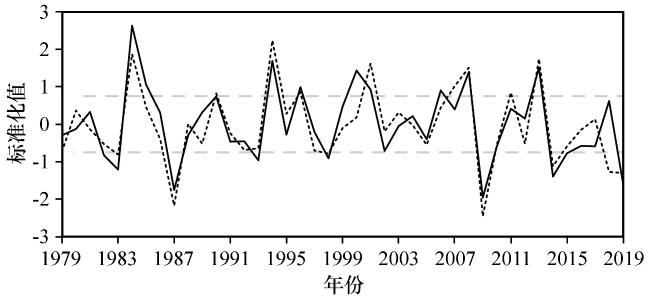
图2 1979 -2019年200 hPa位势高度场EOF第二模态时间序列的标准化序列(黑色实线)和南亚高压位置变化指数(黑色虚线, 引自Wei et al, 2015)The dotted gray line represents 0.75 Fig.2 Normalized time series of PC2 for 200 hPa geopotential height from 1979 to 2019 (solid black line) and position index of South Asian High (SAH) at inter-annual scale (dashed black line, from Wei et al, 2015). |
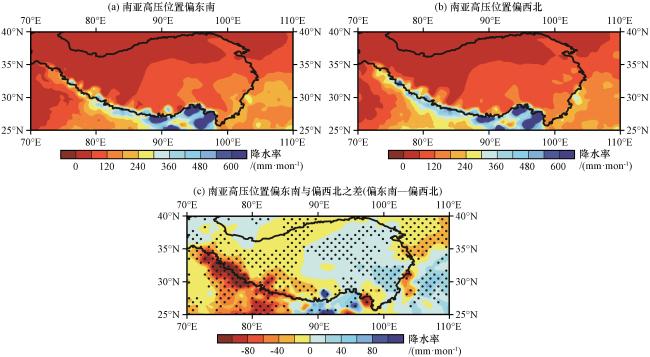
图3 南亚高压位置年际异常合成年份中高原及其周边地区(a~c)夏季累积降水率的空间分布(单位: mm· mon-1)The dotted area denotes that the difference passes the significance test of 0.05 Fig.3 Spatial distribution of summer accumulated precipitation rate over the Qinghai-Xizang Plateau (QXP) and its vicinity (a~c) in composite year of inter-annual anomaly of SAH position.Unit: mm·mon-1. |
3.2 关键物理过程的特征及作用
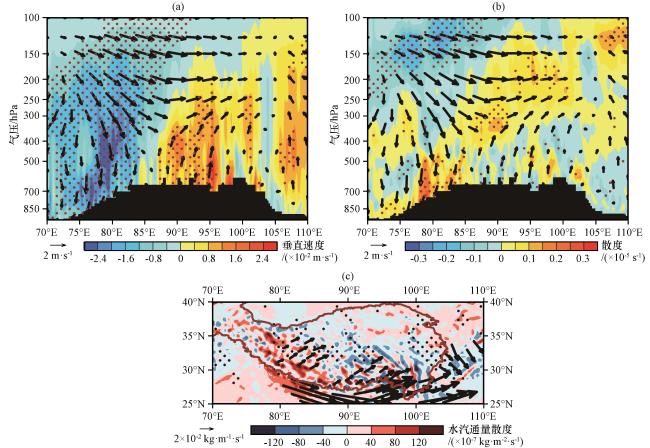
图4 南亚高压位置偏东南年份与偏西北年份(偏东南-偏西北)对应的25°N -35°N平均的垂直速度(a, 彩色区, 单位: 10-2 m·s-1), 散度(b, 彩色区, 单位: 10-5 s-1), 高原及其周边地区850~300 hPa积分水汽通量(矢量, 单位: 102 kg·m-1·s-1)及其散度(彩色区, 单位: 10-7 kg·m-2·s-1)的差异(c)The vectors in Fig.4(a)~(b) represent the difference of horizontal wind speed.The dotted area in (a)~(c) represents that the difference passes the significance test of 0.05, the vector in Fig.4(c) denotes that the difference passes the significance test of 0.05 Fig.4 Height vs.longitude cross-section of the mean vertical velocity (a, color area, unit: 10-2 m·s-1), the mean divergence (b, color area, unit: 10-5 s-1) for the region of 25°N -35°N, and the spatial distribution of integrated water vapor flux from 850 hPa to 300 hPa ( 102 kg·m-1·s-1) and its divergence (color area, unit: 10-7 kg·m-2·s-1) (c) over the Qinghai-Xizang Plateau and its surrounding areas, corresponding to the differences between the anomaly of South Asia High position (southeast minus northwest). |
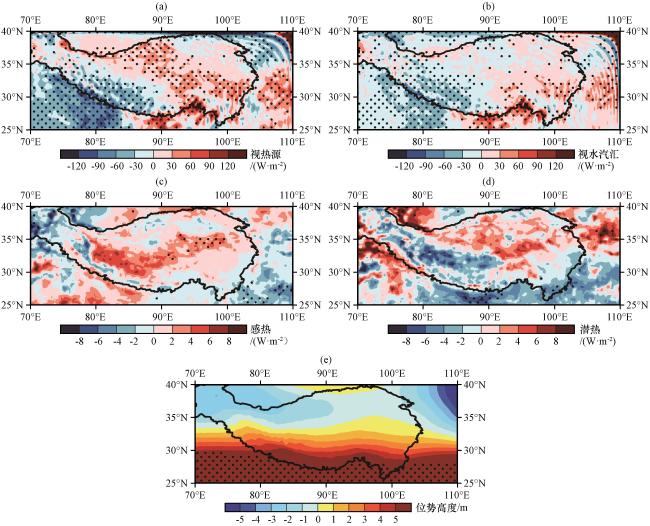
图5 南亚高压位置偏东南年份与偏西北年份(偏东南-偏西北)对应的高原及其周边地区整层视热源<Q 1 >(a, 单位: W·m-2)、 整层视水汽汇<Q 2 >(b, 单位: W·m-2)、 高原地表感热(c, 单位: W·m-2)、 高原地表潜热(d, 单位: W·m-2)及高原500 hPa位势高度(e, 单位: m)的差异打点区域表示差值通过了0.05的显著性检验 Fig.5 Spatial distribution of vertically integrated apparent heat source<Q 1 > (a, unit: W·m-2), vertically integrated apparent moisture sink <Q 2 > (b, unit: W·m-2), surface sensible heat flux (c, unit: W·m-2), surface latent heat flux (d, unit: W·m-2), and geopotential height at 500 hPa (e, unit: m) over the Qinghai-Xizang Plateau and its surrounding areas, results are corresponding to the differences between the anomaly of South Asia High position (southeast minus northwest). The dotted area represents that the difference passes the significance test of 0.05 |
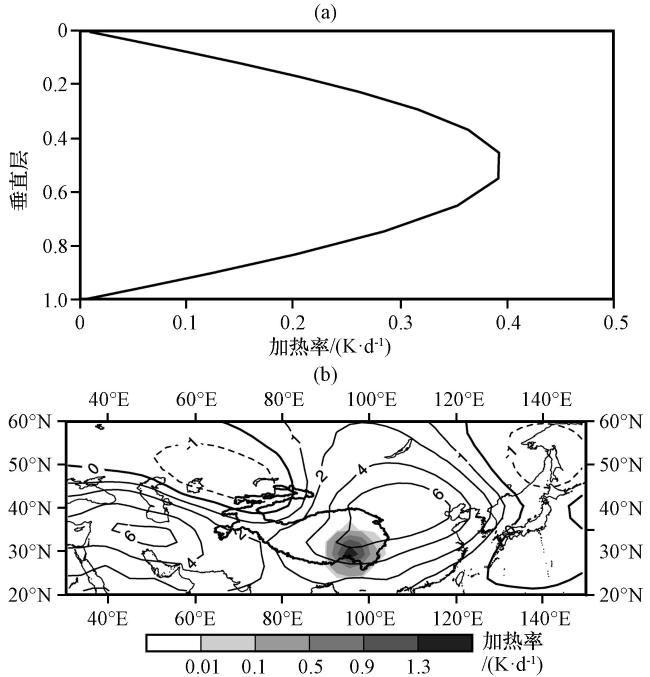
图6 敏感性试验中高原东部大气加热廓线的垂直分布(a), 200 hPa位势高度异常(等值线, 间隔分别为-1.0、 0.0、 1.0、 2.0、 4.0、 6.0, 单位: m)及 层的大气异常加热(阴影, 单位: K·d-1)的水平分布(b)Fig.6 The vertical distribution of atmospheric heating profiles on the eastern Qinghai-Xizang Plateau (a), the spatial distribution of geopotential height anomaly at 200 hPa (contours with intervals of -1.0, 0.0, 1.0, 2.0, 4.0, and 6.0, respectively.Unit: m) and horizontal atmospheric heating (the shaded, unit: K·d-1) at in the sensitivity experiment (b) |