1 引 言
2 资料来源与方法介绍
3 冰雹天气实况和羊桥现场调查
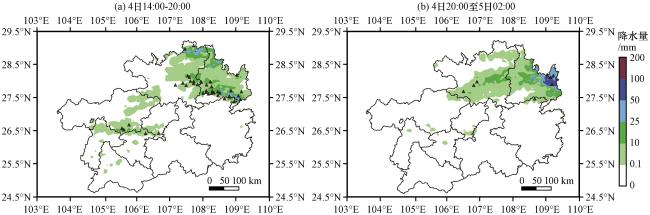
3.1 天气实况
3.2 岑巩羊桥现场调查
4 冰雹发生的天气背景和环境条件
4.1 天气背景
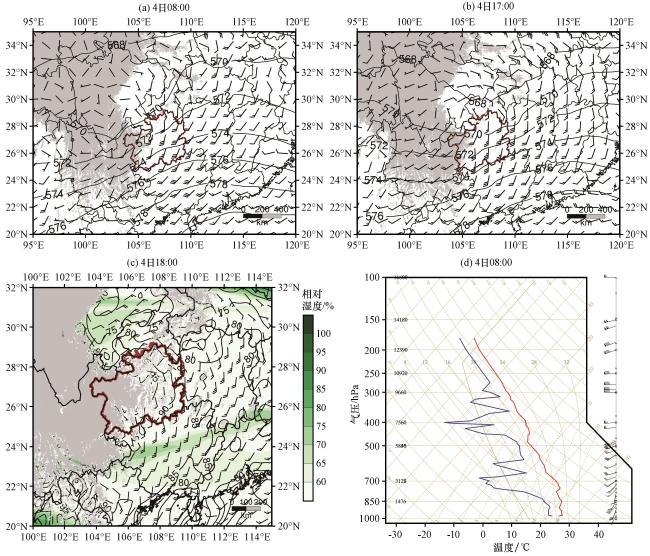
图2 2020年5月4日08:00(a)和17:00(b)500 hPa位势高度场(等值线, 单位: dagpm)和850 hPa风场(风羽), 18:00(c)925 hPa风场和相对湿度(彩色区, 单位: %)、 假相当位温(等值线, 单位: ℃)以及08:00怀化探空(d)图(a)和(b)中灰色阴影表示地形大于1500 m的区域, 图(c)中灰色阴影表示地形大于1000 m的区域, 图(a)~(c)中棕色线区域为贵州省 Fig.2 The height field at 500 hPa (contour, unit: dagpm) and the wind field at 850 hPa at 08:00 (a), 17:00 (b) on 4 May 2020, and the wind field and relative humidity (color area, unit: %) at 925 hPa at 18:00 (c) on 4 May 2020 and potential pseudo-equivalent temperature (contour, unit: ℃) and Huaihua sounding at 08:00 (d).In Fig.2(a) and (b), the gray shadow area stands for terrain height more than 1500 m, in Fig.2(c), the grey shaded area stands for terrain height more than 1000 m, and in Fig.2(a)~(c), The region in the brown line is Guizhou Province |
4.2 热力环境条件
5 冰雹超级单体风暴的移动与结构特征
5.1 超级单体风暴的移动
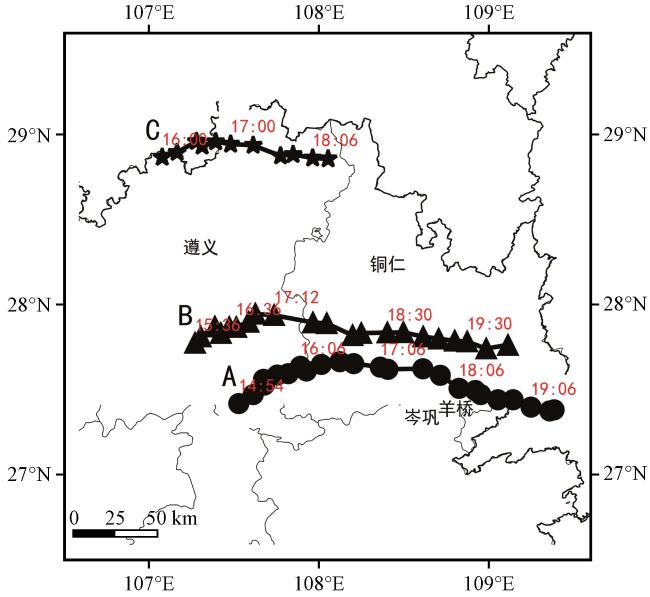
图3 2020年5月4日15:00 -19:00贵州北部强风暴超级单体移动轨迹(黑线)A、 B、 C分别代表三个超级单体, 黑色圆点、 黑色三角形和黑色五角星分别为该单体的最强反射率因子核心 Fig.3 The moving track (black line) of the strong storm supercell in northern Guizhou from 15:00 to 19:00 on 4May 2020.The capital letter A, B and C respectively represent the three supercells, with black dot, black triangle and black five-pointed star as the core of the strongest reflectivity factor |
5.2 超级单体风暴的结构特征
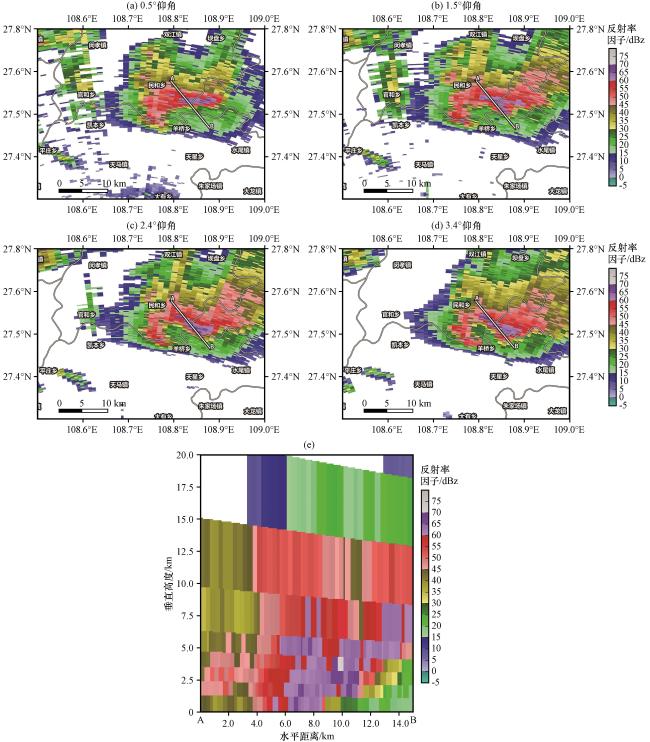
图5 2020年5月4日18:08三穗不同仰角雷达反射率因子(a~d, 彩色区, 单位: dBz)与反射率因子(彩色区, 单位: dBz)沿AB线的垂直剖面(e)Fig.5 The reflectivity at different Angle of elevation (a~d, color area, unit: dBz) and the reflectivity (e, color area, unit: dBz) echo along the solid lines AB in the figure a profile from Sanhui radar at 18:08 on 4 May 2020 |
6 超级单体风暴的发展机制
6.1 近地面的触发及发展条件
6.2 超级单体发展的动力条件
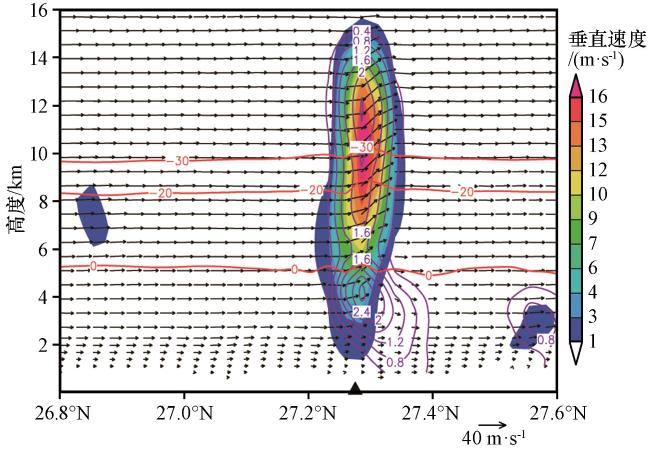
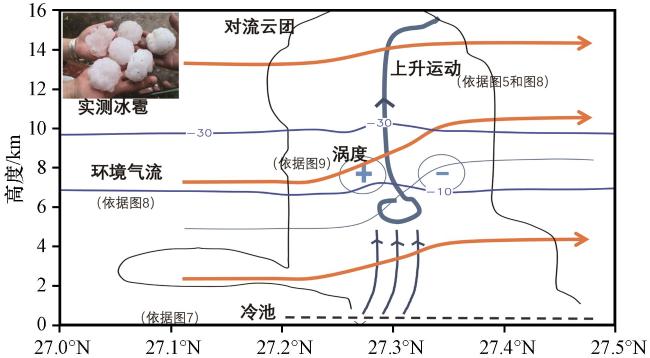
图8 模拟的(3 km)格距2020年5月4日18:10沿羊桥的垂直剖面阴影为垂直速度(单位: m·s-1); 紫色等值线为固(液)态水凝物含量(单位: g·kg-1); 红色粗实线为0 ℃、 -20 ℃和-30 ℃线; 风矢量为垂直运动W与水平风U的合成(单位: m·s-1) 三角形标识羊桥所在位置 Fig.8 The vertical profile by simulated data (3 km grid) along Yangqiao at 18:10 on 4 May 2020.The shadow is the vertical velocity (unit: m·s-1); The purple contour line is the Solid (liquid) hydrocoagulant content (unit: g·kg-1); The thick red lines are 0 ℃, -20 ℃ and -30 ℃; The wind vector is the combination of vertical movement W and horizontal wind U (unit: m·s-1).The black triangle indicates the position of Yangqiao |
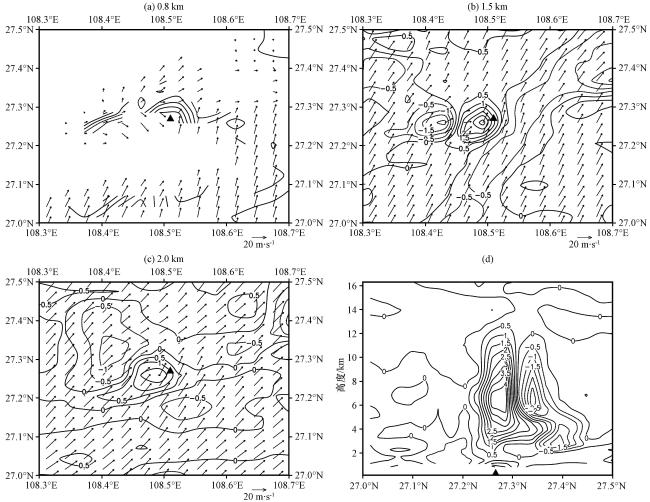
图9 模拟的(3 km)格距2020年5月4日18:10在0.8 km高度(a)、 1.5 km高度(b)和2.0 km高度(c)风场(矢量, 单位: m·s-1)和垂直涡度(等值线, 单位: ×10-3 s-1), 以及沿羊桥的涡度垂直剖面(d, 等值线, 单位: ×10-3 m·s-1)三角形符号标识羊桥所在位置 Fig.9 The wind field (vector, unit: m·s-1) and vertical vorticity (contour, unit: ×10-3 s-1) at an altitude of 0.8 km (a), 1.5 km (b) and 2.0 km (c), and the vertical section of vorticity (d, contour, unit: ×10-3 m·s-1) along Yangqiao at 18:10 on May 4 2020 by simulated data (3km grid).The triangle marks the location of the Yangqiao |