

1 引言
2 资料来源和方法介绍
3 云南冬季气温的主要模态及其变化特征
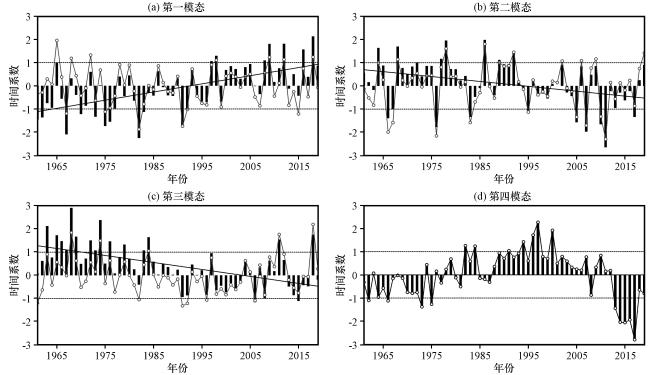
图3 云南冬季气温前四个EOF模态相应的标准化时间序数柱状线为原始时间系数标准化序列, 折线为去除线性趋势以后的标准化时间序列, 实线为线性趋势 Fig.3 The standardized time coefficient corresponding to four dominant EOF patterns of winter temperature in Yunnan.The column is standardization series of the original time coefficient.Curve is the standardized time coefficient series removed the linear trend.Solid line is the linear trend |
表1 云南冬季气温前四个EOF模态相应的标准化时间序列去除线性趋势后 1和 的异常年份Table 1 The abnormal years that more than 1 or less than -1 of the normalized time series removed the linear trend of four dominant EOF patterns of winter temperature in Yunnan |
| RPC1 | RPC1 | RPC2 | RPC2 | RPC3 | RPC3 | RPC4 | RPC4 | |
|---|---|---|---|---|---|---|---|---|
| 合计 | 7 | 6 | 10 | 9 | 6 | 6 | 7 | 9 |
| 年份 | 1965/1968/ 1972/1998/ 2009/2012/ 2018 | 1067/1975/ 1982/1991/ 1992/2015 | 1964/1968/ 1978/1986/ 1989/1992/ 2002/2006/ 2009/2019 | 1966/1967/ 1976/1986/ 1995/2005/ 2007/2012/ 2011 | 1963/1968/ 1974/1984/ 2011/2018 | 1961/1982/ 1991/1992/ 1996/2006 | 1982/1984/ 1991/1994/ 1996/1997/ 2000 | 1962/1966/ 1973/1975/ 2013/2014/ 2015/2016/ 2017 |
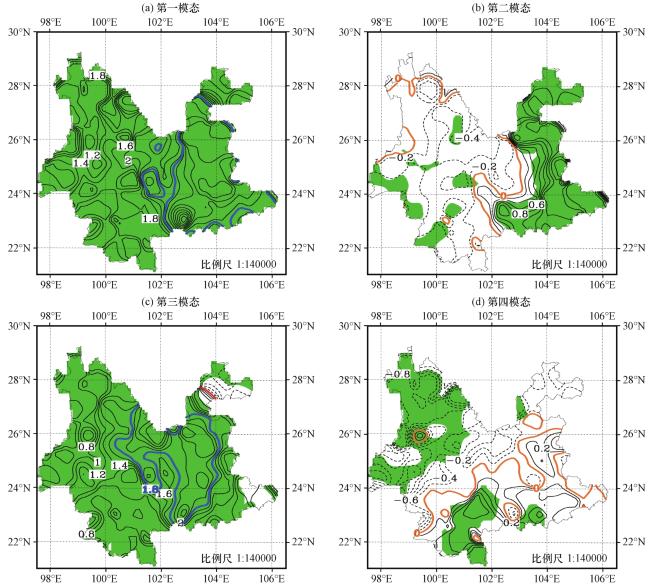
图4 前四个模态相应的正负异常年云南冬季气温的合成差值场橙色粗实线是0 ℃线; 蓝色粗实线是温度偏高超过1.8 ℃的区域; 绿色阴影标注为通过0.05显著性检验的区域 Fig.4 The composite difference fields of winter temperature in Yunnan in positive and negative years of four dominant EOF patterns.Orange thick line is 0 ℃, blue thick solid line mark the area with temperature higher than 1.8 ℃.Green shaded area indicates the area passing 0.05 significant test |
4 影响云南冬季气温主要模态的关键环流因子
4.1 第一模态
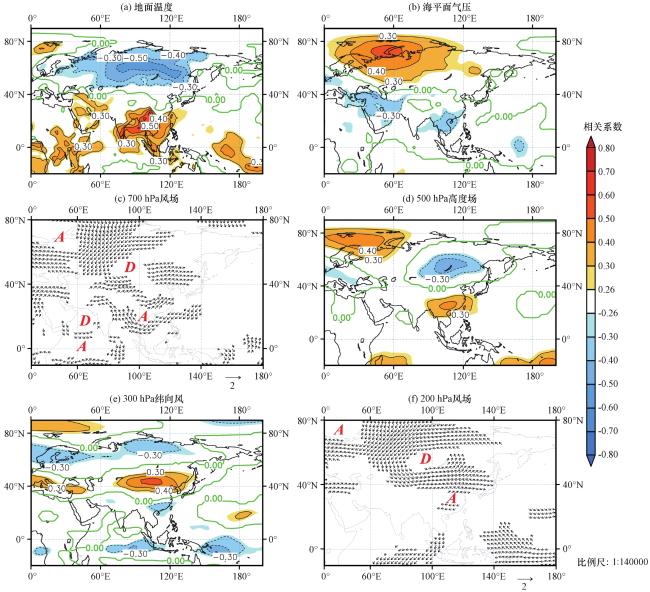
图5 1961 -2019年冬季RPC1与高低层大气环流的相关系数阴影区和矢量箭头标注为通过0.05显著性检验的区域, 绿色实线为相关系数0线 Fig.5 Spatial distribution of correlation coefficients between RPC1 and upper and lower atmospheric circulation in winter of 1961 -2019.The shaded area and vector arrow are marked as the area passing the 0.05 significant test, and the green solid lines are the 0 value lines of correlation coefficient |
4.2 第二模态
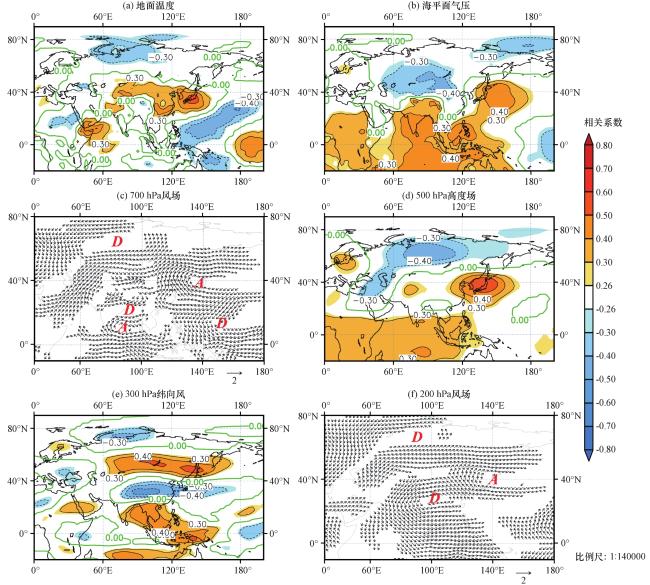
图6 1961 -2019年冬季RPC2与高低层大气环流的相关系数阴影区和矢量箭头标注为通过0.05显著性检验的区域, 绿色实线为相关系数0线 Fig.6 Spatial distribution of correlation coefficients between RPC2 and upper and lower atmospheric circulation in winter of 1961 -2019.The shaded area and vector arrow are marked as the area passing the 0.05 significant test, and the green solid lines are the 0 value lines of correlation coefficient |
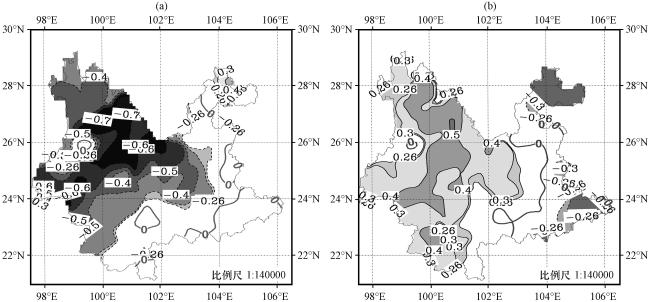
图7 1961 -2019年冬季(a)孟加拉湾区域(15°N -25°N, 80°E -100°E)700 hPa相对涡度VORT指数和(b)东南亚区域Uwnd-shear-300指数与云南冬季气温的相关阴影区为通过0.05显著性检验的区域 Fig.7 The correlation distribution between (a)700 hPa relative vorticity VORT index in BOB and (b)Uwnd-shear-300 index in Southeastern Asia (15°N -25°N, 80°E -100°E) and winter temperature in winter in Yunnan for 1961 -2019.The shaded area are marked as the area passing the 0.05 significant test |
4.3 第三模态
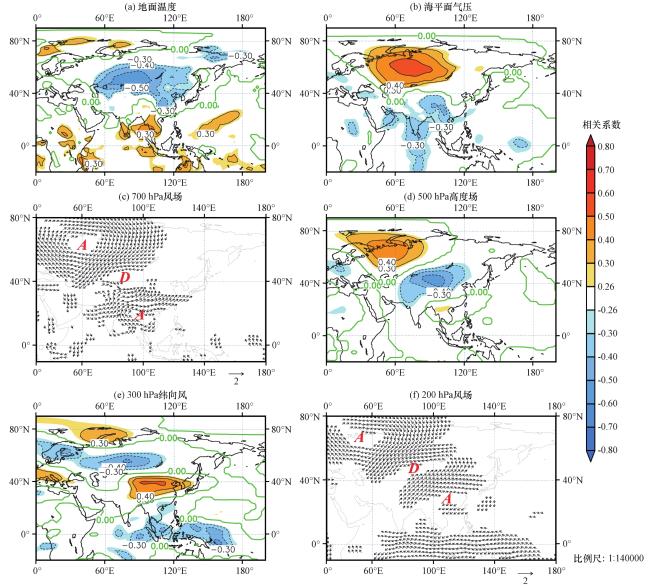
图8 1961 -2019年冬季RPC3与高低层大气环流的相关系数阴影区和矢量箭头标注为通过0.05显著性检验的区域, 绿色实线为相关系数0线 Fig.8 Spatial distribution of correlation coefficients between RPC3 and upper and lower atmospheric circulation in winter of 1961 -2019.The shaded area and vector arrow are marked as the area passing the 0.05 significant test, and the green solid lines are the 0 value lines of correlation coefficient |
4.4 第四模态
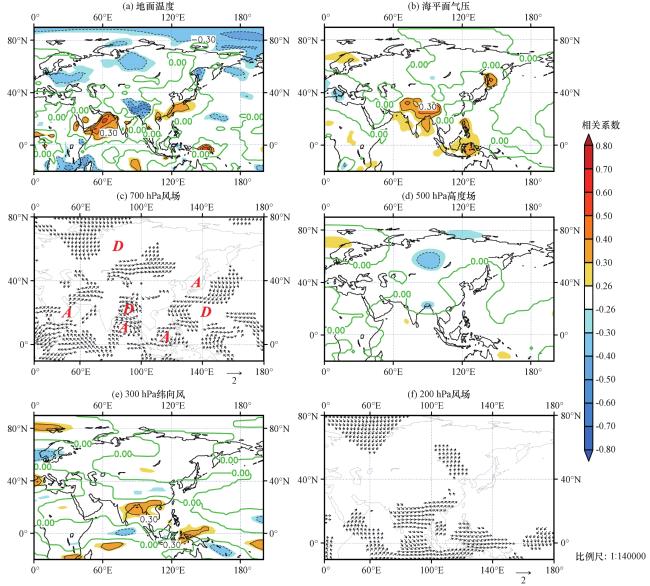
图9 1961 -2019年冬季RPC4与高低层大气环流的相关系数阴影区和矢量箭头标注为通过0.05显著性检验的区域, 绿色实线为相关系数0线 Fig.9 Spatial distribution of correlation coefficients between RPC4 and upper and lower atmospheric circulation in winter of 1961 -2019.The shaded area and vector arrow are marked as the area passing the 0.05 significant test, and the green solid lines are the 0 value lines of correlation coefficient |
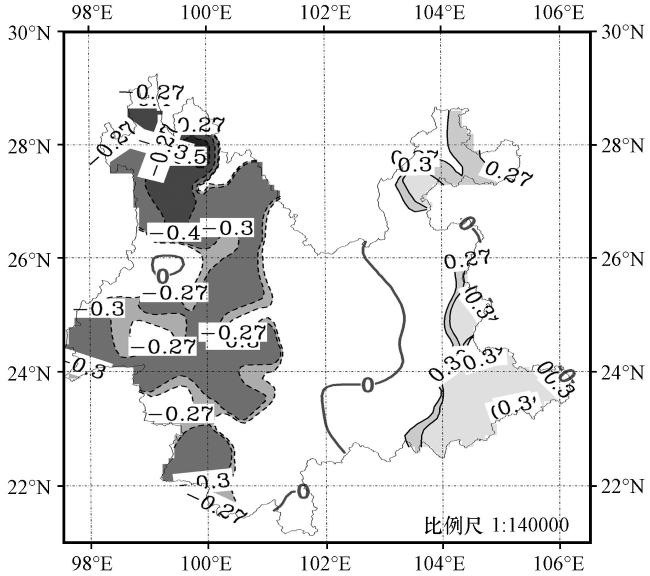
图10 1961 -2019年冬季孟加拉湾(10°N -20°N, 80°E -100°E)200 hPa纬向风区域平均与云南气温的相关阴影区为通过0.05显著性检验的区域Fig.10 The correlation distribution between the regionally averaged 200 hPa zonal wind over the Bay of Bengal (10°N -20°N, 80°E -100°E) and temperature in winter in Yunnan for 1961 -2019.The shaded area are marked as the area passing the 0.05 significant test |


5 冬季气温主要模态与不同大气环流指数的关系
5.1 与大气遥相关型环流变化的关系
表2 四个EOF主要模态时间系数与不同大气遥相关型指数的相关Table 2 The correlation coefficient between four dominant EOF time coefficients and different atmospheric teleconnection indices |
| SCA | EAWR | PE | NAO | AO | EA | PNA | NP | WP | TNH | |
|---|---|---|---|---|---|---|---|---|---|---|
| RPC1 RPC2 RPC3 RPC4 | 0.34 -0.07 0.46 -0.04 | -0.12 0.35 -0.21 0.19 | 0.04 0.13 -0.12 0.09 | -0.30 -0.10 -0.21 -0.11 | -0.10 -0.01 -0.11 -0.17 | 0.16 0.27 -0.12 0.15 | -0.16 -0.16 -0.07 0.19 | 0.01 0.11 -0.08 -0.08 | 0.43 0.36 0.09 0.04 | -0.19 -0.08 -0.19 -0.25 |
相关系数r= 0.26时通过0.05显著性检验, 黑体标注为通过0.05显著性检验的相关系数 |
5.2 与关键环流系统的关系
表3 四个EOF主要模态时间系数与不同环流系统指数的相关Table 3 The correlation coefficient between four dominant EOF time coefficients and different atmospheric circulation system indices |
| SH | EATI | EATP | TPR1 | TPR2 | IBTI | |
|---|---|---|---|---|---|---|
| RPC1 RPC2 RPC3 RPC4 | -0.10 -0.64 0.34 0.10 | -0.14 0.24 -0.22 -0.10 | -0.14 0.02 -0.12 0.39 | 0.50 0.36 -0.22 -0.28 | 0.36 0.50 -0.42 -0.20 | 0.43 0.15 0.19 0.06 |
相关系数r= 0.26时通过0.05显著性检验, 黑体标注为通过显著0.05显著性检验的相关系数 |