

1 引言
2 资料和方法
2.1 资料
2.2 检验方法
3 CMA-GFS模式对环流形势的检验分析
3.1 检验结果的时间变化
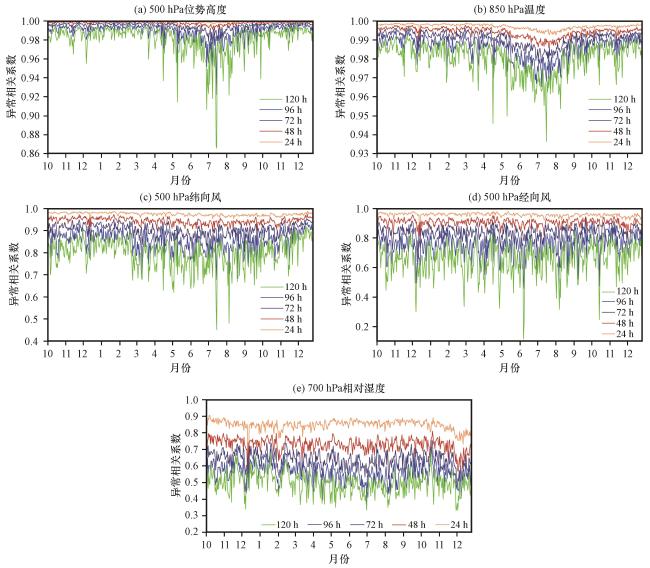
图1 2019年10月至2020年12月模式对500 hPa位势高度场(a)、 850 hPa温度场(b)、 500 hPa纬向风场(c)、 500 hPa经向风场(d)和700 hPa相对湿度场(e)24~120 h预报时效的异常相关系数的逐日变化Fig.1 Daily variation of anomaly correlation coefficients for geopotential height at 500 hPa (a), temperature at 850 hPa (b), zonal wind at 500 hPa (c), meridional wind at 500 hPa (d) and relative humidity at 700 hPa (e) for 24~120 hours from October 2019 to December 2020 |
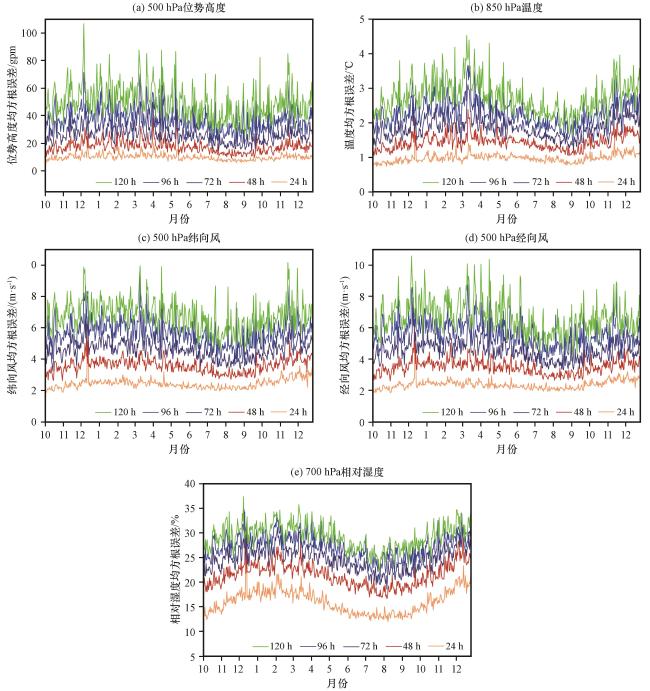
图2 2019年10月至2020年12月模式对500 hPa位势高度场(a)、 850 hPa温度场(b)、 500 hPa纬向风场(c)、 500 hPa经向风场(d)和700 hPa相对湿度场(e)24~120 h预报时效的均方根误差的逐日变化Fig.2 Daily variation of root mean square error for geopotential height at 500 hPa (a), temperature at 850 hPa (b), zonal wind at 500 hPa (c), meridional wind at 500 hPa (d) and relative humidity at 700 hPa (e) for 24~120 hours from October 2019 to December 2020 |
3.2 检验结果的空间分布
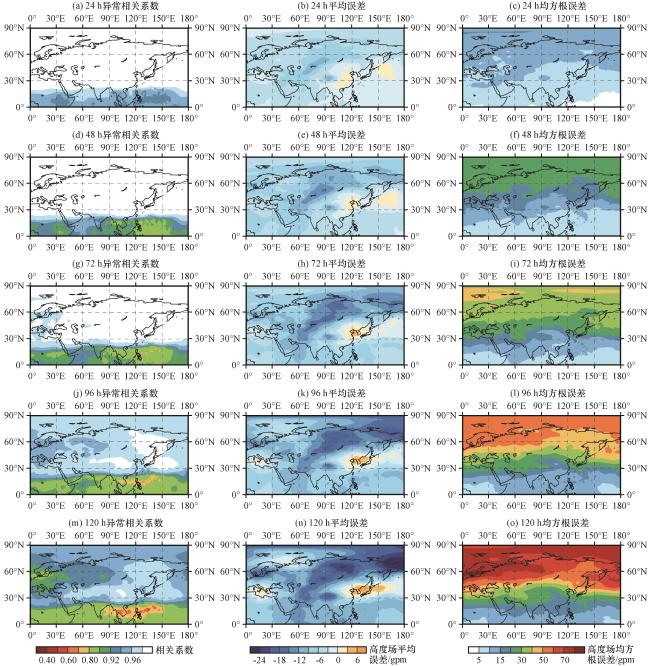
图3 24 h(a, b, c)、 48 h(d, e, f)、 72 h(g, h, i)、 96 h(j, k, l)及120 h(m, n, o)预报时效下500 hPa位势高度场的异常相关系数(左列)、 平均误差(中列)和均方根误差(右列)Fig.3 Anomaly correlation coefficients (left column), mean error (middle column) and root mean square error (right column) of geopotential height at 500 hPa for 24 hours (a, b, c), 48 hours (d, e, f), 72 hours (g, h, i), 96 hours (j, k, l) and 120 hours (m, n, o) |
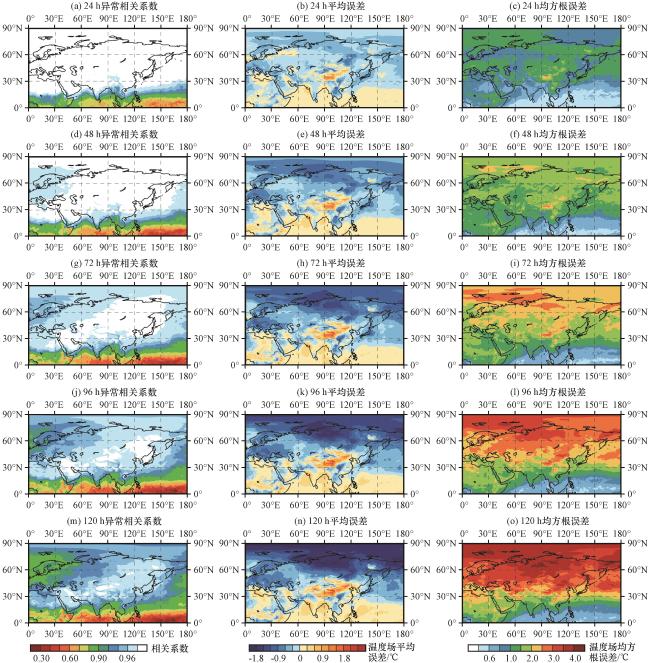
图5 24 h(a, b, c)、 48 h(d, e, f)、 72 h(g, h, i)、 96 h(j, k, l)及120 h(m, n, o)预报时效下850 hPa温度场的异常相关系数(左列)、 平均误差(中列)和均方根误差(右列)Fig.5 Anomaly correlation coefficients (left column), mean error (middle column) and root mean square error (right column) of temperature field at 850 hPa for 24 hours (a, b, c), 48 hours (d, e, f), 72 hours (g, h, i), 96 hours (j, k, l) and 120 hours (m, n, o) |

图6 24 h(a, b, c)、 48 h(d, e, f)、 72 h(g, h, i)、 96 h(j, k, l)及120 h(m, n, o)预报时效下500 hPa纬向风场的异常相关系数(左列)、 平均误差(中列)和均方根误差(右列)Fig.6 Anomaly correlation coefficients (left column), mean error (middle column) and root mean square error (right column) of zonal wind field at 500 hPa for 24 hours (a, b, c), 48 hours (d, e, f), 72 hours (g, h, i), 96 hours (j, k, l) and 120 hours (m, n, o) |
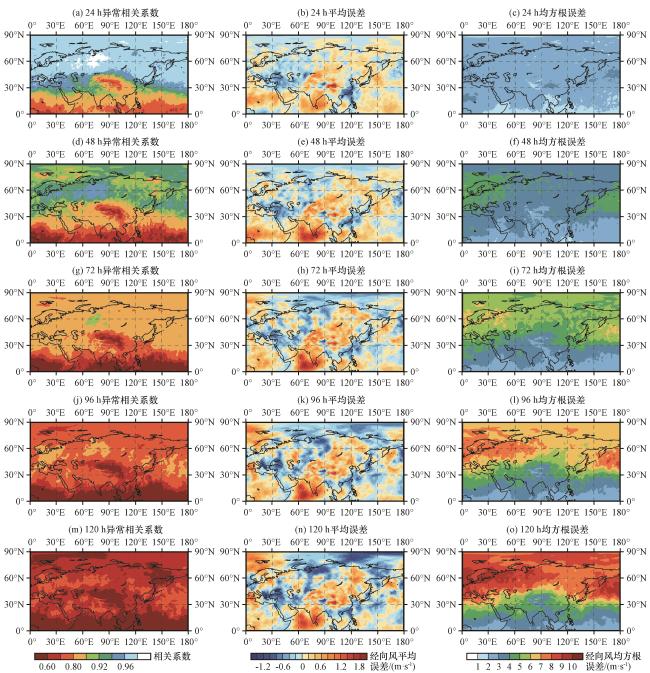
图7 24 h(a, b, c)、 48 h(d, e, f)、 72 h(g, h, i)、 96 h(j, k, l)及120 h(m, n, o)预报时效下500 hPa经向风场的异常相关系数(左列)、 平均误差(中列)和均方根误差(右列)Fig.7 Anomaly correlation coefficients (left column), mean error (middle column) and root mean square error (right column) of meridional wind field at 500 hPa for 24 hours (a, b, c), 48 hours (d, e, f), 72 hours (g, h, i), 96 hours (j, k, l) and 120 hours (m, n, o) |
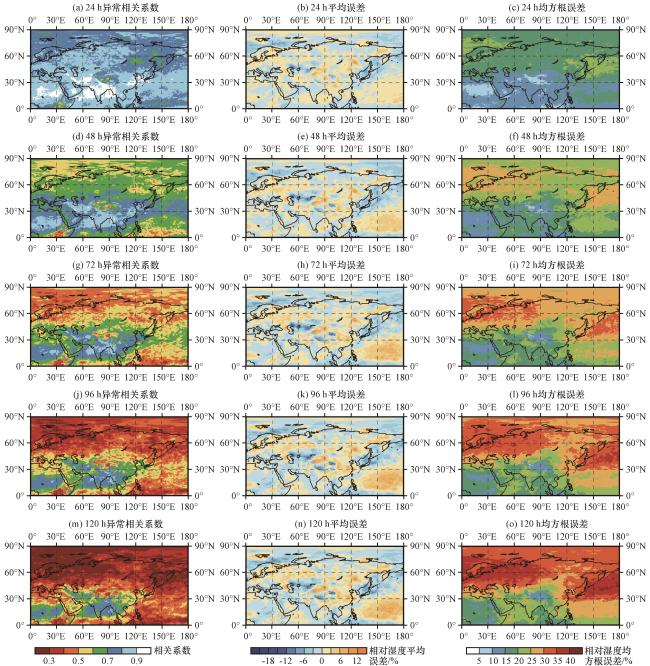


图8 24 h(a, b, c)、 48 h(d, e, f)、 72 h(g, h, i)、 96 h(j, k, l)及120 h(m, n, o)预报时效下700 hPa相对湿度场的异常相关系数(左列)、 平均误差(中列)和均方根误差(右列)Fig.8 Anomaly correlation coefficients (left column), mean error (middle column) and root mean square error (right column) of relative humidity field at 700 hPa for 24 hours (a, b, c), 48 hours (d, e, f), 72 hours (g, h, i), 96 hours (j, k, l) and 120 hours (m, n, o) |