
1 引言
2 资料来源与标准方法
2.1 降水量级的定义
2.2 螺旋度
3 结果分析
3.1 高原低涡切变影响云南大雨暴雨的气候特征
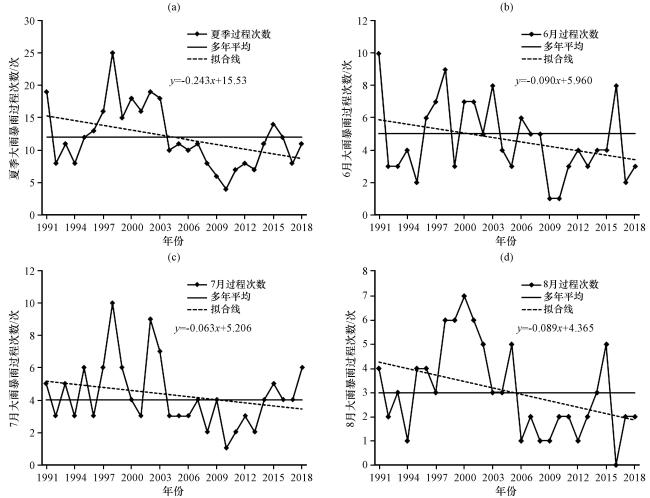
3.2 各月变化特征
3.3 降雨极值分布
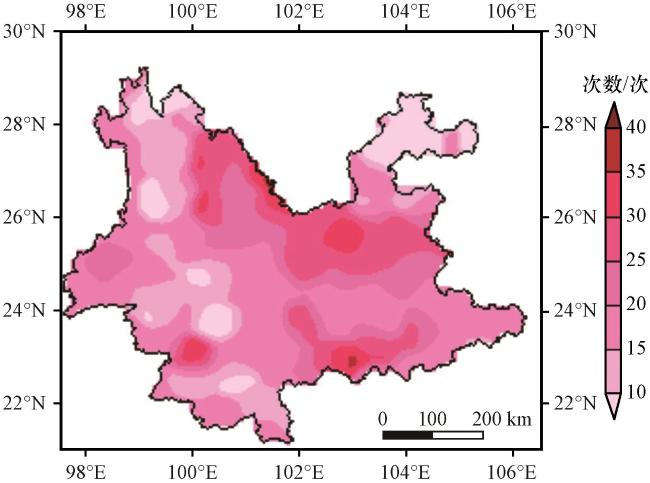
3.4 空间分布
4 高原低涡切变影响云南的典型流场及水汽输送特征
4.1 典型降水分布特征
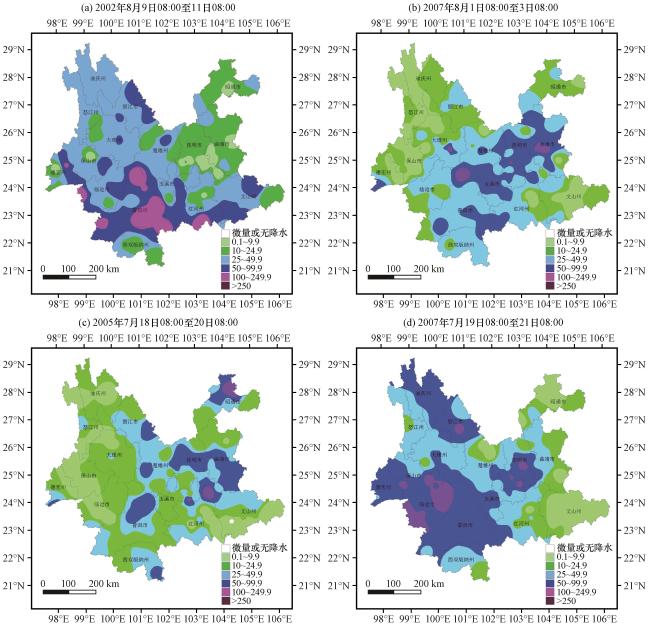
图3 高原低涡切变造成云南4个典型降水及其雨量分布(单位: mm)Fig.3 Four typical precipitation processes in Yunnan affected by Plateau vortex shear and its distribution characteristics (unit: mm).from 08:00 on 9 to 08:00 on 11 August 2002 (a), from 08:00 on 1 to 08:00 on 3 August 2007 (b), from 08:00 on 18 to 08:00 on 20 July 2005 (c), from 08:00 on 19 to 08:00 on 21 July 2007 (d) |
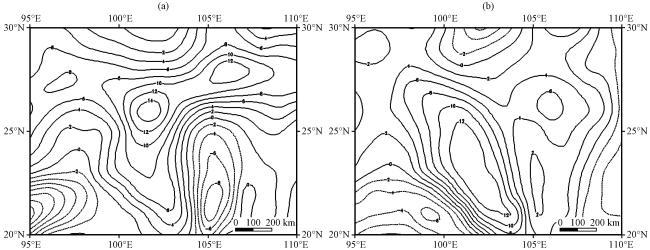
4.2 500 hPa流场
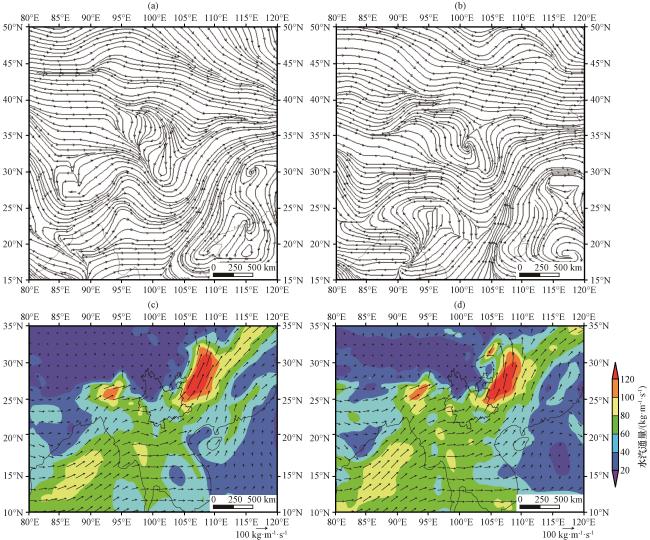
图4 过程开始前24 h(a, c)和12 h(b, d)500 hPa流场(a, b, 流线)、 775 hPa水汽通量矢量场(c, d, 矢量和彩色区, 单位: kg·m-1·s-1)Fig.4 The diagram of 24 h (a, c) and 12h (b, d) before the beginning of the process, 500 hPa flow field (a, b, stremline) and 775 hPa Vapor vector flux (c, d, vector and color area, unit: kg·m-1·s-1) |
4.3 水汽输送特征
5 典型个例分析
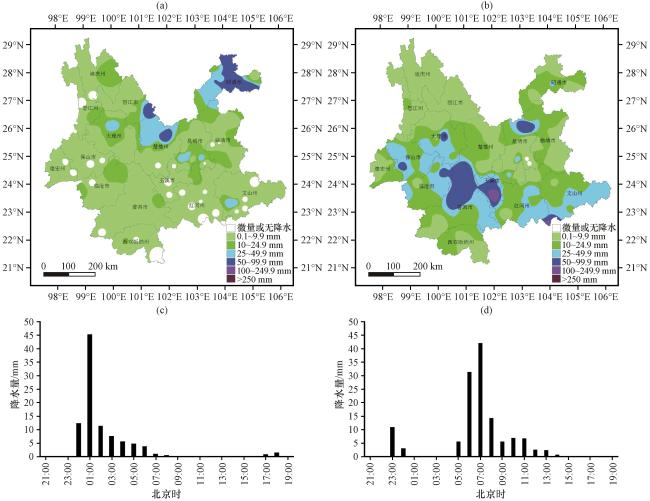
图5 2014年7月31日20:00至8月1日20:00(a)、 8月1日20:00至2日20:00(b)云南省降水量分布(单位: mm)及8月1日暴雨中心彝良(c)和2日大暴雨元江(d)逐小时降水量Fig.5 The cumulative Precipitation (unit: mm) distribution in Yunnan province from 20:00 on 31 July to 20:00 on 1 August (a) and from 20:00 on 1 to 20:00 on 2 August 2014 (b), the hourly precipitation distribution of the center of heavy rainfall over Yiliang on 1August (c) and over Yuanjiang on 2 August (d) 2014 |
5.1 高原低涡切变的环流形势
5.2 200 hPa环流场特征
5.3 物理量诊断分析
5.3.1 水汽条件
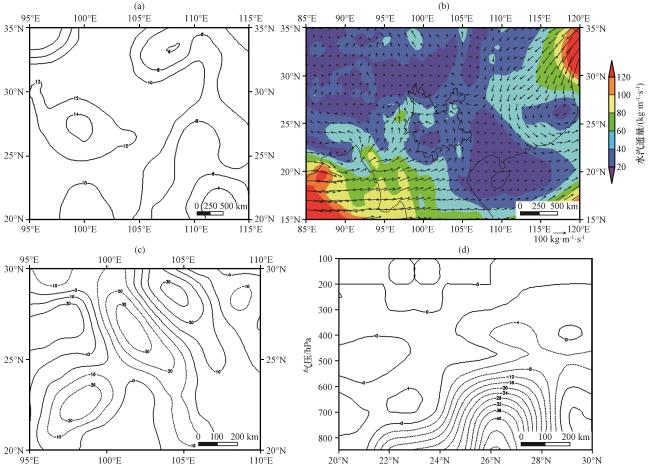
图7 2014年7月31日20:00 700 hPa比湿(a, 单位: g·kg-1)、 8月2日08:00水汽通量矢量图(b, 矢量和彩色区, 单位: kg·m-1·s-1)、 8月1日08:00水汽通量散度(c, 单位: ×10-8 g·cm-2·hPa-1·s-1)及其沿102°E的垂直剖面图(d, 单位: ×10-8 g·cm-2·hPa-1·s-1)Fig.7 700 hPa specific humidity at 20:00 on 31 July (a, unit: g·kg-1)、 vapor vector fluxat 08:00 on 2 August (b, vector and color area, unit: kg·m-1·s-1), divergence diagram of moisture flux at 08:00 on 1 August (c, unit: ×10-8 g·cm-2·hPa-1·s-1) in 2014 and its vertical section along 102°E (d, unit: ×10-8 g·cm-2·hPa-1·s-1) |
5.3.2 能量及稳定度条件
5.3.3 螺旋度分析
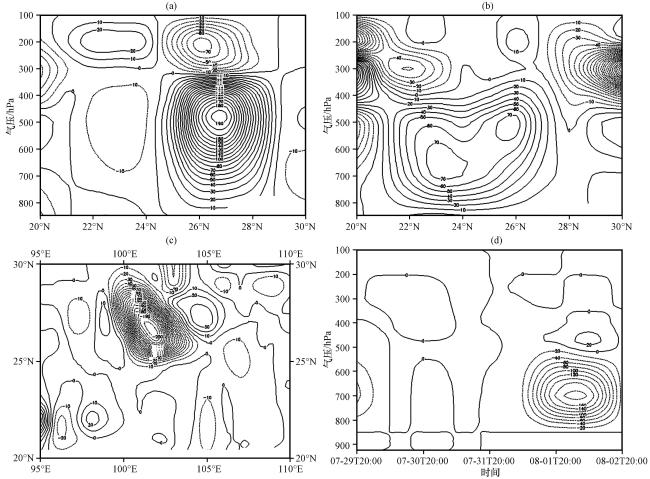
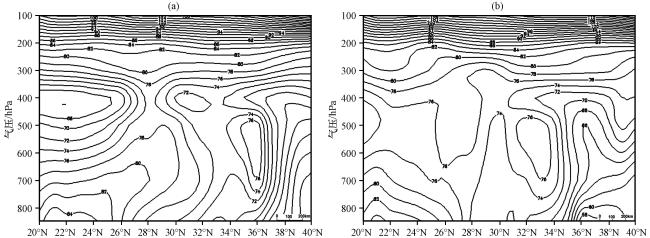
图9 2014年8月1日08:00(a)和2日08:00(b)螺旋度沿102°E的垂直剖面、 8月1日08:00 700 hPa湿螺旋度水平分布(c)及沿101°E, 25°N的时间-高度剖面(d)(单位: m·s-2)Fig.9 Helicity vertical profiles along 102°E at 08:00 on 1 (a) and 2 (b) August 2014, 700 hPa moist helicity horizontal distribution at 08:00 on 1 August (c) and the time-height profile along 101°E, 25°N (d).Unit: m·s-2 |