1 引言
2 资料方法和地形环境
2.1 资料来源
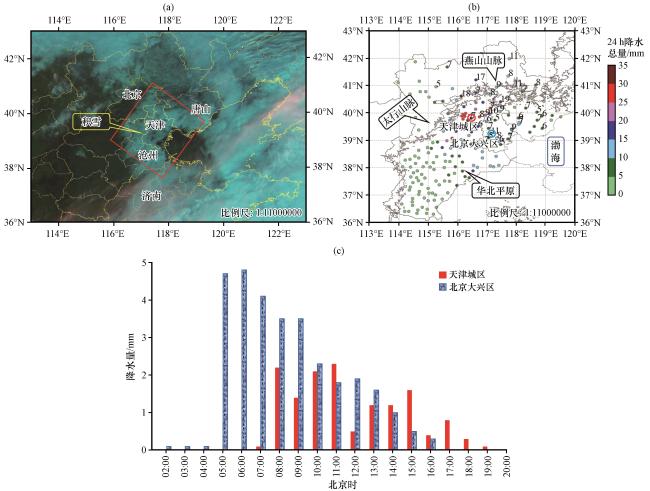
图1 2020年2月15日12:00 FY-4A真色彩云图(a, 方框为研究区); 地形和24 h(13日20:00至14日20:00)降水总量分布 (b); 天津城区站和北京大兴站小时降水量的时间序列(c)Fig.1 True color cloud image of FY-4A at 12:00 on 15 February 2020 (a, box represents the study area); The topography and the distribution of 24-h accumulated precipitation from 20:00 on 13 to 20:00 on 14 February 2020 (b); The time series of hourly precipitation at Tianjin urban station and Beijing Daxing station (c) |
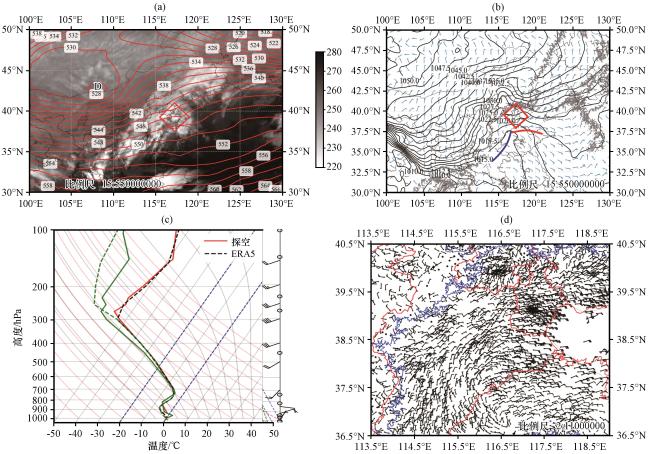
图2 2020年2月14日08:00(降雪时)500 hPa高空环流形势叠加同时刻FY-4A红外云图(a)和地面形势图(b); 北京54511站探空曲线(c, 实线源于实况, 虚线源于ERA5再分析资料)和加密的地面风场实况(d)方框为研究区域 Fig.2 The 500 hPa upper-air circulation situation superimposed with the FY-4A infrared cloud image (a) at 08:00 on 14 February 2020 (during snowfall); (b) surface synoptic chart at 08:00 (solid line is the isobaric line); (c) sounding curves for No.54511 station of Beijing at 08:00 (solid line is drawn according to the observation and dashed line is based on the ERA5 reanalysis data).The wind on ground from ground automatic weather observation station (d).The box is the study area |
2.2 锋生函数
2.3 地形环境
3 实况及大尺度背景
3.1 降雪实况
3.2 环流背景
4 PMDV的空间结构及其形成维持机制
4.1 PMDV的空间结构
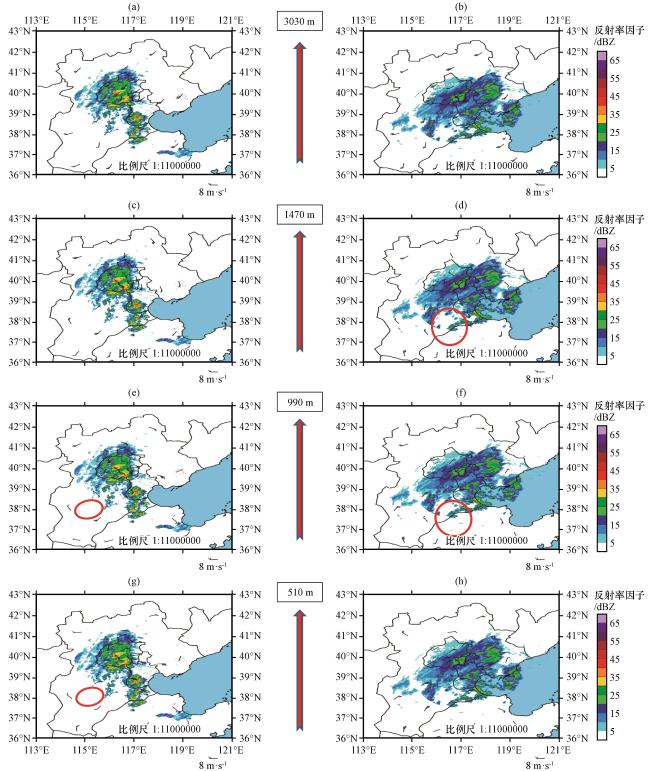
图3 2020年2月14日05:00和11:00在510 m(g、 h)、 990 m(e、 f)、 1470 m(c、 d)和3030 m(a、 b)各高度上的风场(风向, 单位: m·s-1)和同时刻雷达组合反射率(单位: dBZ)的叠加图环形表示PMDV Fig.3 Superposition chart of the wind field and the radar composite reflectivity at the heights of 510 m (g, h), 990 m (e, f), 1470 m (c, d) and 3030 m (a, b) at 05:00 (a) and 11:00 (b) on 14 February 2020.“O” denotes PMDV |
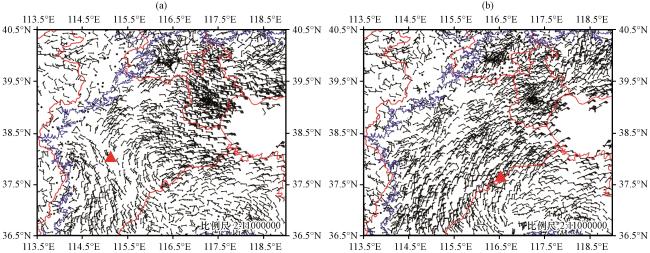
4.2 PMDV形成维持机制及其对降雪的影响
4.2.1 PMDV成因和维持机制
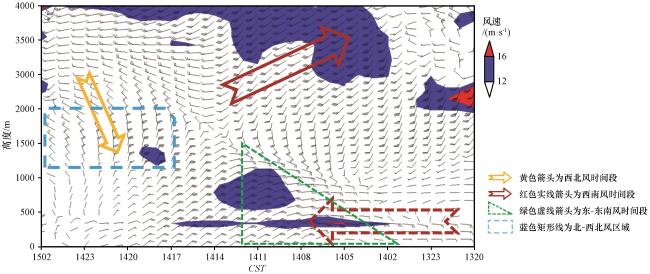
图5 2020年2月13日20:00至15日02:00天津静海站风廓线阴影区为风速超过12 m·s-1的区域 Fig.5 The time series of wind profile at Jinghai station from 20:00 on 13 to 02:00 on 15 February 2020.The shadeds are the areas with wind speed exceeding 12 m·s-1 |
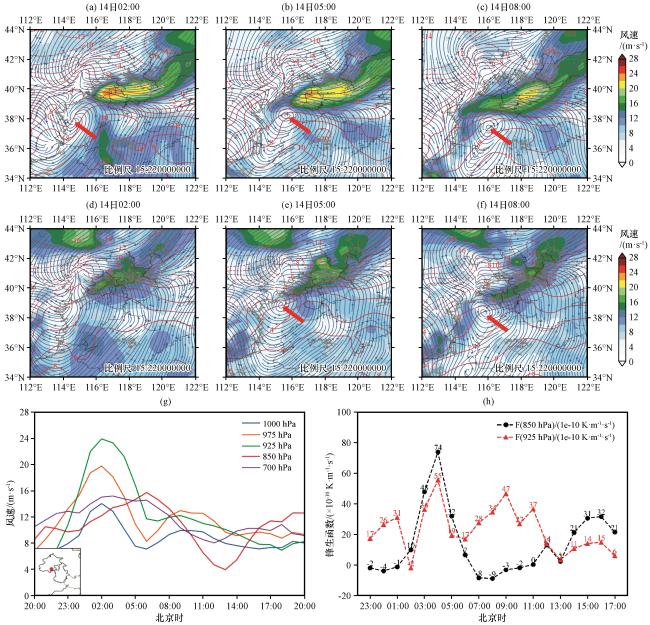
图6 2020年2月14日925 hPa (a, b, c)和850 hPa (d, e, f)的风场流线(蓝色流线)、 温度(红色线)和全风速(阴影).不同高度上的风速随时间变化(红点为参考点, g).PMDV中心在925 hPa和850 hPa锋生函数的时间序列(h)箭头指示PMDV中心 Fig.6 Wind field (blue line), temperature (red line) and full wind speed (shaded) at 925 hPa (a, b, c) and 850 hPa (d, e, f) on 14 February 2020, and (g) time series of wind speed at various heights above the station (red dot in the small map at the lower left corner).The time series of frontogenesis function at 925 hPa and 850 hPa at PMDV center position (h).The arrow point PMDV center |
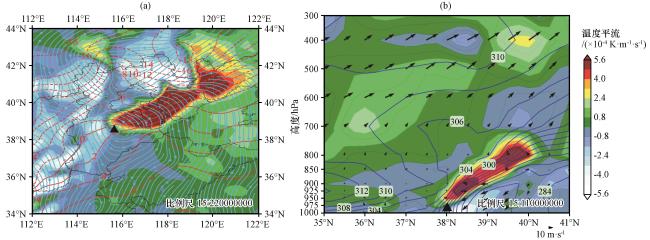
图7 850 hPa上温度平流(阴影)与流场(a); 沿PMDV中心假相当位温(蓝色实线, 单位: K)和温度平流(阴影, 单位: ×10-4 K·m-1·s-1)的径向剖面(b)方框为研究区域 Fig.7 The temperature advection (shadow) and flow field at 850 hPa at 08:00 on 14 February 2020 (a); the meridional cross-section of pseudo-equivalent potential temperature (blue solid line, unit: K) and temperature advection (shadow, unit: ×10-4 K·m-1·s-1) along the center of PMDV (b).The triangle marks the study area |
4.2.2 PMDV对研究区降雪的影响
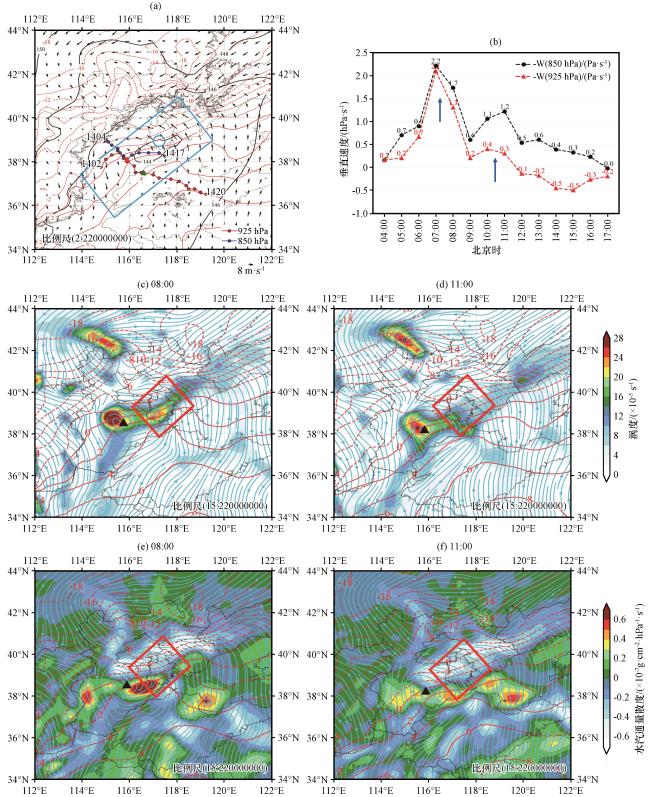
图8 PMDV移动轨迹(蓝点和红点分别在850 hPa和925 hPa上, 红色和绿色三角分别为11:00 PMDV在850 hPa和925 hPa上的位置(a).天津城区自14日04:00 -17:00分别 850 hPa和925 hPa上升速度随时间变化(单位: hPa·s-1)(b).14日08:00和11:00 850 hPa涡度(c和d, 阴影, 单位: ×10-5 s-1)和水汽通量散度(e和f, 阴影, 单位: ×10-7 g·cm-2·hPa-1·s-1)以及温度等值线(红色线, 单位: ℃)和流场(蓝色流线)三角标注为PMDV中心位置, 方框为研究区域, 圆圈为天津城区站Fig.8 The moving trajectory of PMDV center.The blue dot is at 850 hPa and the red point at 925 hPa (a).The red and green triangles represent the PMDV location at 850 hPa and 925 hPa at 11:00, respectively; (b) the time series of hourly vertical velocity at 850 hPa (black) and at 925 hPa (red) at Tianjin urban statoin; The vorticity (c, d, shadow, unit: ×10-5 s-1) and the water vapor flux divergence (e, f, shadow, unit: ×10-7 g·cm-2·hPa-1·s-1) and the temperature (red line, unit: ℃) and flow field (blue line) at 850 hPa at 08:00 (c, e) and 11:00 (d, f) on 14 February 2020, respectively.The triangle marks the center of PMDV and the box is the study area and cycle is Tianjin urban station |
5 多股气流水汽输送及净流入
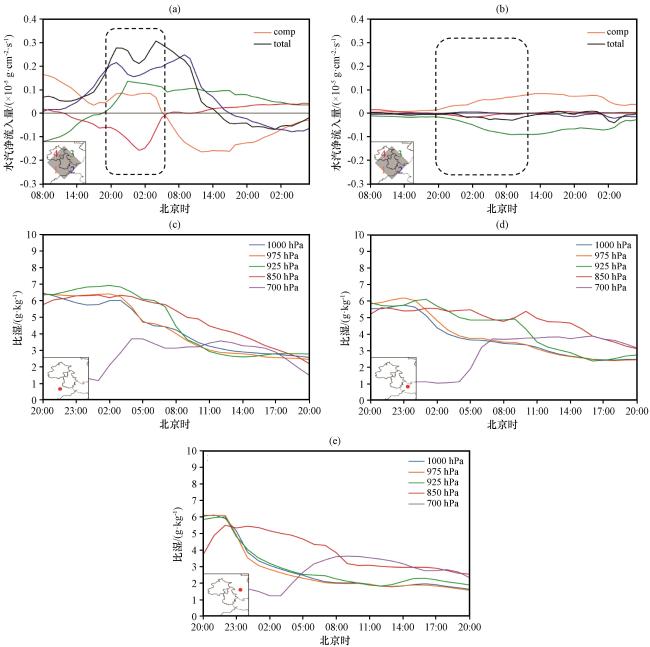
图9 1000~850 hPa(a)和700~500 hPa(b)高度层上气流经过研究区四周边界的水汽通量变化; 在西南(c)、 东南(d)、 东北(e)边界不同高度上的比湿时间序列左下小图红点为参照点Fig.9 Changes in water vapor flux of airflows in 1000~850 hPa (a) and 700~500 hPa (b) passing through the boundaries of the blizzard area, time series of specific humidity at various altitudes in the southeast (c), southeast (d), and northeast (e).The red dot in the small map at the lower left corner is the reference point |