1 引言
2 研究区域及资料方法
2.1 研究区域
2.2 资料来源
表1 CMIP6 模式信息Table 1 CMIP6 Mode Information |
| 模式 | 国家 |
|---|---|
| ACCESS-CM2 | 澳大利亚 |
| ACCESS-ESM1-5 | 澳大利亚 |
| CanESM5 | 加拿大 |
| CanESM5-1 | 加拿大 |
| CESM2-WACCM | 美国 |
| EC-Earth3-CC | 欧盟 |
| NorESM2-LM | 挪威 |
| MPI-ESM1-2-HR | 德国 |
| MPI-ESM1-2-LR | 德国 |
| MIROC6 | 日本 |
| MIROC6-1 | 日本 |
| MRI-ESM2-0 | 日本 |
| BCC-CSM2-MR | 中国 |
2.3 方法
2.3.1 环流协同指数
2.3.2 集合经验模态分解方法
2.3.3 其他方法
3 结果分析
3.1 温度与降水的平均空间特征
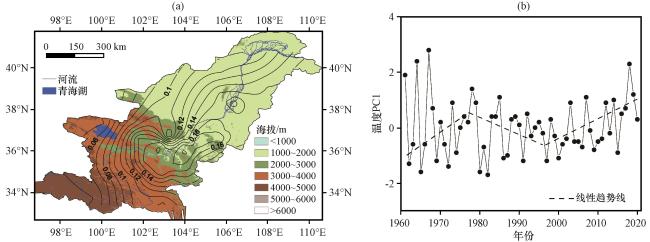
3.2 温度与降水的异常空间分布
表2 年平均温度EOF分解前10个模态方差贡献Table 2 Variance contributions of the top 10 modes of EOF decomposition of annual mean temperature |
| 方差贡献 | EOF1 | EOF2 | EOF3 | EOF4 | EOF5 | EOF6 | EOF7 | EOF8 | EOF9 | EOF10 |
|---|---|---|---|---|---|---|---|---|---|---|
| 方差贡献/% | 83.50 | 6.12 | 3.21 | 1.73 | 1.05 | 1.01 | 0.54 | 0.40 | 0.33 | 0.25 |
| 累计方差贡献/% | 83.50 | 89.62 | 92.83 | 94.56 | 95.61 | 96.62 | 97.12 | 97.52 | 97.85 | 98.10 |
表3 年降水量EOF分解前10个模态方差贡献Table 3 Variance contributions of the top 10 modes of EOF decomposition of annual precipitation |
| 方差贡献 | EOF1 | EOF2 | EOF3 | EOF4 | EOF5 | EOF6 | EOF7 | EOF8 | EOF9 | EOF10 |
|---|---|---|---|---|---|---|---|---|---|---|
| 方差贡献/% | 42.40 | 10.38 | 8.97 | 5.07 | 4.42 | 3.03 | 2.32 | 2.02 | 1.85 | 1.76 |
| 累计方差贡献/% | 42.40 | 52.78 | 61.75 | 67.82 | 72.24 | 75.27 | 77.59 | 79.61 | 81.46 | 83.22 |
3.3 温度与降水的多时间尺度变化特征
表4 年平均温度的不同时间尺度变化贡献率Table 4 Contribution rates of changes in different time scales of annual mean temperature |
| 贡献率和周期 | IMF1 | IMF2 | IMF3 | IMF4 | Trend |
|---|---|---|---|---|---|
| 贡献率/% | | | | | |
| 周期/a | | | | | |
-表示无数据 |
表5 年降水量的不同时间尺度变化贡献率Table 5 Contribution rates of changes in different time scales of annual precipitation |
| 贡献率和周期 | IMF1 | IMF2 | IMF3 | IMF4 | IMF5 |
|---|---|---|---|---|---|
| 贡献率/% | | | | | |
| 周期/a | | | | | |
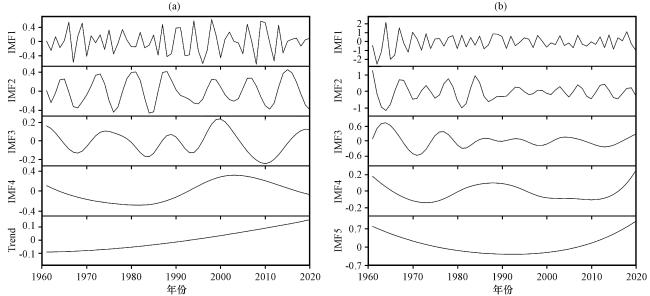
3.4 温度与降水的空间动态变化特征
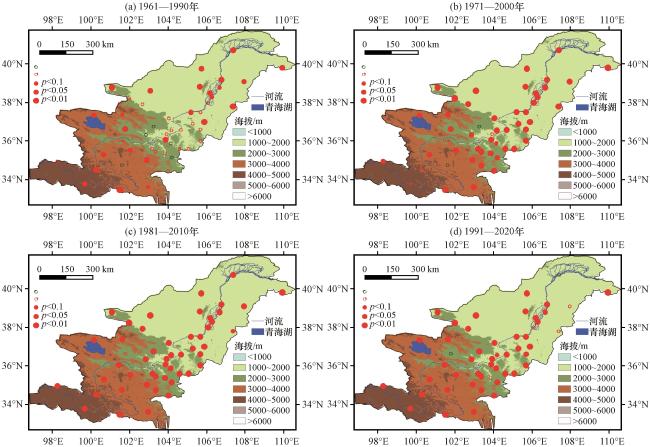
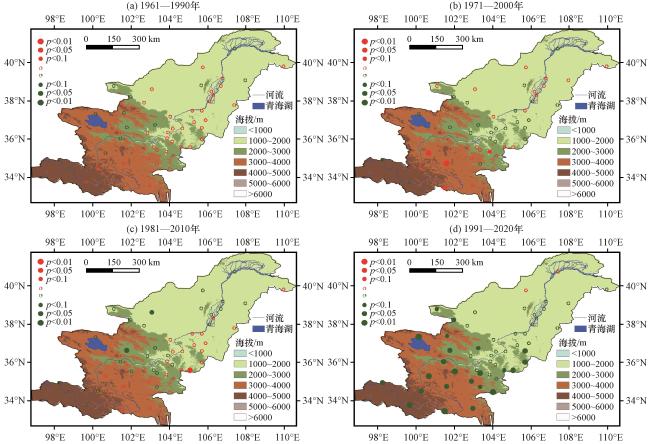
3.5 暖湿化趋势的成因探讨
表6 年降水与环流指数相关系数Table 6 Correlation coefficient between annual precipitation and circulation index |
| 时间尺度 | 西风 | 东亚夏季风 | 南亚夏季风 | 协同环流指数 |
|---|---|---|---|---|
| 年际 | -0.038 | -0.059 | 0.33** | |
| 年代际 | -0.78*** | 0.16 | 0.31* | 0.79*** |
| 多年代际 | 0.64*** | 0.69*** | -0.22 | 0.73*** |
*、 **、 ***分别表示通过0.05、 0.01、 0.001显著性水平检验 |
3.6 未来暖湿化趋势预估
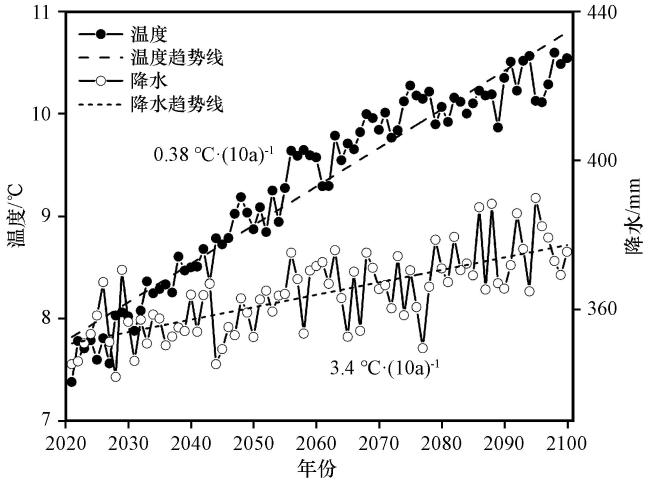
3.7 暖湿化对生态植被的影响
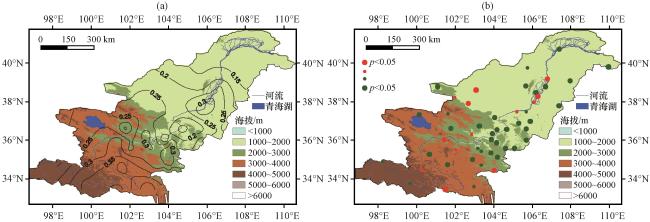
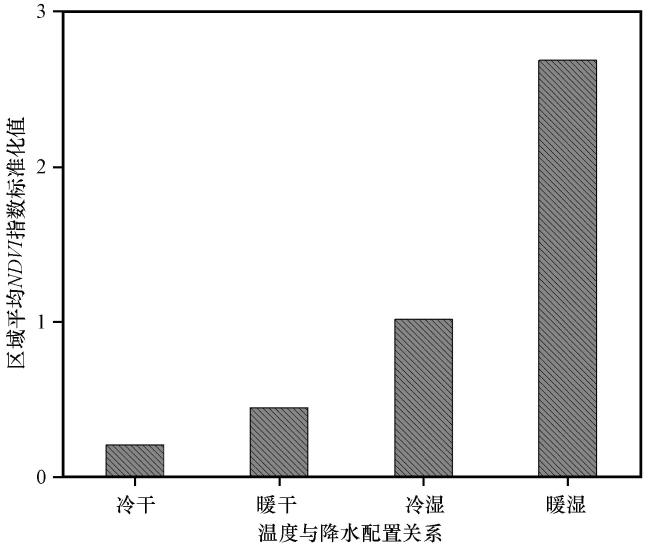
图9 黄河上游2000 -2020年NDVI平均值(a, 等值线)及趋势变化(b, 圆点)空间分布NDVI变化红色圆点为减少、 绿色圆点为增加 Fig.9 Spatial distribution of average (a, contour) and trend change (b, dot) of NDVI in the upper Yellow River from 2000 to 2020.Red dot indicates the trend change of NDVI is decrease, and green dot indicates increase |
表7 2000 -2020年黄河上游平均温度和降水与同期及滞后3个月的NDVI指数逐月相关系数Table 7 Month-by-month correlation coefficients between the average temperature and precipitation in the upper Yellow River from 2000 to 2020 and the NDVI index for the same period and 3 months lag |
| 气象要素 | 同期 | 滞后1月 | 滞后2月 | 滞后3月 |
|---|---|---|---|---|
| 温度 | 0.18** | 0.16* | 0.13* | 0.09 |
| 降水 | 0.28*** | 0.13* | 0.03 | -0.06 |
*、 **、 ***分别表示通过0.05、 0.01、 0.001的显著性水平检验 |