
1 引言
2 资料简介和试验方案设计
2.1 资料简介
2.2 试验方案设计
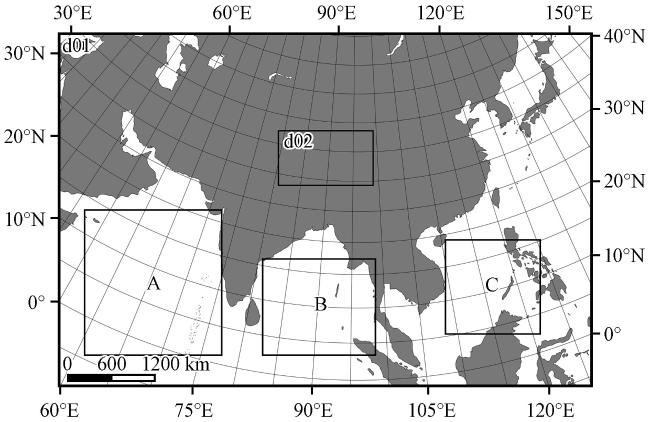
图1 数值模拟试验的模拟区域和水汽源地范围框区d01、 d02分别表示第一、 第二层区域, 框区A为阿拉伯海源地, B为孟加拉湾源地, C为南海源地 Fig.1 The simulation areas and water vapor sources in numerical simulation test.d01 and d02 mean respectively the first and second simulation area.Frame A is the water vapor source range of the Arabian Sea, B is the water vapor source range of the Bay of Bengal, C is the water vapor source range of the South China Sea |
表1 3组敏感性试验水汽改变范围的选取Table 1 Selection of water vapor range in three sensitivity test |
| 试验名称 | 水汽条件改变范围 |
|---|---|
| 敏感性试验1 | 阿拉伯海源地( |
| 敏感性试验2 | 孟加拉湾源地( |
| 敏感性试验3 | 南海源地( |
表2 水汽源地垂直方向水汽条件改变的比值设置Table 2 Setting the relative humidity decreasing ratio in the vertical direction over the water vapor source |
| 垂直层次 | 修改后相对湿度占原相对湿度比值 |
|---|---|
| 1000~850 hPa | 30% |
| 850~700 hPa | 40% |
| 700~500 hPa | 50% |
| 500~300 hPa | 60% |
| 300~100 hPa | 70% |
| 100 hPa以上 | 100% |
2.3 降水过程概况
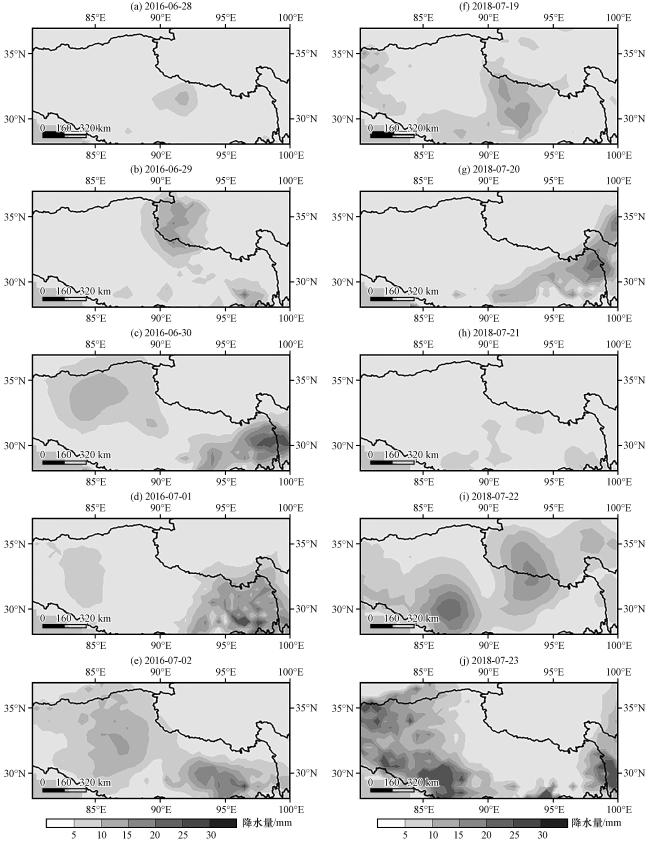
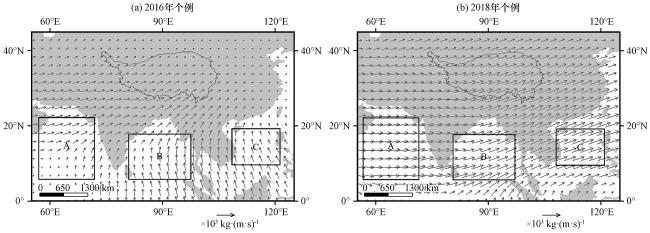
图3 2016年个例(a)和2018年个例(b)亚洲大陆5天平均整层水汽通量(矢量, 单位: ×103 kg·m-1·s-1)分布框区A为阿拉伯海源地, B为孟加拉湾源地, C为南海源地 Fig.3 Distribution of daily mean whole-layer water vapor flux (vector, unit: ×103 kg·m-1·s-1) in East Asia in Case 2016 (a) and Case 2018 (b).Frame A is the water vapor source range of the Arabian Sea, B is the water vapor source range of the Bay of Bengal, C is the water vapor source range of the South China Sea |
3 模拟结果分析
3.1 降水空间分布分析
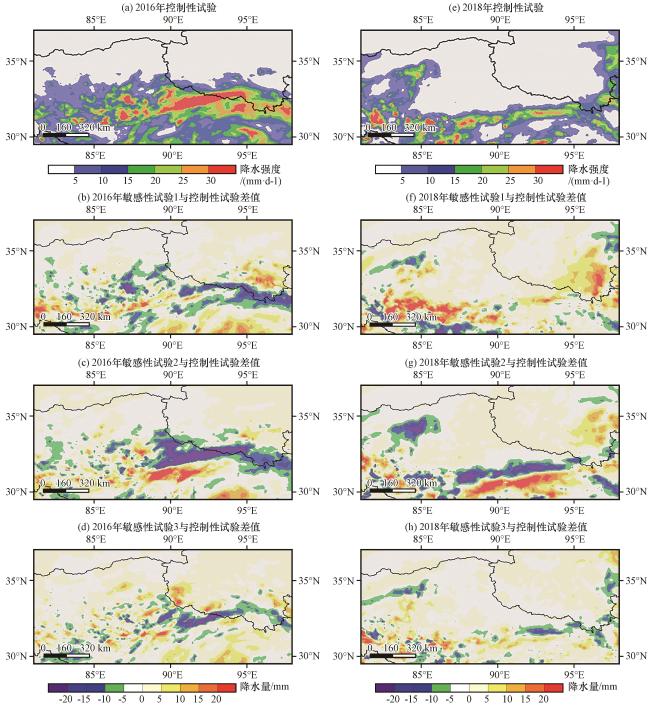
图4 2016年7月2日(左)和2018年7月23日(右)高原地区控制性试验降水量和控制性试验-敏感性试验降水量差值的空间分布(单位: mm)Fig.4 Spatial distribution of the simulated precipitation in the control experiment and the difference between three sensitivity experiments and the control experiment over the Qinghai-Xizang (Tibet) Plateau on 2 July 2016 (left) and 23 July 2018 (right).Unit: mm |
3.2 环流形势分析
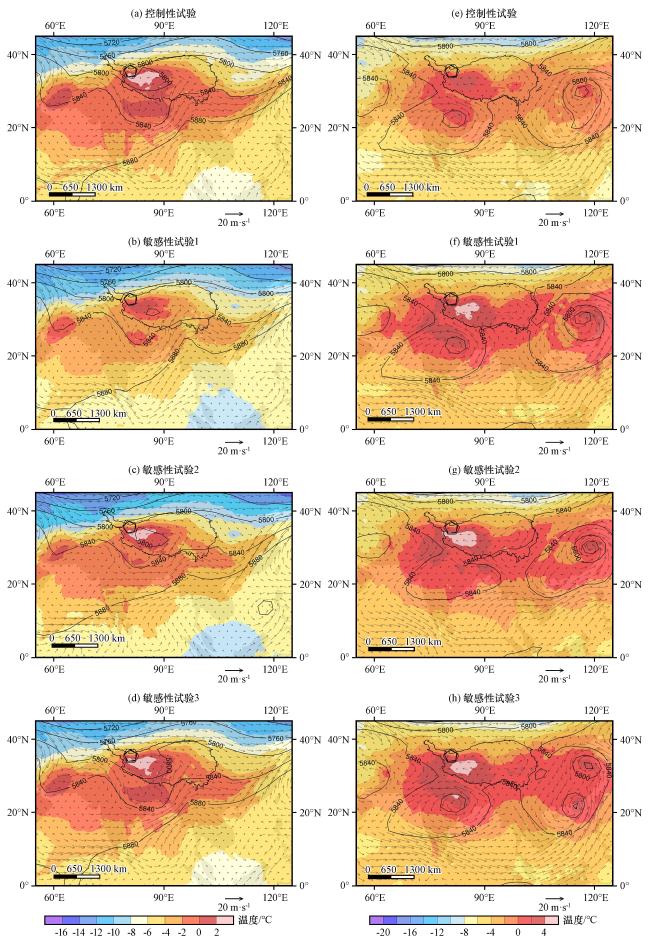
图5 2016年7月2日(左)和2018年7月23日(右)东亚地区500 hPa高度场(等值线, 单位: gpm)、 温度场(彩色区, 单位: ℃)和风场(矢量, 单位: m·s-1)分布Fig.5 Distribution of height field (contour, unit: gpm), temperature field (color area, unit: °C) and wind field (vector, unit: m·s-1) on 500 hPa in East Asia on 2 July 2016 (left) and on 23 July 2018 (right) |
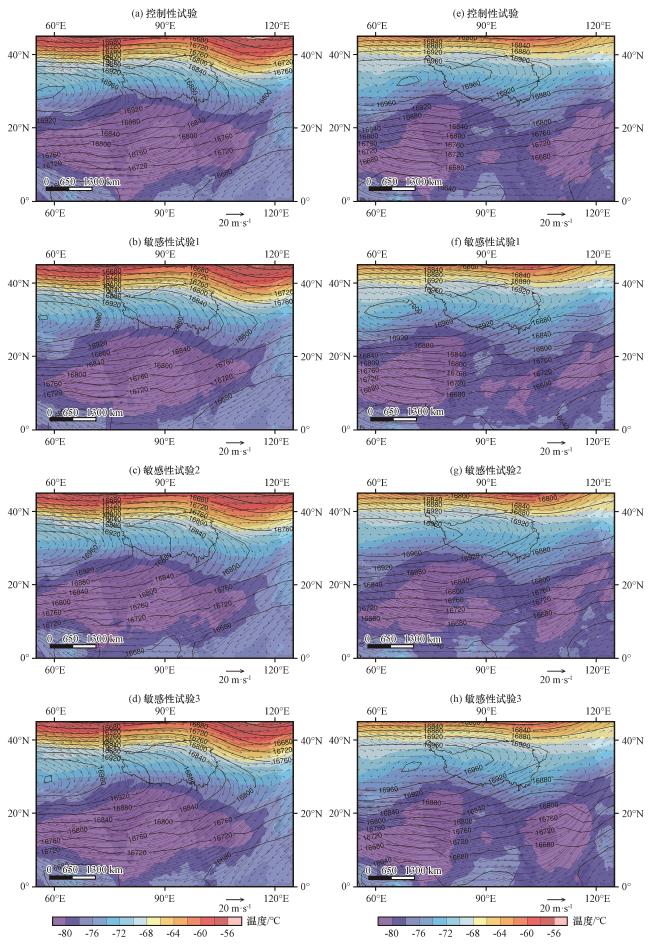
图6 2016年7月2日(左)和2018年7月23日(右)东亚地区100 hPa高度场(等值线, 单位: gpm)、 温度场(彩色区, 单位: ℃)和风场(矢量, 单位: m·s-1)分布Fig.6 Distribution of height field (contour, unit: gpm), temperature field (color area, unit: °C) and wind field (vector, unit: m·s-1) on 100 hPa in East Asia on 2 July 2016 (left) and on 23 July 2018 (right) |
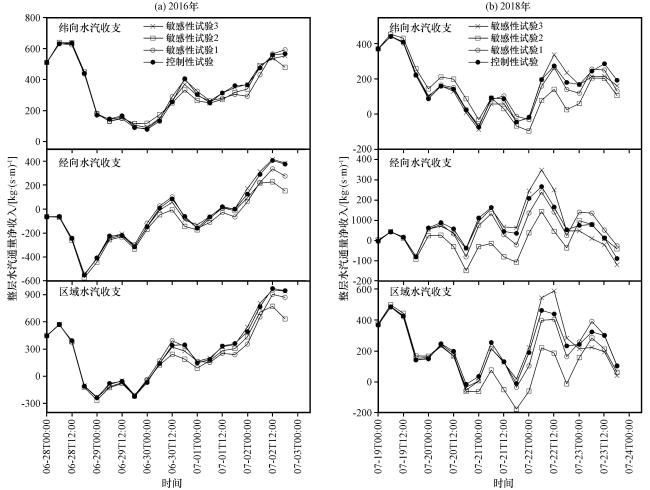
3.3 水汽通量及其散度分析
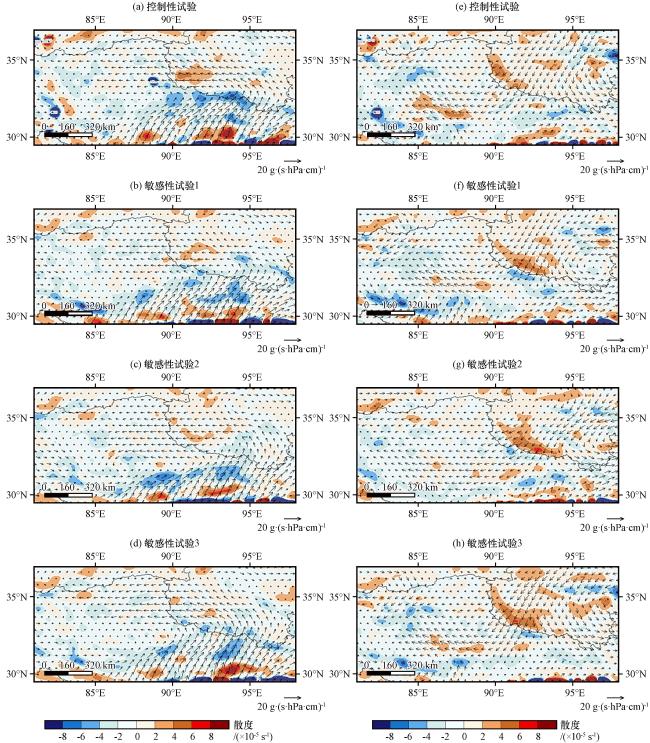
图7 2016年7月2日(左)和2018年7月23日(右)高原地区500 hPa水汽通量(矢量, 单位: g·s-1·hPa-1·cm-1)及其散度(彩色区, 单位: ×10-5 s-1)分布Fig.7 Distribution of water vapor flux (vector, unit: g·s-1·hPa-1·cm-1) and its divergence (color shadow, unit: ×10-5 s-1) on 500 hPa over the Qinghai-Xizang (Tibet) Plateau on 2 July 2016 (left) and on 23 July 2018 (right) |