

1 引言
2 资料来源与方法介绍
2.1 资料来源
2.2 方法介绍
3 极端强降水概况
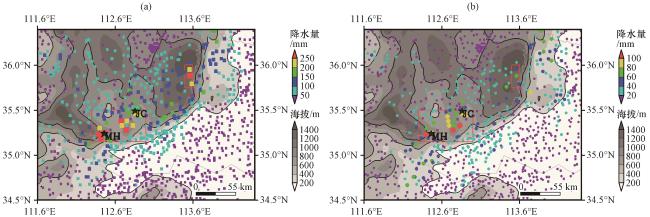
图1 2021年7月11日04:00 -16:00累计降水量(a, 彩色区)和小时最大降水量(b, 彩色区)散点分布(单位: mm)灰色阴影为地形高度场, 黑色等值线分别为200 m、 600 m和1000 m的等高度线, ★代表强降水中心和晋城站, 其中“JC”代表晋城站, “MH”代表阳城蟒河景区站 Fig.1 Scatter map of accumulated rainfall (a, color area) and hourly maximum rainfall (b, color area) from 04:00 to16:00 on 11 July 2021. Unit: mm. Terrains shaded in gray, with the contours of 200, 600, and 1000-metre elevations. Black five-pointed stars (★) are positions of heavy rainfall center and Jincheng station, while “JC” and “MH” represent Jincheng and Manghe Scenic Area station, respectively |
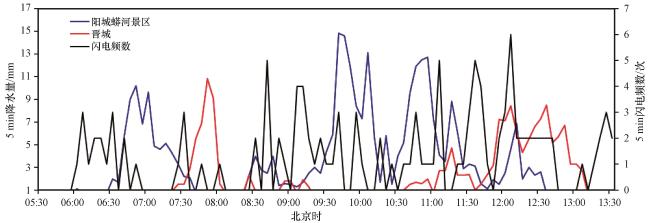
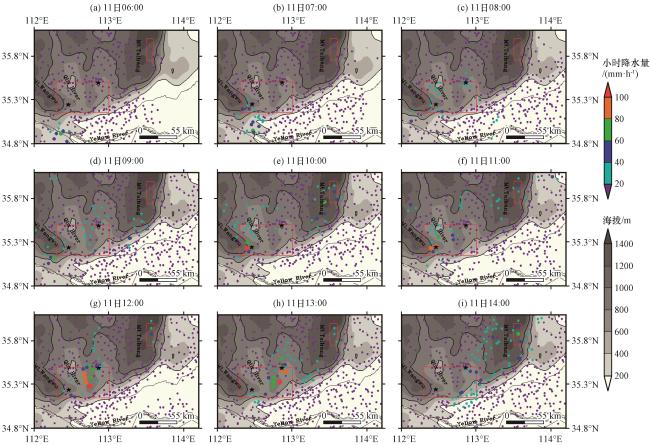
图3 2021年7月11日06:00 -14:00逐小时降水(单位: mm·h-1)空间演变与地形图(阴影, 单位: m)黑色线为200 m、 600 m、 1000 m等地形高度线; 左边和右边★分别代表强降水中心蟒河景区和晋城站 Fig.3 Hourly precipitation spatial evolution (unit: mm·h-1) and topographic map (shaded, unit: m) from 06:00 to 14:00 on 11 July 2021. The black contours are 200, 600, and 1000-metre elevations. The left and right black five-pointed stars (★) are positions of heavy rainfall center (Manghe Scenic Area station) and Jincheng station, respectively |
4 宏观结构特征分析
4.1 环流背景及高低空流型配置
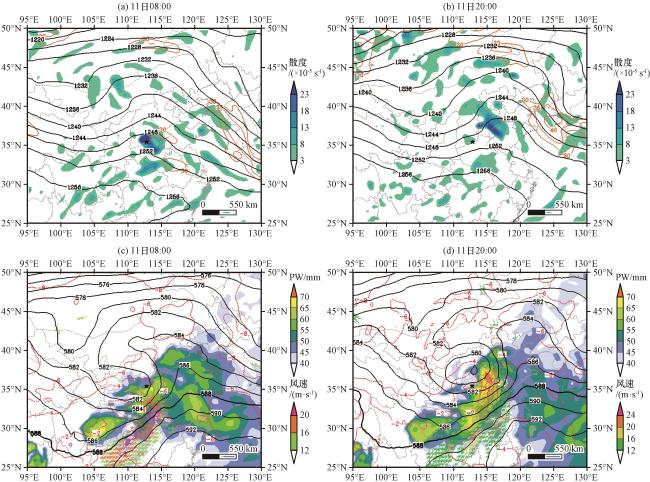
图4 2021年7月11日200 hPa位势高度场(黑色实线, 单位: dagpm)、 辐散场(彩色区, 单位: ×10-5 s-1)、 高空急流(全风速≥30 m·s-1, 黄色实线)(a, b)和500 hPa位势高度场(黑色实线, 单位: dagpm)、 温度场(红色点线, 单位: ℃)、 850 hPa低空急流(风羽, 单位: m·s-1)、 整层大气可降水量PW(彩色区, 单位: mm)(c, d)★代表晋城站 Fig.4 The geopotential height (black line, unit: dagpm), convergence filed (color area, unit: ×10-5 s-1), high-level jet (full wind speed ≥ 30 m·s-1, yellow line) at 200 hPa (a, b), and the geopotential height (black line, unit: dagpm), temperature filed (red dotted line, unit: ℃) at 500 hPa, 850 hPa low-level jet (barb, unit: m·s-1), precipitable water of the whole layer (color area, unit: mm) (c, d) on 11 July 2021. The five-pointed stars (★) is Jincheng station position |
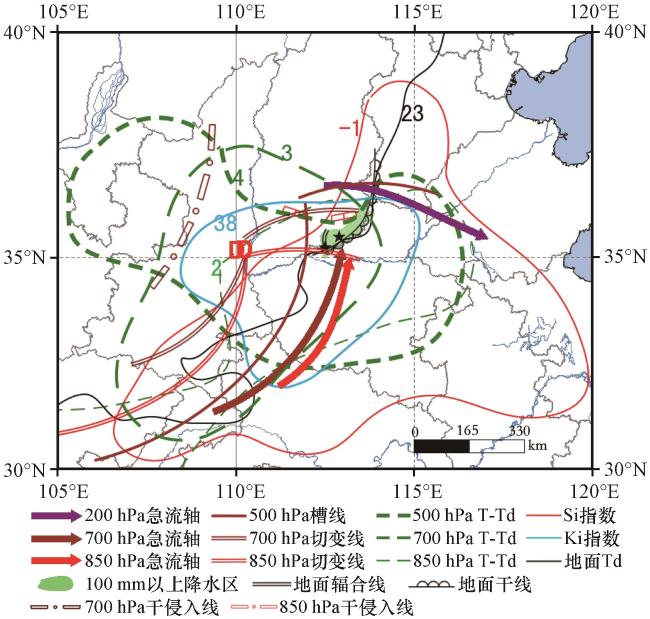
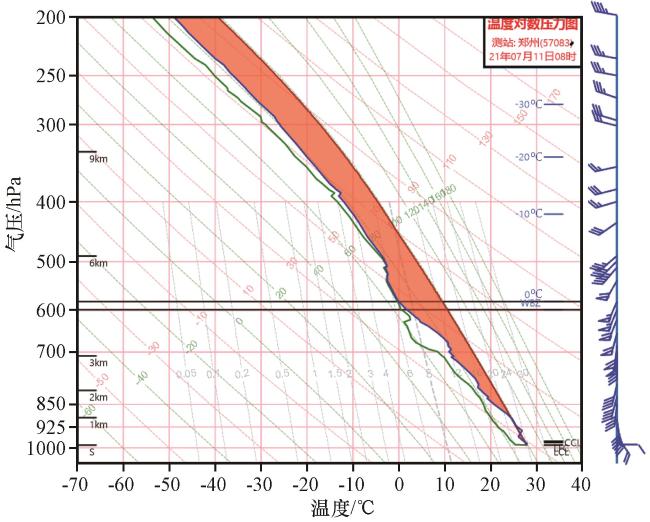
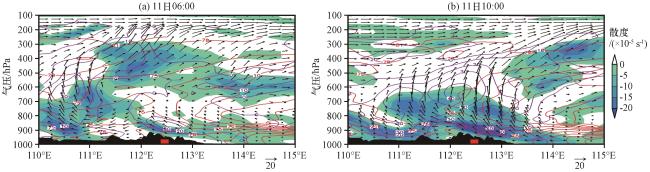
图7 2021年7月11日沿35.25°N散度(彩色区, 单位: ×10-5 s-1)、 涡度(紫色实线, 单位: ×10-5 s-1)、 假相当位温(红色实线, 单位: ℃)、 风场(矢量, u, 单位: m·s-1; w×0.1, 单位: ×0.1 Pa·s-1)的纬向垂直剖面 Fig.7 Vertical cross sections of divergence (color area, unit: ×10-5 s-1), vorticity (purple line, unit: ×10-5 s-1), pseudo equivalent potential temperature (red line, unit: ℃), wind filed (vector, u, unit: m·s-1; w×0.1, unit: ×0.1 Pa·s-1) along 35.25°N on 11 July 2021. |
 为极端强降水中心蟒河景区位置
 is heavy rainfall center ( Manghe Scenic Area station) position
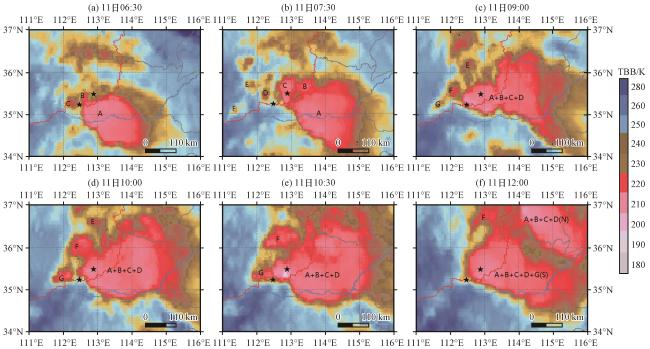
4.2 中 α 和中 β 尺度特征
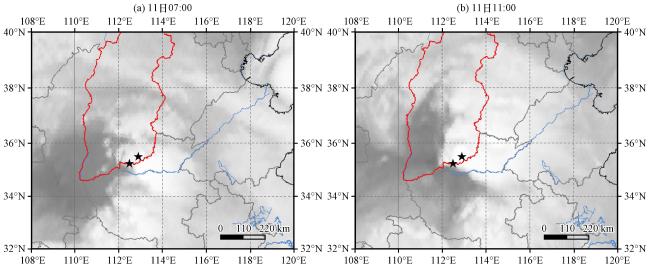
4.3 低涡暖切变云系上的中 γ 尺度特征
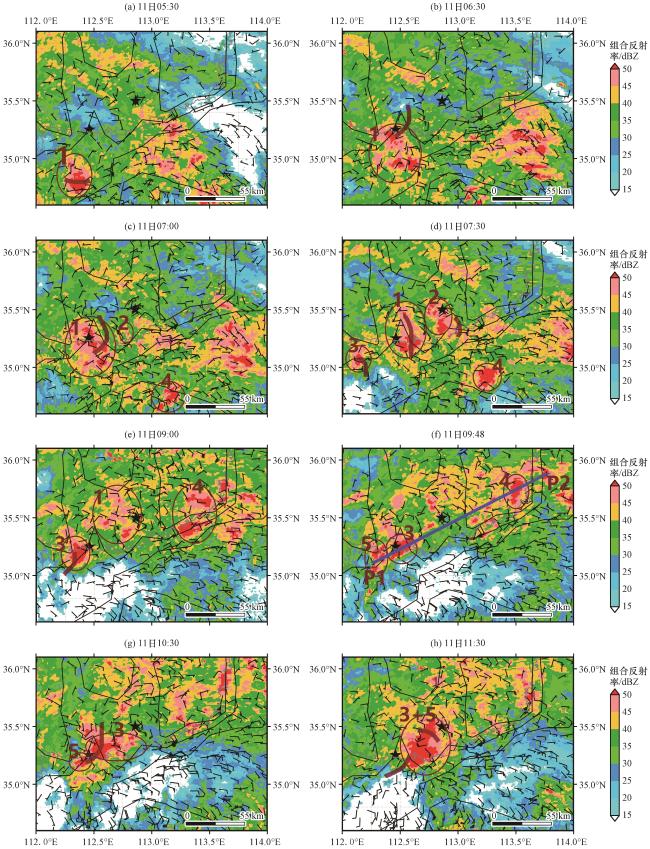
图10 2021年7月11日05:30 -11:30组合反射率因子(彩色区, 单位: dBZ)与地面自动站风场(风羽, 单位: m·s-1)黑色等值线分别为200 m、 600 m和1000 m的等地形高度线, 棕色线为地面切变线和辐合线 Fig.10 Radar combined reflectivity (color area, unit: dBZ) and wind field of ground automatic stations (barb, unit: m·s-1) from 05:30 to 11:30 on 11 July 2021. The black contours are 200, 600, and 1000 m elevations, and brown lines are surface shear lines and convergence lines |
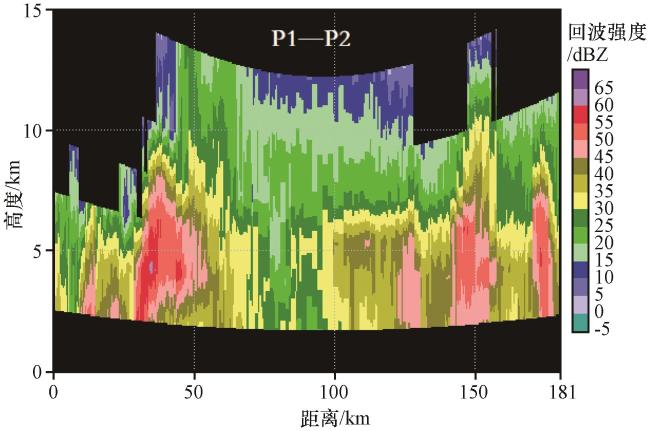
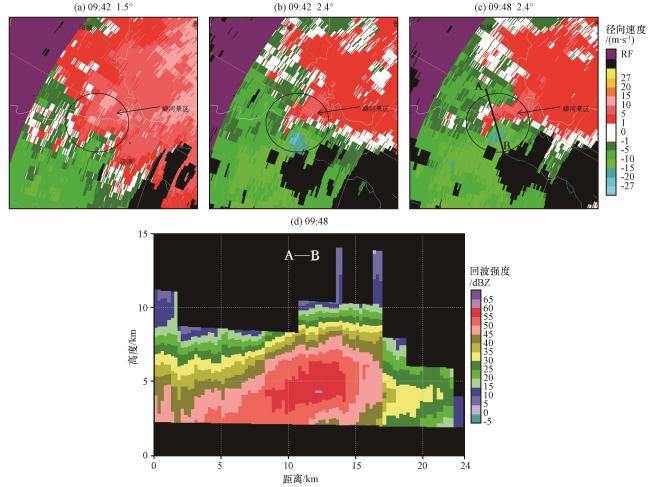
图12 极端强降水中心蟒河景区最大雨强时段对流单体3的径向速度(a~c, 单位: m·s-1)和沿着图(c)A-B线的反射率因子垂直剖面(d, 单位: dBZ)(郑州雷达, 图像放大16倍)Fig.12 Radial velocity map of convective cell 3 during the maximum rainfall intensity period in Manghe scenic area (a~c, unit: m·s-1), and the reflectivity factor profile (Zhengzhou radar, images are magnified 16 times) along A-B line in Fig. 12(c) (d, unit: dBZ) |
5 微物理结构特征
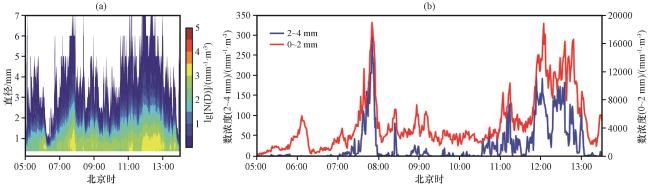
图14 2021年7月11日05:00 -14:00降水阶段晋城雨滴谱数浓度时间演变(a, 单位: mm-1·m-3)、 小雨滴(直径0~2 mm)和中等雨滴(直径2~4 mm)数浓度时间演变(b)Fig.14 Time variation of raindrop spectrum (a, unit: mm-1·m-3), and concentration of small raindrops (0~2 mm) and medium raindrops (2~4 mm) (b) detected by Jincheng raindrop spectrometer from 05:00 to 14:00 on 11 July 2021 |
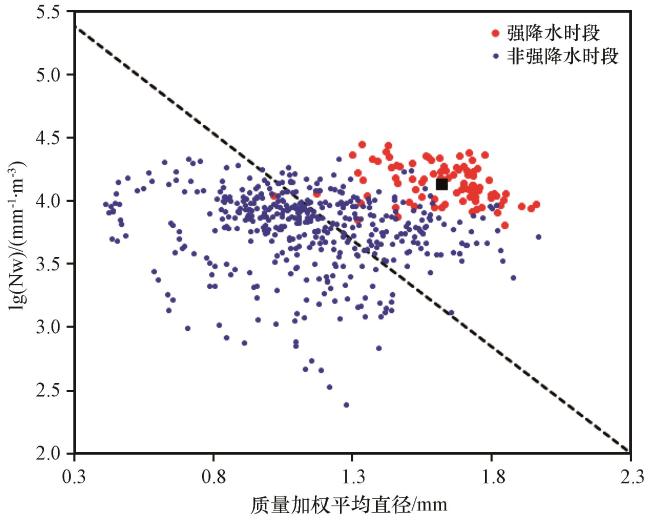


图15 7月11日05:00 -14:00晋城强降水时段(07:30 -07:55、 11:50-12:50)(红色圆点)和非强降水时段(蓝色圆点)的lg(Nw )和质量加权平均直径(DM )的散点分布黑色方框为强降水时段的平均lg(Nw )和DM 的散点, 黑色点虚线为层云和对流降水的标准线(Bringi et al, 2003) Fig.15 Scatter diagram of lg(NW ) and DM of Jincheng heavy precipitation period (07:30 -07:55, 11:50 -12:50) (red dot) and non-heavy precipitation period (blue dot) from 05:00 to 14:00 on July 11. The black box is the scatter of the average lg (N W ) and average DM during the period of heavy precipitation, the black dotted line is the standard line of stratiform clouds and convective precipitation (Bringi et al, 2003) |