

1 引言
2 资料来源和方法介绍
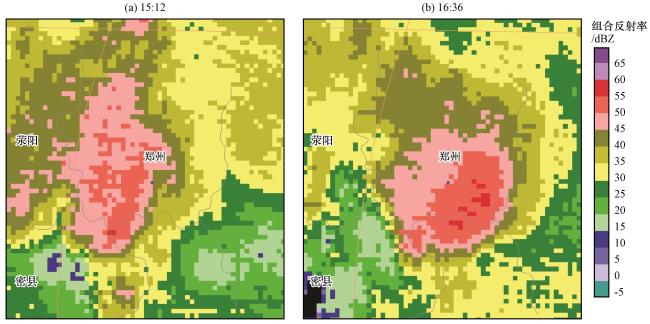
3 郑州特大暴雨雷达回波演变特征
4 雨滴谱特征
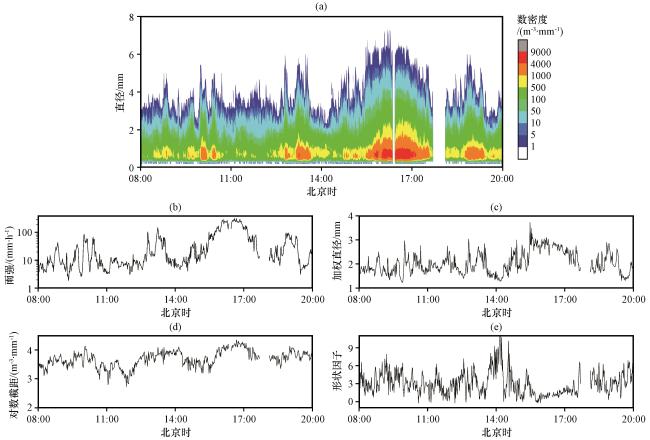
4.1 雨滴谱和积分参数演变特征
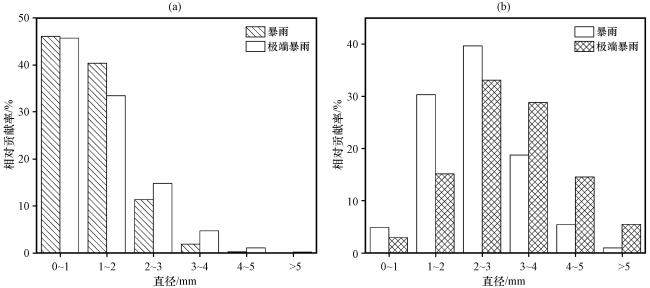
4.2 不同尺寸雨滴对雨量和浓度贡献分析
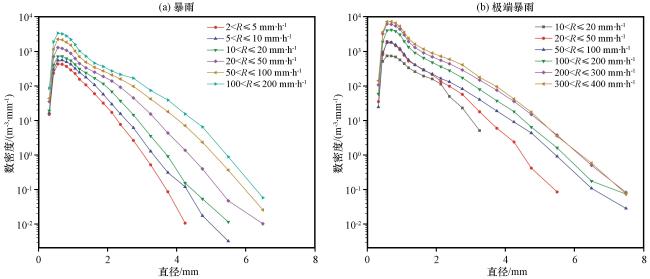
4.3 不同雨强平均雨滴谱特征
表1 暴雨不同雨强平均雨滴谱参数特征Table 1 The main characteristics for different rainrate categories of rainstorm |
| 雨强 /(mm·h-1) | 分类 | 谱数 | μ | lgN w /(m-3·mm-1) | D m /mm | /(mm·h-1) |
|---|---|---|---|---|---|---|
| 2<R≤5 | 1 | 71 | 3.54 | 3.47 | 1.60 | 4.0 |
| 5<R≤10 | 2 | 207 | 3.70 | 3.58 | 1.72 | 7.3 |
| 10<R≤20 | 3 | 138 | 3.73 | 3.66 | 1.88 | 13.9 |
| 20<R≤50 | 4 | 99 | 2.79 | 3.72 | 2.18 | 32.0 |
| 50<R≤100 | 5 | 51 | 2.02 | 3.80 | 2.48 | 69.2 |
| 100<R≤200 | 6 | 5 | 1.81 | 3.87 | 2.69 | 119.3 |
表2 极端暴雨不同雨强平均雨滴谱参数特征Table 2 The main characteristics for different rainrate categories of extreme rainstorm |
| 雨强 /(mm·h-1) | 分类 | 谱数 | μ | lgN w /(m-3·mm-1) | Dm /mm | /(mm·h-1) |
|---|---|---|---|---|---|---|
| 10<R≤20 | 3 | 1 | 4.44 | 3.75 | 1.92 | 19.1 |
| 20<R≤50 | 4 | 10 | 2.03 | 3.81 | 2.19 | 39.8 |
| 50<R≤100 | 5 | 25 | 1.67 | 3.63 | 2.72 | 69.3 |
| 100<R≤200 | 6 | 37 | 1.13 | 3.99 | 2.65 | 140.9 |
| 200<R≤300 | 7 | 42 | 1.14 | 4.13 | 2.79 | 248.1 |
| 300<R≤400 | 8 | 3 | 1.37 | 4.25 | 2.76 | 314.1 |
4.4 平衡雨滴谱特征
表3 暴雨和极端暴雨各类雨滴谱出现频率和雨强范围Table 3 Percentage of occurrence for each HS class for each dataset |
| 分 类 | HS /(m-3·mm-2) | 暴雨 | 极端暴雨 | ||
|---|---|---|---|---|---|
| 出现 频率/% | 雨强 /(mm·h-1) | 出现 频率/% | 雨强 /(mm·h-1) | ||
| 1 | HS>0.0 | 2.8 | 3.4~57.5 | ||
| 2 | -0.5≤HS<0.0 | 60.5 | 3.2~150.1 | 83.9 | 19.1~324.6 |
| 3 | -1.0≤HS<-0.5 | 34.3 | 3.2~82.4 | 16.1 | 21.0~161.2 |
| 4 | -1.5≤HS<-1.0 | 2.4 | 1.8~6.6 | ||
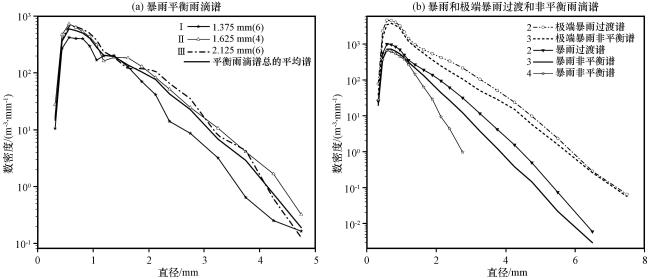
图5 不同直径的暴雨平衡雨滴谱(a)、 暴雨和极端暴雨过渡和非平衡雨滴谱(b)分布(a)中黑色实线是平衡雨滴谱总的平均谱, 线Ⅰ、 Ⅱ、 Ⅲ分别是峰值直径1.375 mm、 1.625 mm和2.125 mm的平均谱,括号中的数字是该类平衡谱的样本数 Fig.5 Average raindrop size distributions of equilibrium for different peak diameter of rainstorm (a), and the transition raindrop size distributions and nonequilibrium raindrop size distributions of rainstorm and extreme rainstorm (b). In panel (a), the black solid line represents the total average of equilibrium raindrop size distributions,the lines ofⅠ,Ⅱand Ⅲ are equilibrium raindrop size distributions with different peak diameter at 1.375 mm, 1.625 mm and 2.125 mm, respectively. The numbers in parentheses represent the sample numbers for certain type of equilibrium raindrop size distributions |
4.5 归一化Gamma函数三参数与雨强 R 关系分析
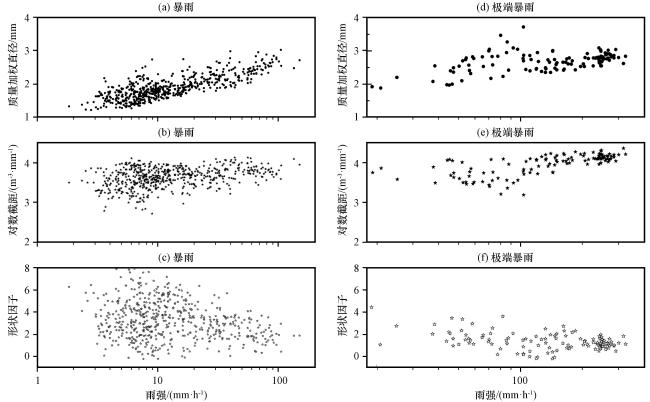
4.6 N w-D m 分布特征
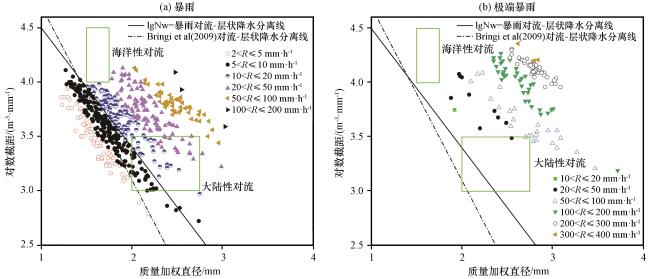
图7 不同雨强lgN w-D m散点分布绿色矩形框是Bringiet等(2003)给出的海洋性和大陆性对流分布, 点划线是对流与层状云降水之间的分离线, 黑实线是本文暴雨对流与层状降水之间分离线 Fig.7 Scatter plots of lgNw versus Dm for rainstorm (a), and extreme rainstorm (b).The black dot-dash line is the stratiform-convective separation line proposed and by Bringiet al (2009), the two green rectangles correspond to the maritime and continental convective clusters reported by Bringi et al (2003).The black solid line is the stratiform-convective separation line of rainstorm |
4.7 Z-R 关系分析
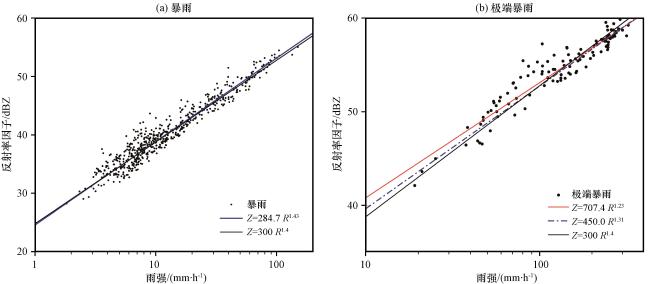


图8 2021年7月20日08:00 -20:00郑州观测站雷达反射率因子Z与雨强R散点分布和拟合线(a、 b)中黑色实线是新一代多普勒雷达对流降水Z-R关系; (a)中蓝色实线是暴雨雨强大于10.0 mm·h-1数据拟合线; (b)中红色实线是极端暴雨雨强大于10.0 mm·h-1数据拟合线, 蓝色点划线是极端暴雨雨强大于200.0 mm·h-1数据拟合线 Fig.8 Scatter plots of radar reflectivity factor Z versus rain rate R retrieved from raindrop size distributions for rainstorm (a), and extreme rainstorm (b).The solid black lines indicate the Z-R relationship for convective precipitation of the New generation Doppler radar, the solid blue line indicate the Z-R relationship for R>10 mm·h-1 of rainstorm.The solid red line indicate the Z-R relationship for of extreme rainstorm, and the dot-dash blue lines indicate the Z-R relationship for R>200 mm·h-1 of extreme rainstorm |