
1 引 言
2 数据来源和方法介绍
2.1 数据来源
2.2 短序列资料计算SPI的方法
表1 SPI干旱等级分类及相应概率Table 1 The classification of drought categories and corresponding probability |
| SPI值 | 等级 | 概率 |
|---|---|---|
| 2.00≤SPI | 特涝 | 0.02 |
| 1.50≤SPI≤1.99 | 重涝 | 0.04 |
| 1.00≤SPI≤1.49 | 中涝 | 0.09 |
| 0<SPI≤0.99 | 轻涝 | 0.34 |
| -0.99≤SPI≤0 | 轻旱 | 0.34 |
| -1.49≤SPI≤-1.00 | 中旱 | 0.09 |
| -1.99≤SPI≤-1.50 | 重旱 | 0.04 |
| SPI≤-2.00 | 特旱 | 0.02 |
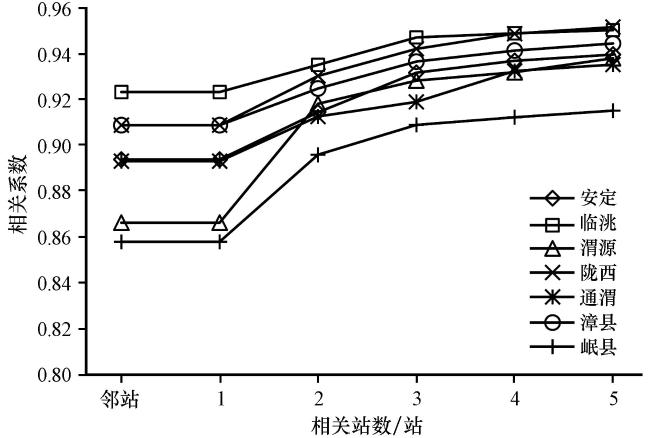
图1 本站与周边不同数量站拟合值与实测值的相关系数Fig.1 Correlation coefficient of fitted and measured values between different stations and surrounding stations |
2.3 误差分析方法
3 结果分析
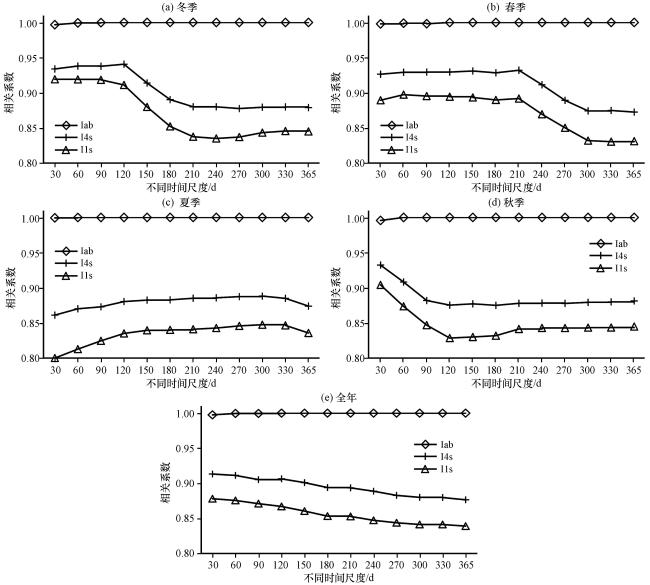
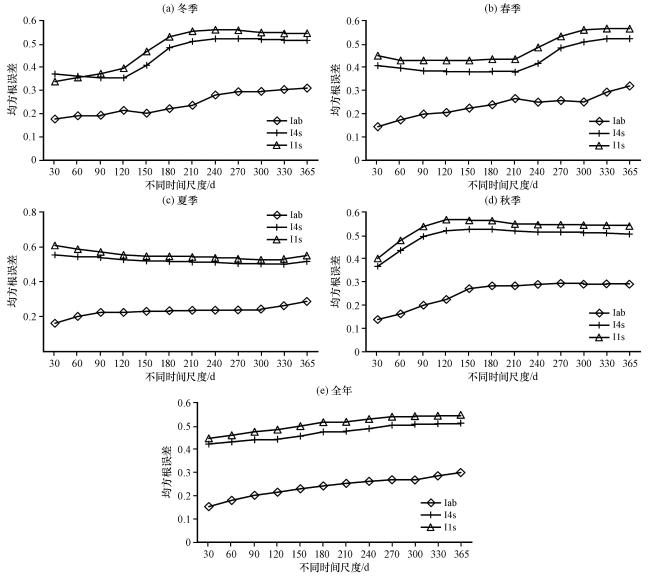
3.1 不同时间尺度SPI的误差
3.2 典型代表站点的误差分析
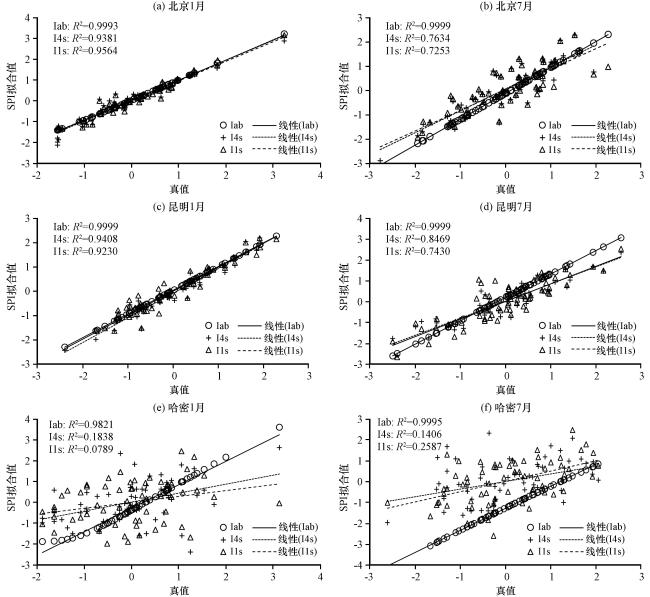
图5 三种方法计算的三站1月、 7月SPI拟合值(Iab, I4s, I1s)与真值(Iz)的散点对比图北京代表北方站, 昆明代表南方站, 哈密代表西北站 Fig.5 The scatter comparison diagram of the winter and summer SPI fitting values (Iab, I4s, I1s) and true values (Iz) calculated by the three methods of three stations.Beijing represents North Station, Kunming represents Southern Station and Hami represents Northwest Station |
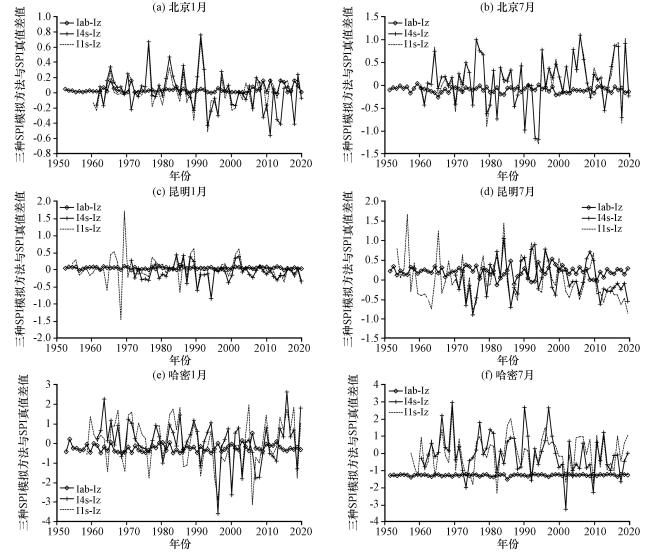
图6 三种方法计算的三站1月、 7月SPI拟合值(Iab, I4s, I1s)与真值(Iz)的差值年际变化图北京代表北方站, 昆明代表南方站, 哈密代表西北站 Fig.6 The inter-annual variation diagram of the winter and summer SPI fitting values (Iab, I4s, I1s) and true values (Iz) calculated by the three methods of three stations.Beijing represents North Station, Kunming represents Southern Station and Hami represents Northwest Station |
3.3 空间误差分析
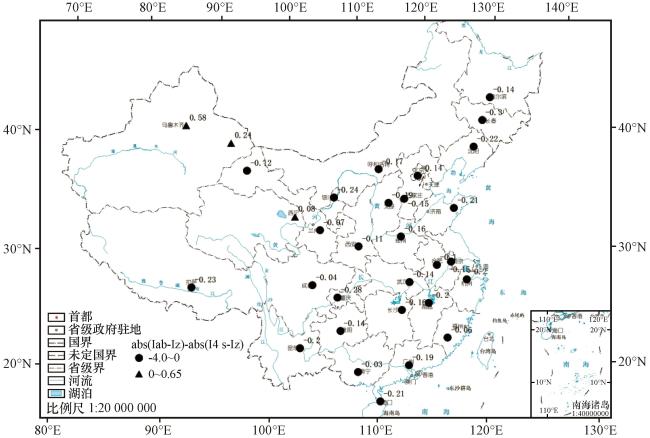
表2 拟合值Iab、 I4s与真值Iz的绝对差及相对差Table 2 Absolute error and relative error of the fitted values Iab/I4s and true values Iz |
| 站名 | 绝对差 | 相对差/% |
|---|---|---|
| 安定 | -0.06 | -23.42 |
| 北京 | -0.18 | -83.16 |
| 瓜州 | -0.29 | -102.82 |
| 广州 | -0.23 | -84.86 |
| 贵阳 | -0.12 | -29.97 |
| 哈尔滨 | -0.16 | -83.89 |
| 哈密 | 0.07 | 77.25 |
| 海口 | -0.12 | -60.76 |
| 杭州 | -0.17 | -65.33 |
| 合肥 | -0.07 | -24.83 |
| 呼和浩特 | -0.15 | -101.97 |
| 济南 | -0.28 | -97.17 |
| 昆明 | -0.20 | -56.60 |
| 拉萨 | -0.20 | -45.23 |
| 南昌 | -0.21 | -100.65 |
| 南京 | -0.14 | -64.52 |
| 南宁 | -0.02 | -2.99 |
| 沙坪坝 | -0.26 | -87.91 |
| 沈阳 | -0.40 | -150.80 |
| 石家庄 | -0.16 | -65.85 |
| 太原 | -0.22 | -80.10 |
| 温江 | -0.06 | -29.97 |
| 乌鲁木齐 | 0.63 | 150.00 |
| 武汉 | -0.07 | -32.23 |
| 西宁 | 0.02 | 0.78 |
| 银川 | -0.32 | -112.11 |
| 漳平 | -0.07 | -23.94 |
| 长安 | -0.09 | -34.98 |
| 长春 | -0.31 | -118.63 |
| 长沙 | -0.14 | -65.11 |
| 郑州 | -0.16 | -64.95 |
| 平均 | -0.13 | -48.05 |
粗体表示拟合效果较差的站点 |
3.4 高密度区域站干旱监测应用
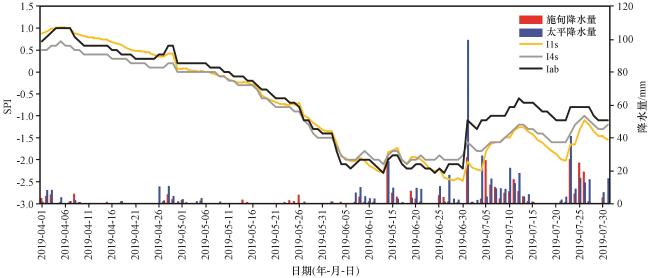
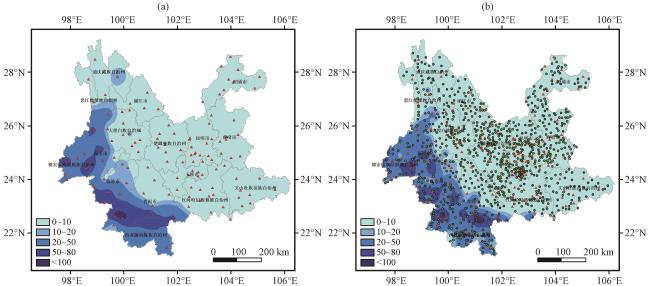
图9 2019年7月1日国家站和区域站降水量分布(单位: mm)左图为127个国家站, 右图为127个国家站与1009个区域站 Fig.9 Precipitation distribution chart at national and regional stations on 1 July 2019.Unit: mm.127 national stations on left, 127 national stations and 1009 regional stations on right |
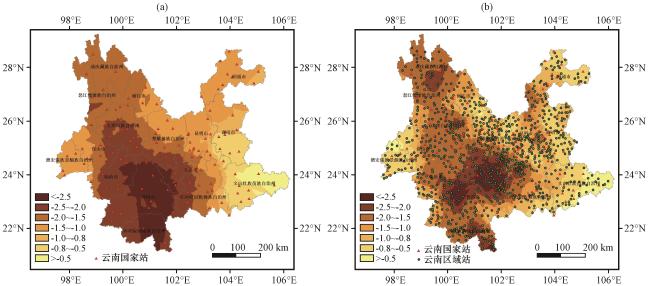
图10 国家站SPI和利用参数插值法计算的区域站SPI干旱监测对比图左图为仅用127个国家站计算的SPI90, 右图为利用127个国家站和1009个区域站计算的SPI90 Fig.10 Comparison of drought monitoring between national station SPI and regional station SPI calculated by parameter interpolation method.SPI90 calculated only by 127 national stations on the left, SPI90 calculated by 127 national stations and 1009 regional stations on the right |