论文

冬季乌拉尔山阻塞高压建立和维持与位势高度季节内振荡的联系

  • 徐彬羽 ,
  • 姚素香 ,
  • 孙庆飞
展开
  • 1. 南京信息工程大学大气科学学院,江苏 南京 210044
    2. 仪征市气象局,江苏 扬州 211400

徐彬羽(1998 -), 女, 青海海东人, 硕士研究生, 主要从事大气季节内振荡研究. E-mail:

收稿日期: 2022-04-20

  修回日期: 2023-02-06

  网络出版日期: 2023-11-14

基金资助

国家自然科学基金重点项目(41930969-3)

The Connections between the Establishment and Maintenance of Ural Blockings in Winter and Intra-seasonal Oscillation of Geopotential Height

  • Binyu XU ,
  • Suxiang YAO ,
  • Qingfei SUN
Expand
  • 1. School of Atmospheric Sciences NUIST,Nanjing 210044,Jiangsu,China
    2. Yizheng Meteorological Bureau,Yangzhou 211400,Jiangsu,China

Received date: 2022-04-20

  Revised date: 2023-02-06

  Online published: 2023-11-14

摘要

冬季乌拉尔山阻塞高压(以下简称乌山阻高)是导致我国出现大范围寒潮天气的重要影响系统, 探究其建立和维持过程与位势高度季节内振荡的联系能够为我国延伸期天气预报及短期气候预测提供参考因子。本文基于欧洲中期天气预报中心(European Centre for Medium-Range Weather Forecasts, ECMWF)提供的1979/1980 -2019/2020年ERA5逐日再分析数据, 采用主、 客观相结合的方法, 筛选得到114次冬季乌山阻高事件, 累计阻高日数591天。利用功率谱分析、 相关分析、 合成分析等统计方法, 分析乌山阻高与500 hPa位势高度季节内振荡之间的可能联系。结果表明: (1)近41年冬季乌拉尔山地区位势高度存在10~20天、 30天及45天左右的显著周期。通过多尺度分析发现, 在乌山阻高建立与维持期间位势高度的不同时间尺度分量贡献不同, 其中对乌山阻高建立贡献最大的是10~20天的准双周位势高度正异常, 阻高维持则决定于20~80天的季节内尺度位势高度正异常。在阻高建立和维持过程中, 准双周位势高度异常具有自西向东的传播特征, 季节内尺度位势高度异常无明显传播。(2)根据两次阻高事件发生的时间间隔长短将阻高事件分为连续阻高事件和其他阻高事件, 通过多个例合成分析和典型个例分析, 发现对于连续阻高事件而言, 位势高度异常的20~80天振荡对其建立和维持贡献最大, 但无明显传播特征, 准双周尺度位势高度异常表现出向西传播的信号, 而其他非连续阻高事件与不同时间尺度大气环流的联系则与所有阻高事件合成的结果相似。

本文引用格式

徐彬羽 , 姚素香 , 孙庆飞 . 冬季乌拉尔山阻塞高压建立和维持与位势高度季节内振荡的联系[J]. 高原气象, 2023 , 42(6) : 1548 -1561 . DOI: 10.7522/j.issn.1000-0534.2023.00006

Abstract

The Ural blocking high (UB) in winter is an important influence system leading to widespread cold snap in China.Exploring exploring the connections between its establishment and maintenance processes and intra-seasonal oscillations of geopotential height can provide reference factors for extended range forecasting and short-term climate prediction.By using the ERA5 daily reanalysis data provided by European Centre for Medium-Range Weather Forecasts (ECMWF) from 1979/1980 to 2019/2020, 114 winter UB events were selected by using a combined subjective and objective method, in which the cumulative number of blocking high days reached 591.The connections between the Ural blockings and the intra-seasonal oscillations of the 500 hPa geopotential height were analyzed by using power spectrum analysis, correlation analysis, synthesis analysis and other statistical methods.The results show that: (1) Geopotential height over the Ural Mountains has significant periods of 10~20 days, 30 days and 45 days during the last 41a winter.Through multi-scale analysis, we find that different time scale components of the geopotential height contribute differently during the establishment and maintenance processes of the Ural blockings, where the largest contribution to the establishment of Ural blocking highs is the quasi-biweekly geopotential height anomaly (10~20 days), and the maintenance of blocking high events is determined by intra-seasonal oscillations with a scale of 20~80 days.During the establishment and maintenance processes of blockings, the quasi-biweekly geopotential height anomaly propagates from west to east, while the intra-seasonal oscillations of the geopotential height anomaly have no significant propagation.(2) According to the time intervals between the occurrences of two events, blockings are classified into continuous blocking high events and other blocking high events.Through multiple case synthesis analysis and typical individual case analysis, we find that for continuous blocking high events, the intra-seasonal oscillations of the geopotential height anomaly contribute most to their establishment and maintenance processes, but have no significant propagation.The geopotential height anomaly shows a westward propagating signal on the quasi-biweekly scale.The connections between other non-continuous blockings and atmospheric circulation at different time scales are similar to the results of all blocking high events.

1 引言

阻塞高压(以下简称阻高), 是在高空高压脊逐渐北伸的过程中, 其南部与暖空气的联系被冷空气切断, 从而在高压脊北部形成的闭合环流。作为一种中高纬大气环流异常经向发展并稳定的形势, 阻高会引起大范围气团热量与质量交换, 从而导致天气气候异常。早在20世纪50年代就有学者指出, 东亚阻塞形势对中国气候, 特别是大旱大涝等反常气候具有一定影响(汤懋苍, 1957)。冬季乌山阻高的生成、 维持和崩溃过程与东亚大气环流及我国寒潮天气爆发有密切联系(叶笃正等, 1962), 之后众多研究发现, 阻高是极端天气气候事件出现的重要影响系统。如, 1998年夏季长江中下游特大暴雨过程与乌拉尔山阻塞高压(以下简称乌山阻高)崩溃有关(陈菊英等, 2001); 乌拉尔山东侧阻塞脊以及里海高度脊的强烈增幅是2004/2005年冬季我国发生强寒潮事件的前提条件(马晓青等, 2008); 2020年超强梅雨同样与欧亚地区阻高位置及频次异常有关(刘芸芸和丁一汇, 2020)。除此之外, 极端低温事件是近年来气象研究热点(谭赢等, 2022), 已有研究表明阻高对极端低温事件具有重要影响(刘明歆等, 2021金燕等, 2022路瑶等, 2022), 其形成频率与极端低温事件有关(刘子奇等, 2022)。因此, 阻高与极端天气气候事件之间具有密切联系, 针对阻高的研究具有重要意义。
大气季节内振荡最早由Madden and Julian(19711972)于20世纪70年代初提出, 是大气中最显著的一种振荡现象。已有研究表明, 低纬度季节内振荡对于东亚季风(李崇银, 2004)、 热带气旋(韩荣青等, 2006孙长等, 2009)以及ENSO(杨双艳等, 2012)均具有一定影响。随着研究进一步深入, 不同学者逐渐发现中高纬度地区同样存在类似的大气低频振荡活动(John and Richard, 1983Yang et al, 2013), 许多中高纬环流系统均具有显著的季节内振荡特征, 如东北冷涡(刘慧斌等, 2012)、 阿留申低压(张盛曦和任雪娟, 2017)、 西伯利亚高压(马宁等, 2020)等。阻高活动同样受到季节内尺度环流的影响, 北太平洋大气低频变化能够在一定程度上影响中高纬地区的阻高天数(Simons et al, 1983)。Takaya and Nakamura(2005)利用合成分析方法对冬季西伯利亚地区上空20个反气旋异常事件进行分析, 发现高空阻塞形势具有两种形成方式, 并且这两种方式均与地面西伯利亚高压的季节内振荡有关。Schneidereit et al(2012)针对与2010年夏季俄罗斯异常高温热浪事件有关的阻塞高压, 分析不同时间尺度环流场结构对欧洲东部阻高事件的影响, 结果表明中高纬大气季节内波列有利于俄罗斯上空的阻高维持更长时间。除此之外, 冬季北半球位势高度具有季节内振荡特征(姚素香等, 2016), 冬半年太平洋北部上空位势高度表现出明显的10~40天周期变化(辛欣等, 2017)。欧亚地区阻高活跃区分别位于乌拉尔山地区、 贝加尔湖地区及鄂霍茨克海地区(李春和孙照渤, 2003刘刚等, 2012), 其中夏季鄂霍茨克海阻高与大气季节内振荡具有良好耦合关系(杨双艳和李天明, 2020), 太平洋阻高的发生频率具有季节内变化特征(Gao et al, 2020)。
纵观前人研究, 阻高与大气季节内振荡关系密切, 但是在其建立与维持过程中季节内振荡的作用和贡献尚不明晰。因此, 本文主要分析1979 -2019年冬季乌山阻高与位势高度大气季节内振荡之间的联系, 探究乌山阻高建立与维持过程中500 hPa位势高度在不同时间尺度下的演变特征及传播特征, 希望能够为我国延伸期天气预报及短期气候预测提供参考因子。

2 资料来源和方法介绍

本文所使用的资料为欧洲中期天气预报中心(European Centre for Medium-Range Weather Forecasts, ECMWF)提供的ERA5逐日再分析资料(Hoffmann et al, 2019), 物理量包括500 hPa位势高度及相对涡度, 水平分辨率为0.25°×0.25°。研究时段为1979 -2019年冬季, 其中冬季定义为当年12月至次年2月。
根据高度场方法(Tibaldi and Molteni, 1990)对阻高事件进行筛选, 计算T&M阻高指数, 即分别计算南500 hPa位势高度梯度(GHGS)及北500 hPa位势高度梯度(GHGN):
G H G S = Z φ o - Z φ s φ o - φ s
G H G N = Z φ n - Z φ o φ n - φ o
式中: Z为500 hPa位势高度; φ n = 75 ° N + δ ,   φ o = 60 ° N + δ ,   φ s = 45 ° N + δ ,   δ = - 5 ° ,   0 ° ,   5 °。当某时刻某经度上的任一 δ值满足: (1)GHGS>0, (2)GHGN<-10 m/ °则认为该时该经度发生阻塞, 并取GHGS为阻高指数, 若有两个以上的 δ值满足(1)(2)条件则取GHGS的最大值为阻高指数。定义维持时间3天及以上、 空间大于15个经度范围的大尺度阻塞过程为一次阻塞事件。
为探究阻高与不同时间尺度大气环流的联系, 对500 hPa位势高度进行功率谱分析, 根据结果对位势高度(Z)进行尺度分离, 即利用Lanzcos滤波器(姚菊香等, 2005), 对近41年10月至次年4月逐日数据进行处理, 取其中冬季(12月至次年2月)数据滤波结果, 将一个物理量分解为四个分量:
Z = Z ¯ + Z ' + Z ' ' + Z *
式中: Z ¯为低频背景场(>80天); Z '为季节内尺度高频部分(10~20天), 也称作准双周尺度; Z ' '为季节内尺度低频部分(20~80天), 后简称为季节内尺度; Z *为天气尺度分量(<10天), 分别计算各分量平均场, 从而分析乌山阻高建立与维持过程中各分量变化情况。
为更加客观地考察位势高度不同振荡的周期发展阶段, 对波动进行位相分析(梁萍和丁一汇, 2011)。首先将近41年冬季乌山地区(45°N -75°N、 45°E -80°E)500 hPa滤波后的位势高度进行空间平均, 得到逐日变化序列, 记录每一次波峰(波谷)的数值, 将一个完整周期平均分为四个位相, 定义波谷为第一位相, 从波谷到波峰转换期记为第二位相, 波峰为第三位相, 从波峰向波谷转换期记为第四位相。
除此之外, 本文还用到相关分析、 合成分析等方法。

3 结果分析

3.1 冬季乌山阻高与不同时间尺度大气环流的联系

利用高度场方法客观定量识别阻高, 同时结合天气图进行检验, 最终得到近41年冬季乌山阻高事件共114次(表1), 平均每年2.78次, 累计阻高日数591天, 平均每年14.41天, 生命周期为3~16天, 平均每次5.18天。
表1 1979/1980-2019/2020年冬季乌山阻高事件

Table 1 The Ural blocking high events in winter from 1979/1980 to 2019/2020

年份

开始时间

(月-日)

持续时间

/d

年份

开始时间

(月-日)

持续时间

/d

年份

开始时间

(月-日)

持续时间

/d

1979 12-18 3 1993 12-01 5 2009 02-11 3
1979 12-30 6 1994 01-17 3 2009 02-17 8
1980 01-27 6 1994 12-06 3 2010 01-18 6
1980 02-05 7 1995 01-20 6 2010 01-25 5
1981 01-16 8 1995 02-17 4 2010 02-02 6
1981 02-10 4 1996 01-13 3 2010 02-09 6
1981 02-16 3 1996 02-17 3 2010 12-11 5
1981 02-20 5 1996 02-23 7 2010 12-20 3
1981 12-02 3 1996 12-01 7 2010 12-31 8
1981 12-26 5 1998 01-01 3 2011 01-18 8
1982 01-30 5 1999 02-20 7 2011 02-24 3
1982 12-13 3 1999 12-27 5 2011 12-18 5
1982 12-23 3 2000 02-20 3 2012 01-05 7
1983 12-18 3 2001 01-03 4 2012 01-15 12
1983 12-22 3 2001 02-04 6 2012 02-01 8
1984 01-14 7 2001 12-11 3 2012 02-12 3
1984 01-24 12 2002 02-26 3 2012 02-17 4
1984 02-08 4 2002 12-18 3 2012 12-11 9
1984 02-17 3 2003 01-21 5 2013 02-01 3
1984 02-27 3 2003 02-06 6 2013 2-10 9
1984 12-10 3 2003 12-29 5 2013 12-26 5
1984 12-15 14 2004 01-15 3 2014 02-25 4
1985 01-05 8 2004 01-25 11 2015 01-26 4
1985 02-17 5 2004 12-20 3 2015 02-25 4
1985 02-23 5 2005 01-22 15 2016 01-01 6
1986 01-27 7 2005 02-12 4 2016 01-20 3
1987 02-10 3 2005 02-18 4 2016 01-27 3
1987 02-16 4 2005 12-19 3 2016 02-10 5
1988 01-12 3 2005 12-31 5 2016 02-20 3
1988 01-24 5 2006 02-15 9 2017 01-14 4
1988 02-12 3 2006 12-09 5 2017 12-13 7
1988 02-24 6 2007 12-07 8 2018 01-01 6
1990 01-15 3 2007 12-27 3 2018 01-16 16
1990 02-16 6 2008 01-06 3 2018 02-07 3
1990 12-12 3 2008 01-19 5 2018 02-12 4
1991 12-23 4 2008 01-31 4 2018 12-02 3
1992 12-05 4 2008 12-23 4 2018 12-24 3
1993 02-22 7 2009 01-18 9 2019 12-13 6
为验证客观定量识别阻高事件的准确性与客观性, 计算阻高逐年累计天数与冬季500 hPa位势高度平均场之间的相关系数[图1(a)]。从图1(a)中能够看到, 乌拉尔山地区为显著正相关区域, 结合阻高中心位置分布情况[图1(a)中灰色圆点], 选定研究关键区为45°N -75°N、 45°E -80°E。从近41年冬季乌山阻高事件的500 hPa位势高度场及异常场[图1(b)]中能够看到, 关键区呈明显阻塞形势, 位势高度最大值达5518.86 gpm, 同时异常中心位于55°N以北, 中心数值超过160 gpm。接下来为讨论不同时间尺度大气季节内振荡与位势高度异常之间的联系, 对关键区冬季500 hPa位势高度进行功率谱分析[图1(c)], 发现冬季乌山地区位势高度在10~20天、 30天及45天左右都具有明显的峰值, 且通过95%的红噪声检验, 说明该区域位势高度异常具有显著的季节内振荡特征, 并存在多个周期。
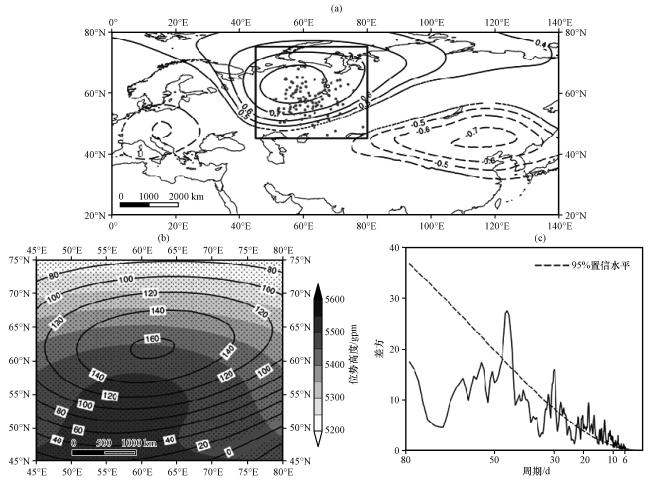
图1 阻高逐年累计天数与冬季500 hPa位势高度平均场相关系数(a, 已通过99%显著性检验, 图中灰色圆点表示阻高中心位置分布, 黑色方框为关键区); 所有阻高事件500 hPa位势高度场(阴影, 单位: gpm)及距平场(黑色实线, 单位: gpm, 间隔20 gpm)(b); 关键区区域平均的冬季500 hPa位势高度功率谱分析(c, 虚线表示95%置信水平)

Fig.1 The correlation coefficient between accumulated days of blocking high and average geopotential height on 500 hPa in winter (a, exceed 99% significance level, the grey dots represent geographic distribution of blocking high and black frame represents key area); the 500 hPa geopotential height (shading, unit: gpm) and its anomaly (unit: gpm, black solid lines with interval of 20 gpm) of all blocking high events (b); power spectral analysis of the box-average 500 hPa geopotential height in winter (c, dashed line denotes 95% significance level)

基于功率谱分析结果, 采用尺度分离的方法(Yao et al, 2020), 通过Lanczos滤波器将位势高度异常分解为四个部分: 10天以下的天气尺度分量, 10~20天的准双周分量, 20~80天的季节内低频分量以及80天以上的背景分量。定义阻高出现为第0天, 分析超前10天至滞后4天关键区不同尺度分量随时间的演变[图2(a)]。在-8天之前, 季节内尺度分量贡献较大, 但是到-6天及-4天准双周分量贡献明显增加, 之后季节内尺度分量占据主导地位, 直到阻高事件结束。对滤波结果进行合成分析, 定量诊断阻高维持期间不同时间尺度分量对位势高度异常的贡献情况[图2(c)], 结果显示, 20~80天的季节内位势高度异常分量贡献较大, 占总异常的49.8%, 说明从气候态角度来看阻高与季节内(20~80天)振荡密切相关。此外, 准双周尺度的相对贡献虽然较季节内尺度偏弱, 但其贡献仍达到26.0%。为更清晰看到各分量超前10天至滞后4天的变化情况, 进一步分析500 hPa位势高度倾向[图2(b)]。从图2(b)中能够看到-4天至第0天位势高度倾向为明显正异常, 将其定义为建立阶段, 并由此计算关键区-4天至第0天500 hPa位势高度倾向之和[图2(d)], 发现位势高度倾向的10~20天分量对阻高建立的贡献最大, 贡献率达到53.0%, 其次贡献较大的是20~80天低频分量。综上, 准双周位势高度异常对乌山阻高建立起主要作用, 而20~80天的季节内尺度分量决定了阻高维持。
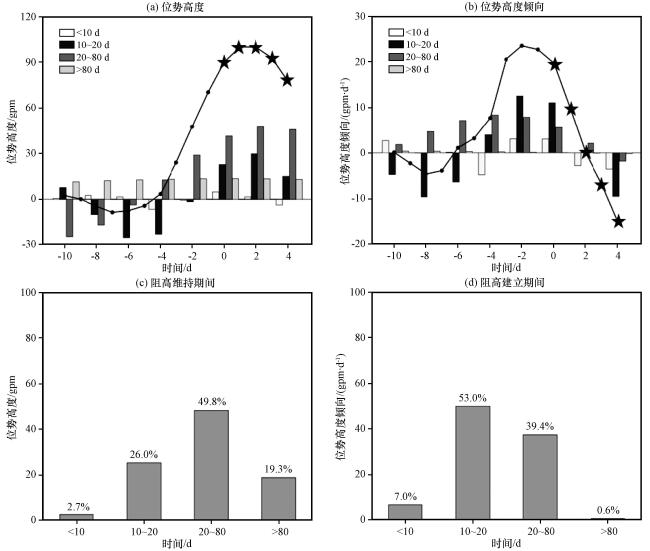
图2 所有阻高事件-10天至+4天500 hPa位势高度距平(黑色实线)及各分量变化情况(a); 所有阻高事件-10天至+4天500 hPa位势高度倾向(黑色实线)及各分量变化情况(b); 所有阻高事件维持过程中(0天到阻高事件结束)500 hPa位势高度各分量平均(c); 所有阻高事件建立过程中(-4天到0天)500 hPa位势高度倾向之和(d)星号表示阻高维持过程

Fig.2 The 500 hPa geopotential height anomaly (black solid line) and the variation of each component of all blocking high events from -10 day to +4 day (a); the 500 hPa geopotential height tendency (black solid line) and the variation of each component of all blocking high events from -10 day to +4 day (b); each component average of 500 hPa geopotential height of all blocking high events during maintenance process (0 day to the end of blocking high events) (c); the sum of 500 hPa geopotential height tendency of all blocking high events in the establishment process (-4 day to 0 day) (d).Pentagrams indicate the maintenance process of blocking high

进一步分析乌拉尔山地区位势高度10~20天振荡和20~80天振荡特征与乌山阻高建立和维持的联系。乌山地区500 hPa位势高度10~20天振荡特征[图3(a)~(d)]表明, 位势高度准双周振荡的第一位相[图3(a)]表现出明显的负异常, 而第三位相为位势高度正异常大值区[图3(c)]。第二位相和第四位相位势高度偏小, 但是第二、 四位相中位势高度倾向较强[图3(b), (d)]。季节内尺度位势高度的位相分布[图3(e)~(h)]与准双周尺度相似, 均在第一位相表现出明显负异常[图3(e)], 在第三位相表现出明显正异常[图3(g)], 异常中心略强于准双周尺度分量, 并且第二位相同样具有正位势高度倾向[图3(f)], 第四位相具有负位势高度倾向[图3(h)]。分析阻高建立与维持过程在不同位相的分布频率[图3(i), (j)]发现, 阻高建立主要集中在两类振荡事件的第二位相, 并且出现在位势高度10~20天振荡第二位相的频率更高; 阻高维持主要出现在第三位相, 同时出现在位势高度20~80天振荡第三位相的频次更多, 与之前得出的结论相符。
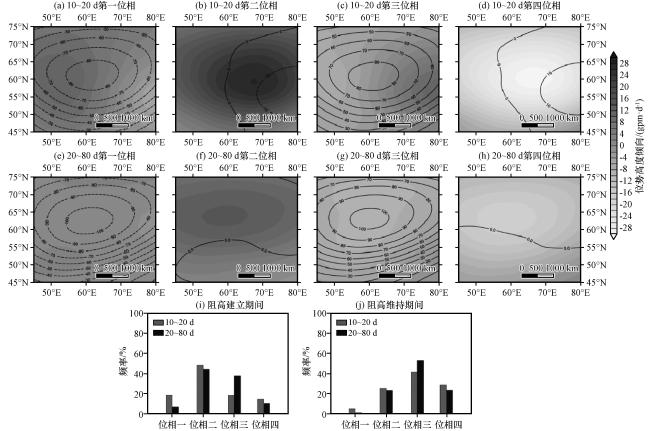
图3 500 hPa位势高度10~20天振荡(a~d)及20~80天振荡(e~h)的四个位相中滤波后位势高度异常(等值线, 单位: gpm)和位势高度倾向(阴影, 单位: gpm·d-1)分布图; 阻高事件建立过程在两类振荡事件不同位相分布频率(i); 以及阻高事件维持过程在两类振荡事件不同位相分布频率(j)

Fig.3 The filtered geopotential height anomaly (contour, unit: gpm) and geopotential height tendency (shaded, unit: gpm·d-1) in four phases for the 10~20 day oscillations (a~d) and 20~80 day oscillations (e~h) of the 500 hPa geopotential height; the frequency of different phase distributions of the blocking high establishment process in the two types of oscillation events (i); the frequency of different phase distributions of the blocking high maintenance process in the two types of oscillation events (j)

进一步讨论10~20天及20~80天位势高度异常的传播特征。图4给出阻高事件建立与维持过程中10~20天准双周和20~80天季节内尺度500 hPa位势高度异常及位势高度倾向的演变情况。如图4(a)所示, 在准双周时间尺度上, -8天时关键区有一负变高中心, 强度逐渐减弱并东移。至-6天, 关键区出现负位势高度, 同时负变高中心仍处于关键区中, 但位相略超前于负异常中心。-4天时关键区由负位势高度控制, 此时关键区西部为正变高中心, 东部为负变高中心。随后负异常中心减弱消失, 关键区由正变高控制。第0天关键区出现正异常中心, 与正变高中心重合, 此时乌山阻高建立。随着正变高中心向东传播, 在+2天时关键区正变高中心位相超前于正异常中心, 关键区西部产生新的负变高中心, 且负变高中心向东传播, 至+4天关键区已基本受负变高控制。至+8天, 关键区转为负位势高度控制, 阻高事件结束。在季节内尺度上[图4(b)], 从-10天至-6天关键区均为负位势高度控制, 同时伴有正变高中心, 且中心逐渐增强。至-4天, 关键区出现正异常中心, 此后该中心强度增强, 在第0天达到最大值。而正变高中心在-2天时便开始减弱, 直到+4天关键区出现负变高中心, 中心强度增强, 因此伴随着正异常中心减弱, 但正异常中心位置基本保持不变。综上, 位势高度倾向中心的出现时间超前于位势高度异常中心, 在准双周尺度上异常中心与变高中心均逐渐东移, 而在季节内尺度上异常中心与变高中心均稳定少动。
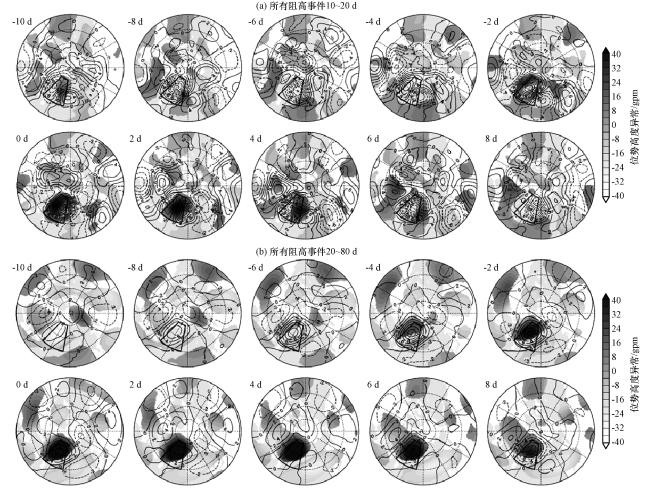
图4 所有阻高事件500 hPa位势高度10~20天(a)和20~80天(b)滤波后传播特征 阴影为滤波后数据, 已通过95%显著性检验, 单位: gpm; 黑线为位势高度倾向, 单位: gpm·d-1, 间隔2 gpm·d-1; 黑色框表示关键区

Fig.4 The propagation characteristics of 10~20 day (a) and 20~80 day (b) filtered 500 hPa geopotential height of all blocking high events.Shadings represent filtered data, which have passed significance test of 95%, unit: gpm.Black lines denote geopotential height tendency with interval of 2 gpm·d-1, unit: gpm·d-1.Black frames represent key area

上文表明在准双周尺度和季节内尺度中位势高度传播有所不同, 因此为更清楚看到乌山阻高建立与维持过程中其在不同时间尺度下的传播情况, 分别绘制500 hPa位势高度在乌山关键区经度-时间剖面图(45°N -75°N平均)和纬度-时间剖面图(45°E -80°E平均), 如图5所示。从图5(a)中能够看到, 位势高度在10~20天时间尺度上具有明显的向东传播特征, 但是在20~80天时间尺度上无明显纬向传播[图5(b)]。除此之外, 两种尺度的位势高度异常在经向上均无明显传播特征[图5(c), (d)]。
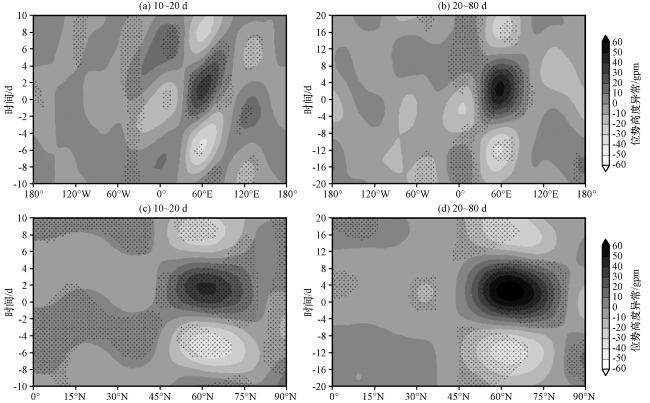
图5 所有阻高事件500 hPa位势高度滤波后时间-纬度剖面图(a, b)及时间-经度剖面(c, d)(单位: gpm)打点表示通过90%显著性检验

Fig.5 Time-latitude profile of filtered 500 hPa geopotential height in (a, b) for all blocking high events, time-longitude profile of filtered 500 hPa geopotential height in (c, d) for all blocking high events.Unit: gpm.The dots have passed the significance test of 90%

3.2 连续和非连续阻高事件建立与维持的差异

在对阻高事件进行分析时发现有发生间隔时间较短的两次事件, 因此从两次阻高事件发生间隔时间的角度对近41年乌山阻高事件进行分类。考虑到近41年冬季乌山地区阻高事件的每次平均持续时间为5.18天, 由此定义间隔时间≤6天的阻高事件为连续阻高事件(表2), 接下来将探究不同时间尺度位势高度异常对连续阻高事件的影响。
表2 1979/1980-2019/2020年冬季乌拉尔山地区连续阻高事件

Table 2 The continuous Ural blocking high events in winter from 1979/1980 to 2019/2020

年份

开始时间

(月-日)

持续时间

/d

年份

开始时间

(月-日)

持续时间

/d

1981 02-16 3 2005 02-12 4
1981 02-20 5 2005 02-18 4
1983 12-18 3 2009 02-11 3
1983 12-22 3 2009 02-17 8
1984 12-10 3 2010 01-18 6
1984 12-15 14 2010 01-25 5
1985 02-17 5 2010 02-02 6
1985 02-23 5 2010 02-90 6
1987 02-10 3 2012 02-12 3
1987 02-16 4 2012 02-17 4
1996 02-17 3 2018 02-07 3
1996 02-23 7 2018 02-12 4
对比冬季乌山连续阻高事件和其他阻高事件的500 hPa位势高度场及距平场[图6(a), (b)], 发现相较于其他阻高事件, 连续阻高事件中阻塞形势偏弱, 位势高度大值区范围较小, 距平中心为158.85 gpm, 而其他阻高事件的位势高度异常中心最大值可达164.46 gpm。从连续阻高事件与其他阻高事件位势高度距平差值场[图6(c)]中能够更加明显看出, 连续阻高事件中阻高向北伸展, 异常在北部更强, 而南部则表现为其他阻高事件的异常更强。由于两类事件异常中心均位于55°N -70°N之间, 并且在此范围内存在较大差异, 因此进一步分析55°N -70°N、 45°E -80°E这个范围内位势高度异常特征。
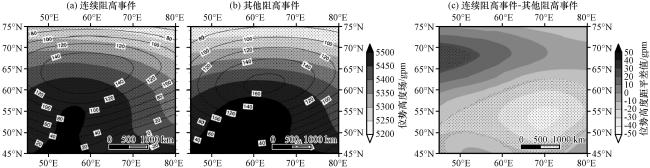
图6 连续(a)和其他(b)阻高事件500 hPa位势高度场(阴影, 单位: gpm)及距平场(黑色实线, 单位: gpm, 间隔20 gpm); 连续阻高事件与其他阻高事件500 hPa位势高度距平差值场(c, 单位: gpm)打点表示通过90%显著性检验

Fig.6 The 500 hPa geopotential height (shading, unit: gpm) and its anomaly (unit: gpm, black solid lines with interval of 20 gpm) of continuous blocking high events (a) and other blocking high events (b); the difference field of 500 hPa geopotential height anomaly between continuous blocking high events and other blocking high events (c, unit: gpm).Dots have passed the significance test of 90%

采用3.1的分析方法对两类阻高事件展开研究, 对比分析两类振荡对不同阻高事件建立与维持的相对贡献。图7(a)和(b)分别为连续阻高事件和其他阻高事件-10天至+4天500 hPa位势高度滤波后各分量随时间演变情况, 从图7(a)和(b)中能够看到, 阻高维持期间季节内尺度分量较大。分析两类阻高事件维持过程中位势高度各分量平均[图7(e), (f)]发现, 对两类阻高维持贡献最大的为位势高度的20~80天振荡, 但明显连续阻高事件中20~80天位势高度异常的占比更大。进一步分析不同时间尺度位势高度异常对阻高建立的影响, 图7(g)和(h)分别为两类阻高事件-4天至0天500 hPa位势高度倾向之和, 从图7(g)中能够看到, 20~80天振荡对连续阻高事件的建立贡献最大, 贡献率达到56.6%。综上, 连续阻高事件的建立与维持均决定于位势高度异常的20~80天振荡, 其他非连续阻高事件则与所有阻高事件特征相似。
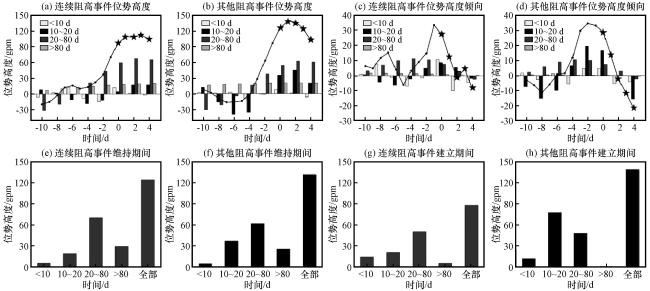
图7 连续(a)和其他(b)阻高事件-10天至+4天500 hPa位势高度距平(黑色实线)及各分量变化情况; 连续(c)和其他(d)阻高事件-10天至+4天500 hPa位势高度倾向(黑色实线)及各分量变化情况; 连续(e)和其他(f)阻高事件维持过程中(0天到阻高事件结束)500 hPa位势高度各分量平均; 连续(g)和其他(h)阻高事件建立过程中(-4天到0天)500 hPa位势高度倾向之和 星号表示阻高维持过程

Fig.7 The 500 hPa geopotential height anomaly (black solid line) and the variation of each component of continuous blocking high events (a) and other blocking high events (b) from -10 day to +4 day; the 500 hPa geopotential height tendency (black solid line) and the variation of each component of continuous blocking high events (c) and other blocking high events (d) from -10 day to +4 day; each component average of 500 hPa geopotential height during maintenance process of continuous blocking high events (e) and other blocking high events (f) (0 day to the end of blocking high events); the sum of 500 hPa geopotential height tendency of continuous blocking high events (g) and other blocking high events (h) in the establishment process (-4 day to 0 day).Pentagrams indicate the maintenance process of blocking high

同样分析两类阻高事件建立与维持期间在位势高度10~20天振荡和20~80天振荡不同位相的分布频率(图8)。从图8(a)和8(c)中能够看到, 阻高事件在第二位相建立, 但是在第三位相维持[图8(b), (d)]。相比较而言, 连续阻高事件中建立与维持均为位势高度的季节内尺度分量出现频次更多[图8(a), (b)], 而其他阻高事件在建立过程中10~20天位势高度异常频率最大[图8(c)], 维持过程中20~80天位势高度异常频率最大[图8(d)], 与前文结论相一致。
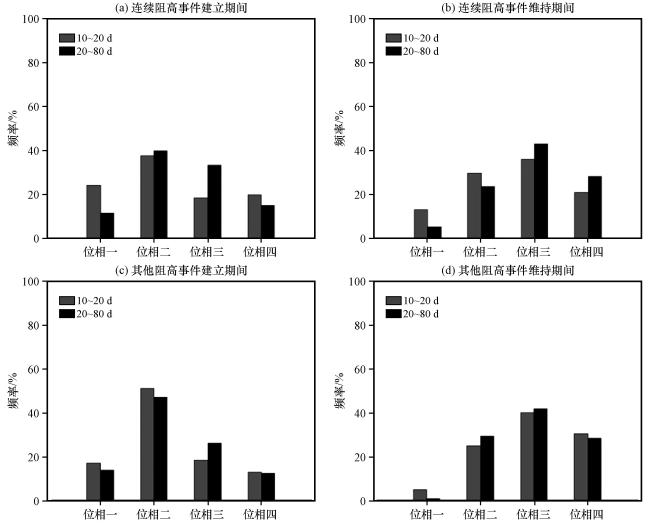
图8 连续阻高事件建立过程(a)、 维持过程(b)及其他阻高事件建立过程(c)、 维持过程(d)在10~20天振荡和20~80天振荡不同位相的分布频率

Fig.8 The distribution frequency of different phases of continuous blocking high events establishment process (a), maintenance process (b) and other blocking high events establishment process (c), maintenance process (d) in 10~20 days oscillation and 20~80 days oscillation

接下来分析连续阻高事件中500 hPa位势高度在10~20天时间尺度及20~80天时间尺度上的传播特征, 分别计算乌山关键区纬度范围55°N -70°N和经度范围45°E -80°E内位势高度平均, 得到时间-经度、 时间-纬度剖面图(图9)。从图9(a)中能够看到, 位势高度异常在准双周尺度上具有向西传播的信号, 与所有阻高事件中位势高度异常的传播方向相反, 而在季节内尺度上位势高度异常无明显传播[图9(b)]。同样, 连续阻高事件中位势高度异常在经向无明显传播特征[图9(c), (d)]。
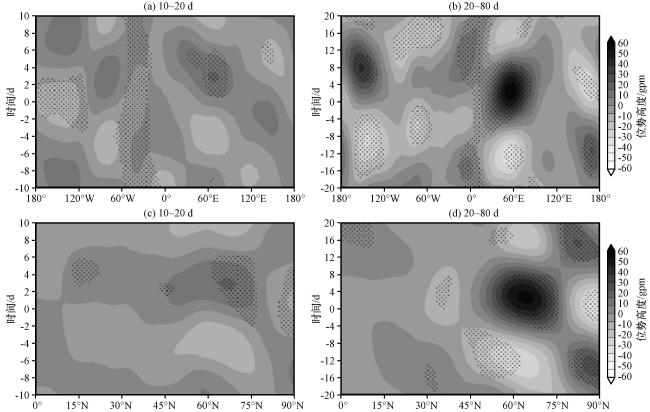
图9 连续阻高事件500 hPa位势高度滤波后时间-纬度剖面图(a, b)及时间-经度剖面(c, d)(单位: gpm)打点区域表示通过90%显著性检验

Fig.9 Time-latitude profile of filtered 500 hPa geopotential height in (a, b) for continuous blocking high events, time-longitude profile of filtered 500 hPa geopotential height in (c, d) for continuous blocking high events.Unit: gpm.The black dots have passed the significance test of 90%

3.3 两类阻高事件典型个例对比分析

众多天气事实表明阻高持续时间越久, 所引发的冷空气越强(路瑶等, 2022), 造成的影响越大, 因此接下来根据阻高生命期长度, 分别选择连续阻高事件和其他阻高事件中生命期最长的两次事件作为典型个例, 其中连续阻高典型事件为1984年12月10 -12日和15 -28日, 共持续17天, 其他阻高典型事件为2018年1月16 -31日, 共持续16天。从个例500 hPa位势高度场及距平场[图10(a), (b)]中能够看到, 中纬度地区呈明显阻塞形势, 异常中心位于55°N以北, 并且连续阻高典型事件强度更强。进一步分析不同时间尺度位势高度对阻高事件的贡献情况, 图10(c)、 (d)分别为两类阻高典型事件不同时间尺度的500 hPa位势高度随时间演变情况。从图10(c)中能够看到, 连续阻高事件建立和维持期间, 季节内尺度位势高度异常处于峰值, 尤其是对第二次阻高事件作用更大。对于其他阻高事件而言, 在阻高建立阶段, 10~20天准双周位势高度异常分量较大, 位于波峰位置, 而阻高维持期间10~20天分量呈微弱波动, 以20~80天位势高度异常为主[图10(d)]。因此, 多个例合成结果和典型个例结果均表明, 不同时间尺度位势高度异常对阻高建立与维持的贡献不同。
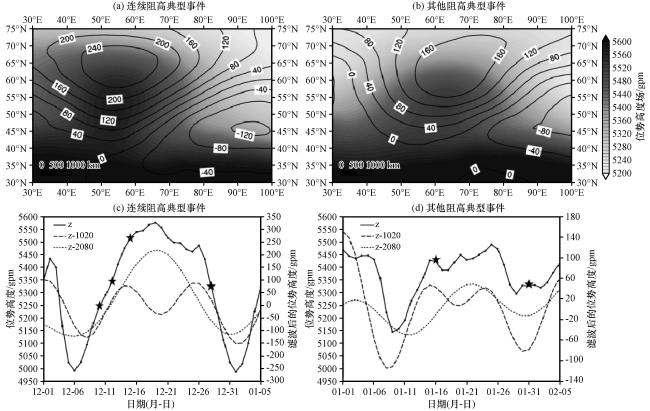
图10 连续阻高典型事件(a, 1984年12月10 -12日、 1984年12月15 -28日)和其他阻高典型事件(b, 2018年1月16 -31日)500 hPa位势高度场(阴影, 单位: gpm)及距平场(黑色实线, 单位: gpm, 间隔40 gpm); 1984年12月1日至1985年1月5日(c)和2018年1月1日至2月5日(d)500 hPa位势高度及各分量变化(星号表示阻高事件开始和结束日期)

Fig.10 The 500 hPa geopotential height (shading, unit: gpm) and its anomaly (unit: gpm, black solid lines with interval of 40 gpm) for the typical events of continuous blocking high (a, December 10-December 12, 1984 and December 15-December 28, 1984) and the 500 hPa geopotential height (shading, unit: gpm) and its anomaly (unit: gpm, black solid lines with interval of 40 gpm) for the typical events of other blocking high (b, January 16-January 31, 2018); the 500 hPa geopotential height and the variation of each component from December 1, 1984-January 5, 1985 (c) and from January 1-February 5, 2018 (d).Pentagrams indicate the start and end date of the blocking events

4 结论

本文基于1979 -2019年冬季ERA5逐日再分析数据, 利用功率谱分析、 相关分析、 合成分析等方法对近41年冬季乌山阻高事件与位势高度大气季节内振荡之间的联系进行分析, 得出如下结论:
(1) 利用主、 客观相结合的方法筛选得到近41年冬季乌山阻高事件共114次, 累计阻高日数591天。功率谱分析结果表明近41年冬季乌拉尔山地区位势高度具有10~20天的显著周期, 同时功率谱密度在30天及45天左右也存在明显峰值。
(2) 不同时间尺度分量对乌山阻高的建立与维持贡献不同, 乌山阻高的建立主要取决于10~20天准双周位势高度异常, 而在乌山阻高维持过程中, 20~80天的季节内尺度位势高度异常贡献最大。在乌山阻高事件中, 不同时间尺度分量的传播特征也有所不同, 500 hPa位势高度异常在10~20天低频尺度上具有向东传播特征, 在季节内低频尺度上传播特征不明显, 同时无明显经向传播。
(3) 将冬季乌拉尔山地区阻高事件分为连续阻高事件和其他阻高事件两类, 多个例合成分析和典型个例分析均表明, 连续阻高事件的建立与维持均决定于位势高度异常的20~80天振荡, 并且在连续阻高事件中准双周位势高度异常表现出由东向西传播的信号, 而其他阻高事件与不同时间尺度大气环流的联系与所有阻高事件合成的结果相似。
最后需要指出的是, 本文对乌山阻高事件与不同尺度位势高度异常进行了细致分析, 但在分析中还发现乌拉尔山阻塞高压事件的发生存在明显年际差异, 这种年际差异是否与大气季节内振荡强度、 传播方向等的年际差异有关, 还需要进一步开展深入研究。

参考文献

null
Gao M X Yang S Y Li T M2020.The spatio-temporal variation of Pacific blocking frequency within winter month and its relationship with surface air temperature[J].Atmosphere11(9): 960.DOI: 10.3390/atmos11090960 .
null
Hoffmann L Gebhard G Dan L, et al, 2019.From ERA-Interim to ERA5: the considerable impact of ECMWF's next-generation reanalysis on Lagrangian transport simulations[J].Atmospheric Chemistry and Physics, 19: 3097-3124.DOI: 10.5194/acp-19-3097-2019 .
null
John R A Richard D R1983.The latitude-height structure of 40-50 day variations in atmospheric angular momentum[J].Journal of Atmospheric Sciences40(6): 1584-1591.DOI: 10.1175/1520-0469(1983)040&lt1584: TLHSOD&gt2.0.CO2 .
null
Madden R A Julian P R1971.Detection of a 40-50 day oscillation in the zonal wind in the Tropical Pacific[J].Journal of Atmospheric Sciences28(5): 702-708.DOI: 10.1175/1520-0469(1971)028<0702: DOADOI>2.0.CO; 2 .
null
Madden R A Julian P R1972.Description of global-scale circulation cells in the tropics with a 40-50 day period[J].Journal of Atmospheric Sciences29(6): 1109-1123.DOI: 10.1175/1520-0469(1972)029<1109: DOGSCC>2.0.CO; 2 .
null
Schneidereit A Schubert S Vargin P, et al, 2012.Large-scale flow and the Long-Lasting Blocking High over Russia: summer 2010[J].Monthly Weather Review140(9): 2967-2981.DOI: 10. 1175/MWR-D-11-00249.1 .
null
Simmons A J Wallace J M Branstator G W1983.Barotropic wave propagation and instability, and atmospheric teleconnection patterns[J].Journal of Atmospheric Sciences40(6): 1363-1392.DOI: 10.1175/1520-0469(1983)040&lt1363: BWPAIA&gt2. 0.CO2 .
null
Takaya K Nakamura H2005.Geographical Dependence of upper-level blocking formation associated with intraseasonal amplification of the Siberian High[J].Journal of the Atmospheric Sciences62(12): 4441-4449.DOI: 10.1175/JAS3628.1 .
null
Tibaldi S Molteni F1990.On the operational predictability of blocking[J].Tellus A: Dynamic Meteorology and Oceanography42(3): 343-365.DOI: 10.3402/tellusa.v42i3.11882 .
null
Yang S Y Li T M2017.The role of intraseasonal variability at mid-high latitudes in regulating Pacific blockings during boreal winter[J].International Journal of Climatology, 37: 1248-1256.DOI: 10.1002/joc.5080 .
null
Yang S Y Wu B Y Zhang R H, et al, 2013.The zonal propagating characteristics of low-frequency oscillation over the Eurasian mid-high latitude in boreal summer[J].Science China Earth Sciences56(9): 1566-1575.DOI: 10.1007/s11430-012-4576-z .
null
Yao S Tong Q Li T M, et al, 2020.The 10-30-day oscillation of winter rainfall in southern China and its relationship with circulation patterns in different latitudes[J].International Journal of Climatology40(6): 3268-3280.DOI: 10.1002/joc.6396 .
null
陈菊英, 王玉红, 王文, 2001.1998及1999年乌山阻高突变对长江中下游大暴雨过程的影响[J].高原气象20(4): 388-394.
null
韩荣青, 李维京, 董敏, 2006.北半球副热带—中纬度太平洋大气季节内振荡的纬向传播与东亚夏季旱涝[J].气象学报82(2): 149-163.
null
金荣花, 李艳, 王式功, 2009.四种客观定量表征阻塞高压方法的对比分析[J].高原气象28(5): 1121-1128.
null
金燕, 晏红明, 张茂松, 等, 2022.云南冬半年极端低温事件与大气环流的关系[J].高原气象41(5): 1302-1314.
null
李崇银, 1991.大气低频振荡[M].北京: 气象出版社.
null
李崇银, 2004.大气季节内振荡研究的新进展[J].自然科学进展14(7): 15-22.
null
李春, 孙照渤, 2003.中纬度阻塞高压指数与华北夏季降水的联系[J].大气科学学报26(4): 458-464.
null
梁萍, 丁一汇, 2012.东亚梅雨季节内振荡的气候特征[J].气象学报70(3): 418-435.
null
刘刚, 沈柏竹, 廉毅, 等, 2012.亚洲阻塞高压分类及其与东北冷涡活动和东北夏季低温的联系[J].地理科学32(10): 1269-1274.DOI: 10.13249/j.cnki.sgs.2012.10.015 .
null
刘慧斌, 温敏, 何金海, 等, 2012.东北冷涡活动的季节内振荡特征及其影响[J].大气科学36(5): 959-973.
null
刘明歆, 李艳, 吕春艳, 2021.中国冬季两类极端低温事件特征及其大气环流成因分析[J].高原气象40(3): 603-620.DOI: 10.7522/j.issn.1000-0534.2020.00093 .
null
刘芸芸, 丁一汇, 2020.2020年超强梅雨特征及其成因分析[J].气象46(11): 1393-1404.
null
刘子奇, 路瑶, 李艳, 2022.中国大范围持续性极端低温事件年代际变化及其大气环流成因[J].高原气象41(3): 558-571.DOI: 10.7522/j.issn.1000-0534.2021.00031 .
null
路瑶, 李旭, 李艳, 等, 2022.冬季乌拉尔山地区不同生命期阻塞高压的热动量输送特征[J].高原气象41(3): 671-683.DOI: 10. 7522/j.issn.1000-0534.2021.00003 .
null
马宁, 何丽烨, 梁苏洁, 等, 2020.京津冀冬季冷空气过程的低频特征及西伯利亚高压低频变化的影响[J].地理学报75(3): 485-496.
null
马晓青, 丁一汇, 徐海明, 等, 2008.2004/2005年冬季强寒潮事件与大气低频波动关系的研究[J].大气科学32(2): 380-394.
null
孙长, 毛江玉, 吴国雄, 2009.大气季节内振荡对夏季西北太平洋热带气旋群发性的影响[J].大气科学33(5): 950-958.
null
谭赢, 李丽平, 施春华, 等, 2022.中国冬季大范围持续性低温事件低频特征及其与大气低频振荡的联系[J].高原气象41(6): 1410-1424.
null
汤懋苍, 1957.亚洲东部的阻塞形势及其对天气气候的影响[J].气象学报33 (4): 282-293.
null
辛欣, 曾胜兰, 姚素香, 等, 2017.北太平洋冬半年位势高度季节内振荡及其诊断分析[J].大气科学学报40(2): 280-287.DOI: 10.13878/j.cnki.dqkxxb.20150911001 .
null
杨双艳, 李天明, 2020.中高纬大气ISO对夏季鄂海阻高形成和维持的调节作用[J].大气科学学报43(1): 104-115.DOI: 10. 13878/j.cnki.dqkxxb.20191001010 .
null
杨双艳, 武炳义, 周顺武, 等, 2012.大气季节内振荡研究进展[J].气象科技40(6): 938-948.DOI: 10.19517/j.1671-6345. 2012.06.014 .
null
姚菊香, 王盘兴, 李丽平, 2005.季节内振荡研究中两种数字滤波器的性能对比[J].南京气象学院学报28(2): 248-253.DOI: 10.13878/j.cnki.dqkxxb.2005.02.014 .
null
姚素香, 龚克坚, 赵琛, 2016.北半球冬季中纬度位势高度场的季节内振荡[J].气象科学36(5): 622-628.
null
叶笃正, 陶诗言, 朱抱真, 等, 1962.北半球冬季阻塞形势的研究[M].北京: 科学出版社, 1-2.
null
张盛曦, 任雪娟, 2017.阿留申低压低频变化及其相关的瞬变动力学过程分析[J].气象科学38(1): 1-9.
文章导航

/