1 引言
2 数据来源与方法介绍
2.1 数据来源
2.2 评价方法
3 结果
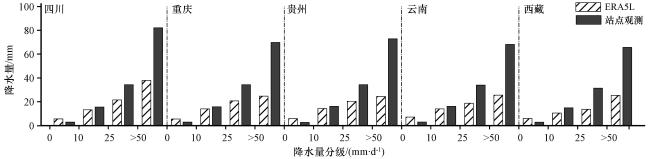
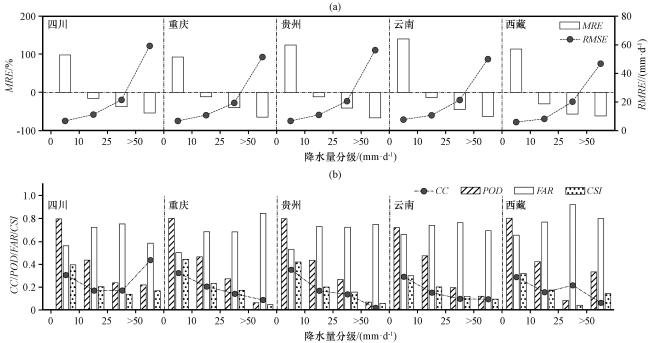
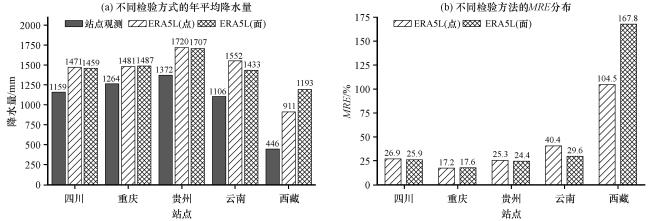
3.1 总体精度评价
表1 ERA5L降水资料在2018-2020年西南区域的精度Table 1 Accuracy evaluation of ERA5L precipitation data in Southwest China during the period 2018-2020 |
| 地区 | ERA5L日平均降水量/(mm·d-1) | 台站日平均降水量/(mm·d-1) | CC | MRE /% | RMSE /(mm·d-1) | POD | FAR | CSI |
|---|---|---|---|---|---|---|---|---|
| 四川 | 4.0 | 3.2 | 0.623 | 27.5 | 8.2 | 0.959 | 0.42 | 0.566 |
| 重庆 | 4.1 | 3.5 | 0.597 | 17.1 | 7.6 | 0.955 | 0.352 | 0.629 |
| 贵州 | 4.7 | 3.8 | 0.564 | 25.3 | 8.7 | 0.965 | 0.366 | 0.62 |
| 云南 | 4.2 | 3.0 | 0.569 | 40.4 | 7.4 | 0.978 | 0.482 | 0.512 |
| 西藏 | 2.5 | 1.2 | 0.533 | 104.6 | 4.1 | 0.971 | 0.561 | 0.434 |
| 西南区域 | 4.1 | 3.1 | 0.594 | 32.3 | 7.8 | 0.965 | 0.43 | 0.559 |
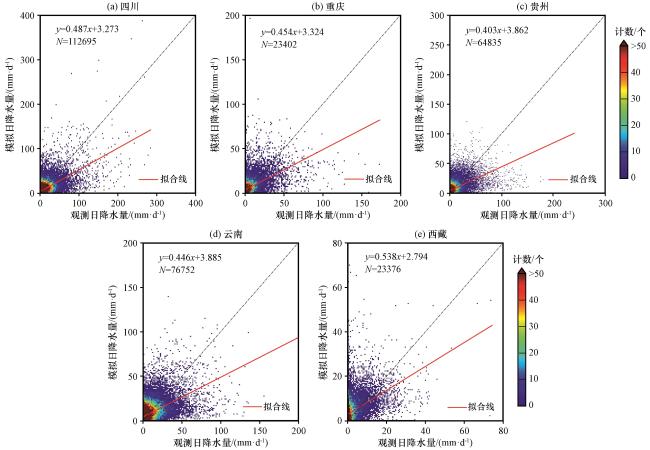
图2 ERA5L与台站观测日降水量(单位: mm)对比散点分布 黑虚线为1∶1线, 红线为一阶拟合线, N代表样本量Fig.2 Scatter plots of ERA5L precipitation data versus in-situ observations.The black dotted line is 1∶1 line, red line is first-order fitting line, N represents total number of samples |
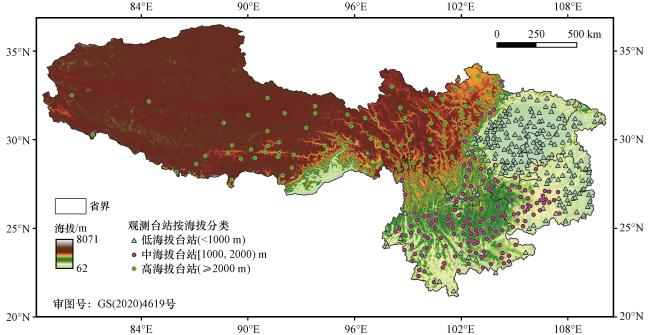
表2 ERA5L降水资料在不同海拔的精度Table 2 Accuracy evaluation of ERA5L precipitation data at different altitudes |
| 台站海拔分级 | 站点数 | ERA5L日平均降水量/(mm·d-1) | 台站日平均降水量/(mm·d-1) | CC | MRE /% | RMSE /(mm·d-1) | POD | FAR | CSI |
|---|---|---|---|---|---|---|---|---|---|
| 低海拔 | 203 | 4.32 | 3.57 | 0.614 | 21.0 | 8.7 | 0.958 | 0.382 | 0.602 |
| 中海拔 | 154 | 4.31 | 3.13 | 0.559 | 37.6 | 7.8 | 0.974 | 0.458 | 0.534 |
| 高海拔 | 84 | 3.13 | 1.87 | 0.577 | 67.0 | 4.9 | 0.97 | 0.503 | 0.49 |
3.2 误差的空间分布特征
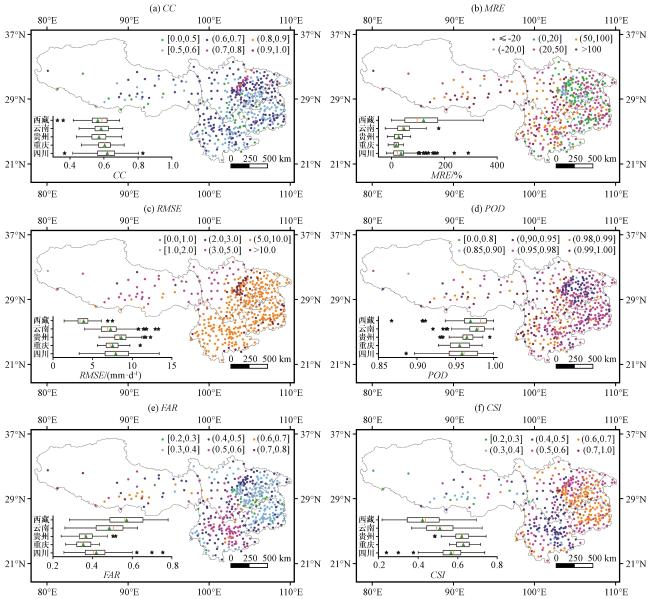
图3 ERA5L降水在观测台站评价指数的不同区间偏差(彩色点)分布 箱形图从左到右5条线依次为下边缘、 下四分位数、 中位数、 上四分位数、 上边缘, 上下边缘外的星形点为异常值, 三角形代表均值Fig.3 The spatial distribution of the ERA5L precipitation data deviation at the gauge observation stations.The five lines in the box chart from left to right are the lower edge, the lower quartile, the median, the upper quartile, and the upper edge.The star point outside the upper and lower edges is the abnormal value, and the triangle represents the mean value |