1 引言
2 数据来源与方法介绍
2.1 研究区概况
2.2 数据来源
2.3 研究方法
2.3.1 土地利用动态度
2.3.2 土地利用转移矩阵
2.3.3 生态环境质量指数
表1 腾格里沙漠生态环境质量指数Table 1 Tengger Desert ecological environment quality index |
| 土地利用类型 | 生态环境质量指数(EEQI) |
|---|---|
| 水田、 旱地 | 0.290 |
| 有林地、 灌木林地、 疏林地、 其他林地 | 0.870 |
| 高覆盖度草地、 中覆盖度草地、 低覆盖度草地 | 0.760 |
| 河流、 湖泊、 水库坑塘、 滩地 | 0.580 |
| 沙地、 戈壁、 盐碱地、 沼泽地、 裸土地、 裸岩地 | 0.025 |
| 城镇用地 | 0.200 |
| 农村居民点 | 0.200 |
| 工矿建设用地 | 0.150 |
2.3.4 景观格局指数
表2 腾格里沙漠景观格局指数Table 2 Tengger Desert landscape pattern index |
| 指数类型 | 公式 | 序号 | 释义 |
|---|---|---|---|
| 香浓多样性指数(SHDI) | (5) | SHDI为香浓多样性指数, pi 为景观斑块类型i所占比率。SHDI反映景观异质性, 对景观中各斑块类型非均衡分布状况较敏感, 且在一个景观系统中, 土地利用越丰富, 破碎化程度越高, SHDI值越高(胡雅杰等, 2013; 王朋冲等, 2020)。 | |
| 斑块密度(PD) | (6) | PD表示斑块密度, 是景观格局破碎程度的指标之一。其中, ni 为第i类景观要素的总面积(m2); A为所有景观的总面积(m2)。PD越高, 斑块的数量越多, 反映景观破碎化程度以及景观空间异质性程度越大(胡雅杰等, 2013; 王朋冲等, 2020)。 | |
| 平均分形维数(FRAC) | (7) | FRAC表示平均分形维数, P 为斑块周长(m), A为斑块面积(m2), FRAC=1表示景观形状简单, 其值越大表示景观斑块形状越复杂(高燕, 2014)。 | |
| 最大斑块面积指数(LPI) | (8) | LPI表示最大斑块面积指数, 其中, amax 指景观或某一种斑块类型中最大斑块的面积(m2)。LPI的大小可以帮助确定景观中的优势斑块类型, 间接反映人类活动干扰的方向和大小。LPI有助于确定景观的优势类型, 可以反映人类活动的方向和强弱(薛冬萍等, 2021)。 | |
| 景观分割指数(DIVISION) | (9) | DIVISION反映景观中斑块的分离程度, 值越大表明景观内斑块组成越破碎、 景观越复杂(薛冬萍等, 2021)。 | |
| 聚集度指数(AI) | (10) | AI表示聚集度指数, gii 为相应景观类型的相似邻接斑块数量, AI介于(0, 100], AI值越大表示同类斑块的聚集度越高(薛冬萍等, 2021; 高燕, 2014)。 |
2.3.5 地理加权回归模型
3 结果与分析
3.1 土地利用时空演变分析
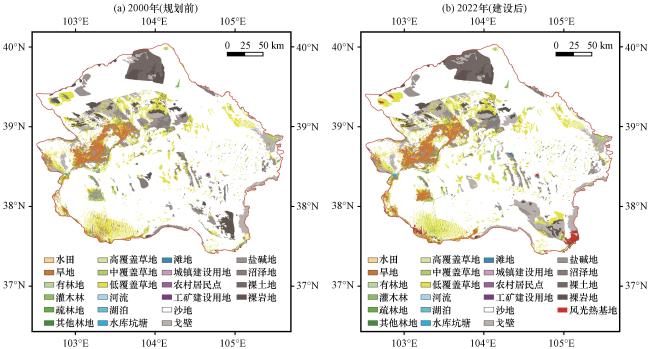
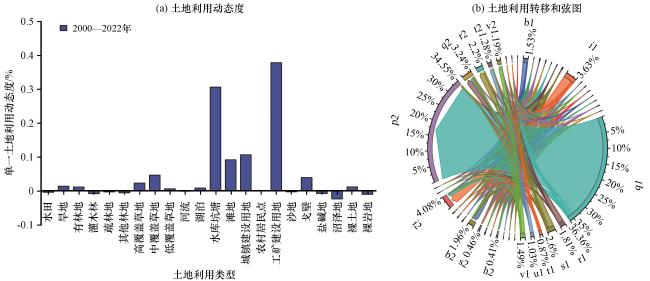
图3 腾格里沙漠风光热基地规划建设前后土地利用结构变化 图(b)仅展示2000 -2022年主要土地利用类型转移结果, 其中, a~v依次表示年水田、 旱地、 有林地、 灌木林、 疏林地、 其他林地、 高覆盖草地、 中覆盖草地、 低覆盖草地、 河流、 湖泊、 水库坑塘、 滩地、 城镇建设用地、 农村居民点、 工矿建设用地、 沙地、 戈壁、 盐碱地、 沼泽地、 裸土地及裸岩地。a~v后序号1、 2分别表示2000年、 2022年, 如a1为2000年水田, 依次类推Fig.3 The change of land use structure before and after the planning and construction of Tengger Desert landscape thermal base.The map (b) illustrates the land use changes from 2000 to 2022 for various land use types.The key for the land use types is as follows: a~v represents annual paddy fields, dry lands, forest lands, shrub forests, open forest lands, other forest lands, high-cover grasslands, medium-cover grasslands, low-cover grasslands, rivers, lakes, reservoirs, ponds, beaches, urban construction lands, rural settlements, industrial and mining construction lands, sand lands, Gobi deserts, saline-alkali lands, marsh lands, bare lands, and bare rock lands.The serial numbers 1 and 2 following a~v indicate the years 2000 and 2022, respectively.For example, a1 represents the paddy field in 2000 |
3.2 生态环境变化特征分析
3.2.1 生态环境质量变化特征
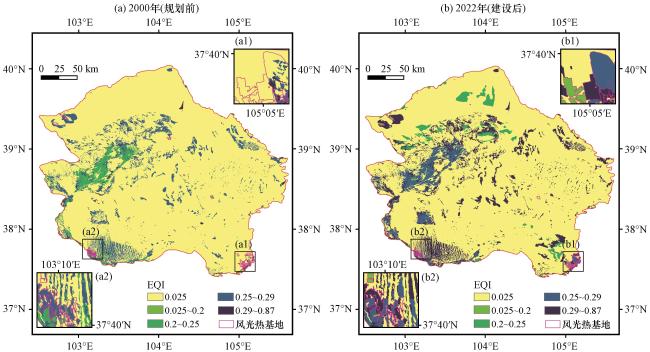
3.2.2 景观指数变化特征
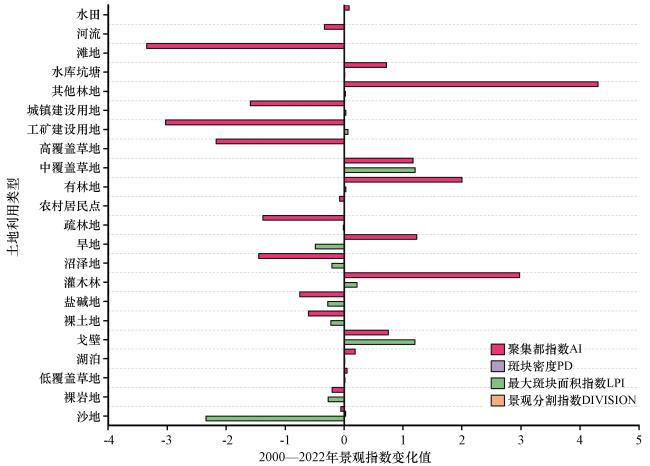
图5 腾格里沙漠风光热基地规划建设前后各地类景观指数变化 斑块密度(PD)、 景观分割指数(DIVISION)年代际变化不显著, 故未呈现Fig.5 Changes of landscape index before and after the planning and construction of Tengger Desert landscape thermal base.The analysis of interdecadal changes in patch density (PD) and landscape segmentation index (DIVISION) did not yield significant results; therefore, these findings have not been included in the presentation |