
1 引言
陆面过程是指在陆地表面发生的物理、 化学和生物等过程, 主要包括大气间与土壤和植被发生的能量与物质交换、 蒸发蒸腾、 地表径流和积雪消融等水文过程(Niu et al, 2011; Kowalczyk et al, 2013)。这些上述过程受到气候的影响, 进而再对天气与气候系统产生反馈作用, 陆地环境中任一因素产生变化都可能引发地球生态环境的变化(陈海山和孙照渤, 2002; 孙菽芬, 2002; 胡伟等, 2020; 张一帆等, 2020)。目前, 诸多人类活动已经加速改变了地球生态环境, 加大了陆面过程研究的困难性(Rodell et al, 2009; Zou et al, 2014; Xie et al, 2016)。陆面过程模式是研究陆面过程的重要工具, 它主要通过数学物理方程描述大气与陆面之间的相互作用原理, 最终可以提供温度、 湿度等可用于气候变化研究的相关变量。因此, 不断优化陆面过程模式, 让其能更精准地模拟上述陆面信息已经成为当前研究重点(Blyth et al, 2012)。同时, 陆面下垫面构成多样、 分布不均匀、 性质复杂, 在发展陆面过程模式方面, 目前还存在许多值得改进与完善的地方(王龙欢等, 2021)。
不同复杂程度的陆面过程模式对土壤水分的精确模拟与准确反映陆面水热输送有很大关系(Mahmood and Hubbard, 2003)。在已有的陆面过程模式中, 主要通过以下两种方式对土壤水分进行描述: (1)赋以地表土壤不同的热力学特征和水文特征; (2)利用Richards 方程来描述垂向分布均匀的土壤水分流动。然而在实际中土壤质地基本为垂向非均匀分布, 已有的陆面过程模式中整个垂向土壤质地用表层土壤质地代表, 假设土壤质地为垂向均匀分布。这将导致实际垂向非均匀的土壤水分与垂向均匀方式下的土壤水分存在差异, 且目前很少研究这种差异大小。熊丁晖等(2018)为探究均匀处理下和垂向层状土壤水分运动的差异建立了一维土壤水分运动模型。研究表明, 在实际应用中, 一个区域的土壤如果上下层饱和导水率相差较大, 那么垂向均匀处理可能会导致较大的误差, 和实际土壤的水分分布相差甚远, 这会严重影响土壤水分的准确估计。目前部分陆面过程模式在水分的模拟上通过土壤性质的参数化方案和分层来刻画土壤的非均匀性, 但是不同的模式对于同一土壤模拟的结果有所差别(李倩和孙菽芬, 2015)。付春伟等(2022)基于CLM4.5模式分析评估了3种土壤热导率参数化方案对土壤温、 湿度的模拟能力, 为选取最优的土壤参数化方案提供了依据。然而这不仅与模式选用的土壤性质的参数化方案有关, 还与模式的土壤垂直离散化方案有关。因此, 更加科学精确的对土壤进行垂直方向上的分层, 能相对减少上述误差, 对于提升陆面过程模式有一定的改进。
此外, 土壤温、 湿度是陆面模式重要的模拟量。研究表明, 土壤湿度连续性的维持时间可达一个半月之上, 而土壤温度在与其邻近地区或同一地区降水存在正相关, 显示出层次越深滞后时间越长的特点, 所以众多模式对土壤在垂直方向上进行分层(史学丽, 2001)。对于土壤层次, 一般分为一到几十层不等, 大多数模式对应于土壤物理结构上的表层、 根带和深层将土壤层次分为3层, 例如模式BATS将土壤层次定义为3层(Dickinson et al, 1993)。模式LPM-ZD将土壤层次分为4层(张晶和丁一汇, 1998)、 模式LSM将土壤层次分为6层(Bonan, 1996), 以及模式AVIM和新版本的BATS将土壤层次定义为10层。另外陆面参数化方案相互比较计划(PILPS) 研究已经表明: 在不同天气和气候积分条件下, 土壤厚度在根带以下, 其对模拟结果有不同的影响。这表示根据不同的研究要求, 应当改变土壤的分层方式。然而什么是陆面模式中的最优土壤分层方式仍不确定, 但统一认为: 受大气—地面界面影响较大的土壤表层应该考虑细分, 深度越深, 土壤层分层的厚度可以加大。因此本文主要利用陆面模式探究不同土壤垂直离散化方案对于土壤水热属性, 表面辐射通量与感热、 潜热通量模拟的敏感性, 达到提升模式模拟效果的目的。
2 土壤垂直离散化方案的改进
2.1 BCC_AVIM模式及其土壤垂直离散化方案简介
BCC_AVIM是由中国国家气候中心基于季劲钧等发展的大气-植被相互作用模型 AVIM2, 开发形成的陆面过程模式, 该模式对陆面过程的相关信息具有一定的模拟能力, 发展较为完善, 应用于我国气候预测与模拟业务。BCC_AVIM陆面过程模式包含了CLM3.0 模式中的相关陆地碳循环过程和土壤水热模块, 此外还包含了AVIM2 模型中的相关生物化学模块(Fuchs et al, 1978; Farouki, 1981; Jordan, 1991; 吴统文等, 2014)。
在BCC_AVIM 陆面过程模式中关于土壤的垂直离散化方案为:
式中: 为土壤各层的节点深度; 为土壤各层的厚度; 为土壤各层的界面深度; 表示土壤层的系数; 为土壤总层数, 在BCC-AVIM模式中定义为10层。并且其中 为标准系数, 在BCC-AVIM模式中定义为0.025。可以发现模式BCC-AVIM对于土壤整层土壤柱分层过少, 一共分为10层, 并且土壤深度呈现指数级增长, 深度增加很快, 对于土壤浅层及中层分层较少且厚度偏差较大。因此本试验主要对于BCC-AVIM模式中增加过快的土壤深度与厚度进行设置, 使得模式在土壤浅中层的冻土活动层有更多的层数与更细致的厚度分布。
因此, 将土壤各层的节点深度, 土壤层厚度以及土壤各层的界面深度进行插值, 将BCC_AVIM陆面模式中原来的10层土壤层插值到20层, 在本文中称为方案一。
2.2 CLM5.0土壤垂直离散化方案
式中: 为土壤各层的厚度; 为土壤各层的界面深度; 为土壤各层的节点深度; 表示土壤层的系数; 为对于适用于土壤水分计算的土壤总层数, 在CLM5.0原方案之中 , 而 , 表示深层多出5层基岩层, 并且这五层基岩层之中不计算土壤水分只计算土壤温度。
参考CLM5.0中的土壤垂直离散化方案并改进到BCC_AVIM中, 修改后的土壤总层次为20层, 在本文中称为方案二。
表1 改进前后方案土壤各层节点深度Table 1 The depth of each soil layer node before and after improvement |
| 方案 | 原方案 | 方案一 | 方案二 |
|---|---|---|---|
| 节点深度/m | 0.007 | 0.007 | 0.01 |
| 0.017 | 0.04 | ||
| 0.028 | 0.028 | 0.09 | |
| 0.045 | 0.16 | ||
| 0.062 | 0.062 | 0.26 | |
| 0.090 | 0.40 | ||
| 0.118 | 0.118 | 0.58 | |
| 0.165 | 0.80 | ||
| 0.212 | 0.212 | 1.06 | |
| 0.289 | 1.36 | ||
| 0.366 | 0.366 | 1.70 | |
| 0.492 | 2.08 | ||
| 0.619 | 0.619 | 2.50 | |
| 0.828 | 2.99 | ||
| 1.038 | 1.038 | 3.58 | |
| 1.382 | 4.27 | ||
| 1.717 | 1.727 | 5.06 | |
| 2.296 | 5.95 | ||
| 2.865 | 2.865 | 6.94 | |
| 3.433 | 8.03 | ||
| 土壤层次/层 | 10 | 20 | 20 |
3 试验设计与若尔盖站观测资料
3.1 试验设计
驱动BCC_AVIM陆面过程模式的强迫场数据是若尔盖站的实测资料, 使用不同的土壤垂直离散化方案分别模拟, 模拟时间为2019年1月到2020年6月, 由于模式前期的不稳定性, 舍弃掉2019年6月之前的模拟结果, 只分析2019年6月至2020年6月一整年的模拟结果, 相当于对模式进行了5个月的spin-up处理。将改进前后方案的模拟结果通过线性插值的方式与实测土壤层对应, 分析改进前原方案和改进后方案一、 方案二的土壤垂直离散化方案的模拟效果。本文对改进前后的土壤垂直离散化方案的模拟效果检验选用了两种统计方法。一是相关系数(r), 表示模式的模拟结果与实测数据变化趋势的相似程度; 二是均方根误差(RMSE), 表示模式模拟结果与实际观测结果的偏差, 是模拟结果与实测数据之间总体离散程度的量度。具体公式如下:
式中: 代表模拟值; 代表观测值; 代表模拟值的平均值; 代表观测值的平均值; 为样本数。
3.2 若尔盖站观测资料
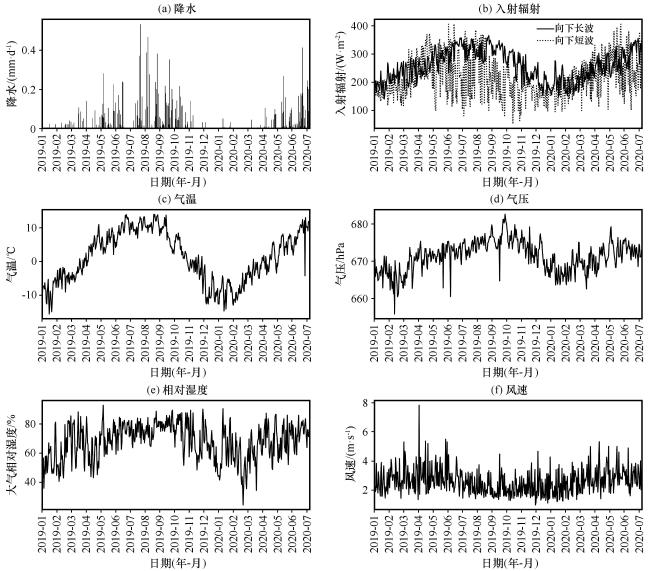
本文选用的站点为若尔盖高原湿地生态系统研究站(102°13′E, 33°88′N), 简称若尔盖站。此站点海拔为3434 m, 位于高原东部若尔盖草原, 年平均气温为1.2 ℃, 年平均降水量为595 mm, 是季节性冻土区与季节性积雪区(Deng et al, 2020; 陆宣承等, 2020; 苏有琦等, 2020)。本文所使用的实测资料为中国科学院西北生态环境研究院(原寒旱所)科研人员在若尔盖站架设的地气水热传输观测系统所采集的数据。在下文结果分析所用到的实测数据为上述资料中2019年6月至2020年6月的土壤温、 湿度数据、 辐射通量数据和感热、 潜热通量数据。在BCC_AVIM 陆面过程模式中所使用的气象要素强迫场数据为上述资料中2019 年1月1日至2020年6月30日期间的降水、 温度、 气压、 大气相对湿度、 风速、 向下长短波辐射数据(图1), 时间分辨率为30 min。
4 模拟结果对比分析
4.1 土壤温度对比分析
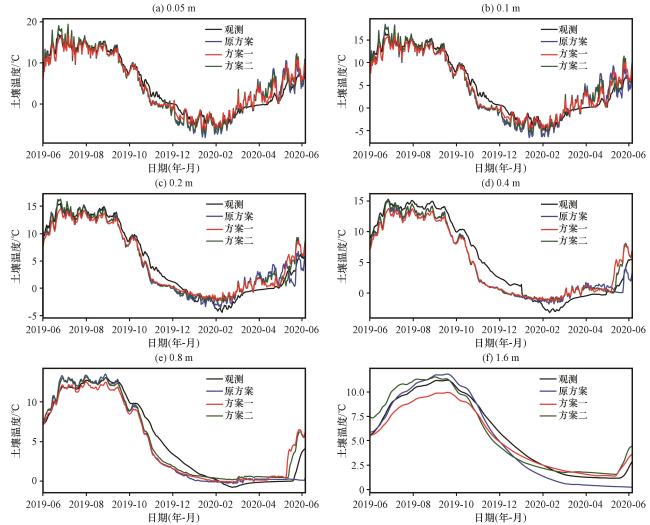
图2为改进前后不同土壤垂直离散化方案的土壤温度模拟与站点实测数据对比图。本文主要分析的土壤层次为5 cm, 10 cm, 20 cm, 40 cm, 80 cm, 160 cm 层, 将模拟数据与实测数据进行对比。结果发现, 方案一和方案二以及原方案均能较为准确地表现出土壤温度的季节变化, 即土壤温度的趋势走向、 峰谷值都与实测值基本吻合。图2中显示时间在2019年夏季(6月, 7月, 8月)土壤温度高, 温度为10 ℃以上, 时间在2019 -2020年冬季(12月, 1月和2月)土壤温度低, 温度在0 ℃以下。在浅层土壤温度表现为曲线折点多, 日变化明显, 土壤越往深层, 其温度受到气温变化的影响逐渐减小, 曲线折点少, 逐渐表现平滑, 改进前后的土壤垂直离散化方案均能模拟出这一变化。从图2中还可以看出, 方案一与方案二相比于原方案对土壤温度曲线变化趋势的模拟更加接近于实测数据。原方案在冬季模拟的浅层土壤温度都会出现变化振幅大, 温度偏低的偏差。比如时间在2020年1月10 日前后, 土壤5 cm层实际温度为-5 ℃左右, 而模式原方案模拟的土壤 5 cm层温度到达-10 ℃, 方案一与方案二相比于原方案的模拟效果更为准确, 特别是方案一对冬季浅层土壤最低温度的模拟与实测数据更为吻合。同样的是, 时间在2020年1月15日前后, 土壤10 cm层实测温度只有-3 ℃左右, 而原方案模拟的土壤10 cm层温度达到-7 ℃以下, 方案一则改善了这种模拟的不准确性, 其模拟结果更加接近实测数据。在土壤20 cm以上的浅层, 实测土壤大约在12月上旬发生冻结, 方案一在浅层土壤发生冻结的时间上与实测吻合最好, 有效改进了原方案及方案二在浅层土壤冻结时间上的滞后。从图2中还可以发现, 时间在2019年6月25日前后原方案与方案二模拟的土壤5 cm层模拟值达到19 ℃左右, 此时实测温度只有15 ℃, 方案一对于夏季土壤浅层最高温度的模拟更加接近实测数据。
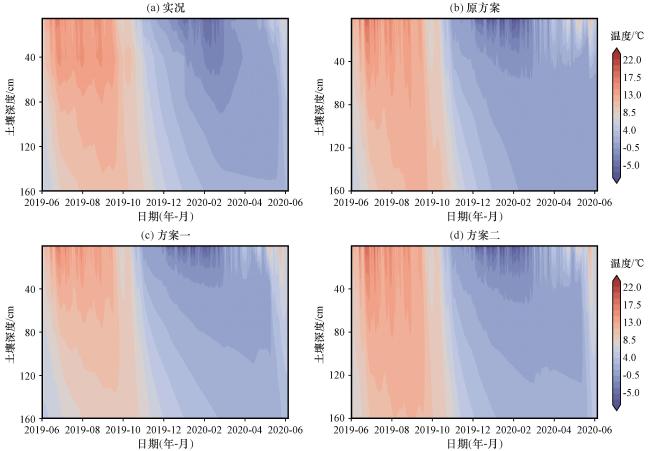
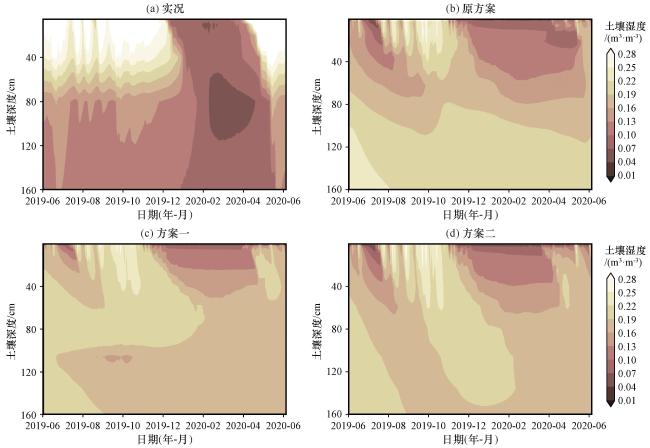
在垂直方向上(图3), 改进前后的土壤垂直离散化方案模拟的土壤温度都与实况吻合较好。夏季(6 -9月)土壤浅层温度高, 深层相对低, 冬季(12月至次年2月)土壤浅层温度低, 深层温度相对高。其中方案一对于夏季暖舌的模拟效果更准确, 与实测数据更贴近。
从统计量来看(表2), 尽管在不同层次上的模拟效果改善有所差异, 但整体上改进后的方案一与方案二的土壤温度模拟值与实测数据的相关性相较于原方案都有所提升, 主要表现在土壤浅层5 cm, 10 cm, 20 cm层。并且方案一与方案二的均方根误差相比于原方案均有所降低, 其中原方案的平均均方根误差为1.544 ℃, 方案一减小到1.439 ℃, 方案二减小到1.475 ℃。整体上, 方案一的模拟效果最佳。
表2 土壤温度模拟与观测比较Table 2 Comparison of simulation and observation of soil temperature |
| 统计量 | 方 案 | 0.05 m | 0.1 m | 0.2 m | 0.4 m | 0.8 m | 1.6 m | 平均 |
|---|---|---|---|---|---|---|---|---|
| R | 原方案 | 0.958 | 0.961 | 0.973 | 0.969 | 0.976 | 0.996 | 0.972 |
| 方案一 | 0.972 | 0.977 | 0.980 | 0.966 | 0.961 | 0.996 | 0.975 | |
| 方案二 | 0.962 | 0.967 | 0.976 | 0.977 | 0.972 | 0.972 | 0.972 | |
| RMSE/℃ | 原方案 | 2.084 | 1.920 | 1.485 | 1.680 | 1.252 | 0.845 | 1.544 |
| 方案一 | 1.611 | 1.450 | 1.407 | 1.895 | 1.450 | 0.821 | 1.439 | |
| 方案二 | 1.973 | 1.725 | 1.725 | 1.646 | 1.200 | 0.910 | 1.475 |
4.2 土壤湿度对比分析
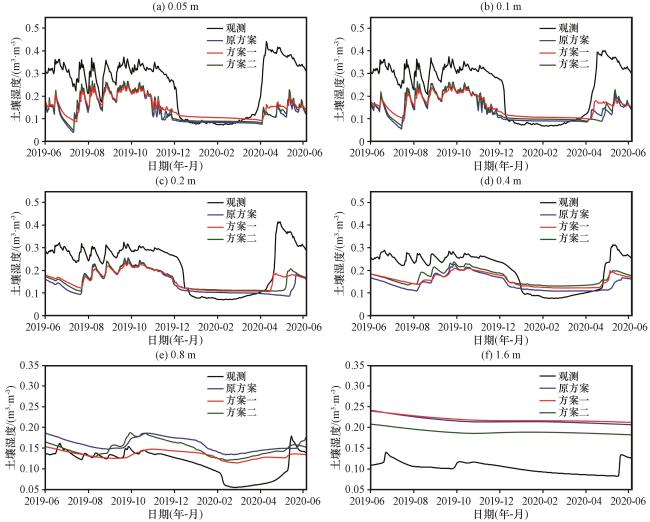
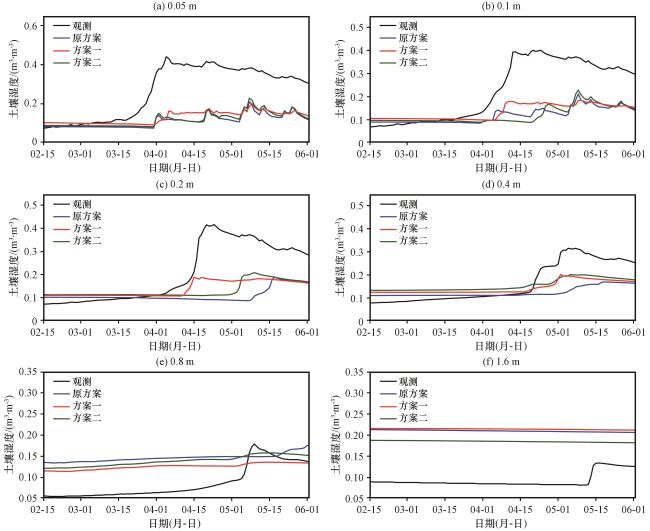
图4为改进前后的土壤垂直离散化方案对土壤湿度的模拟与站点实测数据对比图。三个方案均表现出对浅层土壤湿度的模拟较为准确, 能较好地刻画出浅层土壤湿度的季节变化, 在冬季土壤湿度低, 在夏季土壤湿度相对较高。随着土壤深度的增加, 降水对土壤湿度的影响越来越小, 模式对于深层土壤湿度的季节变化模拟效果相对不好, 峰谷值不能准确刻画。从图4中可以发现, 方案一与方案二相比于原方案对于土壤湿度变化趋势的模拟与实测数据更为吻合。特别表现为方案一在土壤层次为10 cm, 20 cm上, 时间在4 月10日前后进入融解转变期, 土壤湿度有一个明显增加的趋势, 原方案和方案二对于这一时期土壤湿度增加趋势的模拟明显滞后, 方案一对于这一变化趋势的模拟更贴近于实测数据。土壤层次在浅层5 cm, 10 cm, 20 cm上, 时间在2019年7月15日前后, 原方案和方案二对于夏季土壤湿度低值模拟偏低, 而方案一有效减少了这种模拟偏差。但在冬季土壤浅层5 cm, 10 cm, 20 cm上原方案对于土壤湿度的模拟值会更加贴近于实测数据, 方案一和方案二的模拟值偏高。
从垂直剖面图(图5)来看, 方案一, 方案二以及原方案都能较好地体现出浅层土壤湿度的垂直分布, 表现出夏季浅层土壤湿度高, 冬季浅层土壤湿度低的特点。对于土壤湿度中层和深层的垂直分布模拟相对较差。可以发现, 方案一相比于原方案和方案二在土壤湿度垂直分布的模拟上同样更贴近于实测数据, 特别表现在土壤层次80 cm以下, 方案一的模拟效果优于方案二和原方案。
从统计量来看(表3), 与原方案对比, 方案二在不同层次上的模拟效果改善有所差异, 但在整体上与实测数据的相关性有所提升, 方案一则是在各个层次上与实测数据的相关性均有所提升, 整体上的相关性由原来的0.616提升到0.724, 尤其是在浅中层的模拟效果提升明显。同时方案一和方案二相比于原方案的均方根误差均有所减小, 原方案的均方根误差为0.106 ℃, 方案一和方案二均减小到0.094 ℃。可以发现, 进行重新分层后的方案一和方案二均提升了土壤湿度的模拟效果, 其中方案一的模拟效果表现为最佳。
表3 土壤湿度模拟与观测比较Table 3 Comparison of simulation and observation of soil moisture content |
| 统计量 | 方 案 | 0.05 m | 0.1 m | 0.2 m | 0.4 m | 0.8 m | 1.6 m | 平均 |
|---|---|---|---|---|---|---|---|---|
| R | 原方案 | 0.621 | 0.659 | 0.534 | 0.708 | 0.702 | 0.473 | 0.616 |
| 方案一 | 0.684 | 0.788 | 0.819 | 0.852 | 0.712 | 0.490 | 0.724 | |
| 方案二 | 0.628 | 0.691 | 0.660 | 0.776 | 0.687 | 0.408 | 0.642 | |
| RMSE/℃ | 原方案 | 0.144 | 0.129 | 0.117 | 0.082 | 0.050 | 0.114 | 0.106 |
| 方案一 | 0.133 | 0.119 | 0.098 | 0.070 | 0.032 | 0.117 | 0.094 | |
| 方案二 | 0.139 | 0.127 | 0.105 | 0.066 | 0.042 | 0.088 | 0.094 |
4.3 通量对比分析
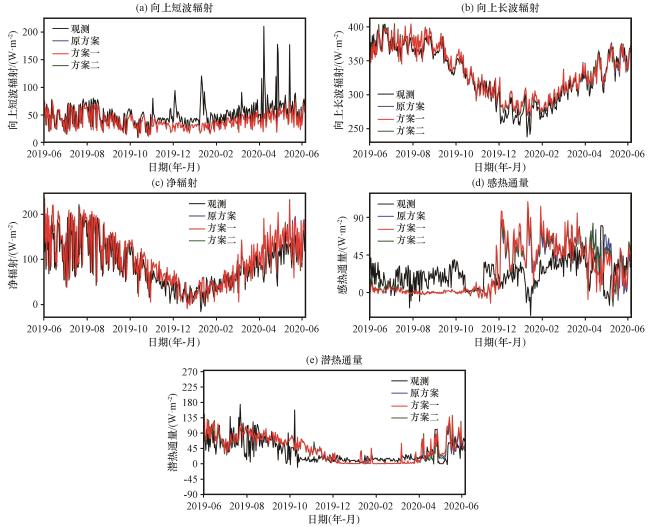
通过上述分析可以发现, 改进之后的方案一和方案二对于土壤水热有一定的改善效果, 特别是方案一改善效果明显, 那么可能会引起相应通量的变化。从各辐射通量的对比图[图6(a)~(c)]可以看出, 方案一和方案二与原方案相比模拟的辐射通量基本重合。相比于实测资料, 方案一与方案二和原方案对于向上短波辐射的模拟整体偏小, 不能很好地模拟出向上短波辐射的波峰。而同样跟实测对比, 改进前后的方案对于向上长波辐射的模拟整体偏大, 主要表现在冬季12月、 1月、 2月, 同时方案一与方案二与原方案的模拟结果相比只在夏季有细微的差别, 其中方案一更贴近于实测数据。对于净辐射, 方案一与方案二跟原方案的模拟效果差别不大, 都能较好地模拟出净辐射的变化趋势。
4.4 冻结期与消融期的土壤温度和土壤湿度对比
为了进一步探究改进前后土壤垂直离散化方案在土壤冻结期与消融期对土壤温度与湿度的模拟效果, 本文按照胥朋飞等(2022)界定土壤状态的方式将土壤各层定义为两个状态: 当日平均温度高于0 ℃时定义为非冻结阶段, 日平均温度低于0 ℃时定义为冻结阶段。将土壤各层由非冻结转变为冻结阶段的前10天与后10天之间界定为冻结转变期, 将土壤各层由冻结转变为非冻结阶段的前10天与后10天之间界定为融解转变期。同时选取2019年11月15日至2020年2月15日为冻结转变期, 2020年2月15日至6月1日为融解转变期, 对比分析改进前后土壤垂直离散化方案在冻结期与融解期对土壤水热的模拟效果。
通过冻结转变期改进前后土壤垂直离散化方案对土壤温度的模拟与站点实测数据对比(图7)可以发现, 在土壤浅层5 cm, 10 cm, 20 cm层, 原方案和方案二在冻结转变期对土壤温度的模拟都有幅度变化过大, 温度整体偏低的问题。方案一则改善了这种模拟的不准确性, 特别表现在土壤5 cm层和10 cm层进入冻结状态后, 方案一模拟的土壤温度曲线变化趋势与数值大小都更接近于实测数据。从图7中还可以看出, 改进前后的土壤垂直离散化方案模拟的土壤各层温度在进入冻结状态的日期要早于实测土壤各层温度进入冻结状态的日期。特别是在土壤80 cm层, 对于土壤温度小于0 ℃进入冻结状态, 原方案的模拟时间提前了一个月左右, 而方案一和方案二对土壤80 cm层由非冻结状态转变为冻结状态的日期模拟更加合理, 并且从土壤各个层次来看, 方案一的模拟更加接近实测温度第一次降到0 ℃以下进入冻结状态的日期。尽管从土壤浅层看, 改进后的方案一和方案二模拟的土壤温度小于0 ℃进入冻结状态的日期同样早于实测小于0 ℃进入冻结状态的日期, 但从整体上看, 改进后的方案一模拟效果有所改善。图8为冻结转变期改进前后土壤垂直离散化方案对土壤湿度的模拟与站点实测数据对比图。在土壤浅层, 12月上旬左右土壤湿度有一明显下降趋势, 改进前后方案对这一趋势的模拟明显提前。
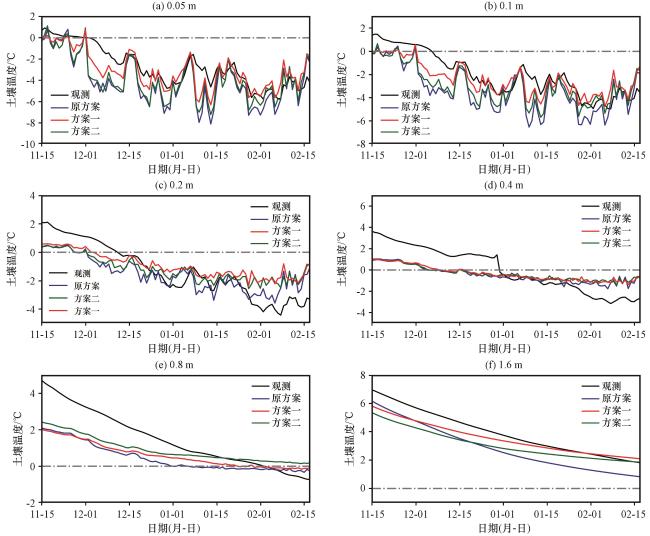
图7 冻结转变期土壤温度新旧方案对比灰色点虚线为0 ℃线 Fig.7 Comparison of old and new schemes on soil temperature during freezing transition period.The gray dotted line is the 0 ℃ line |
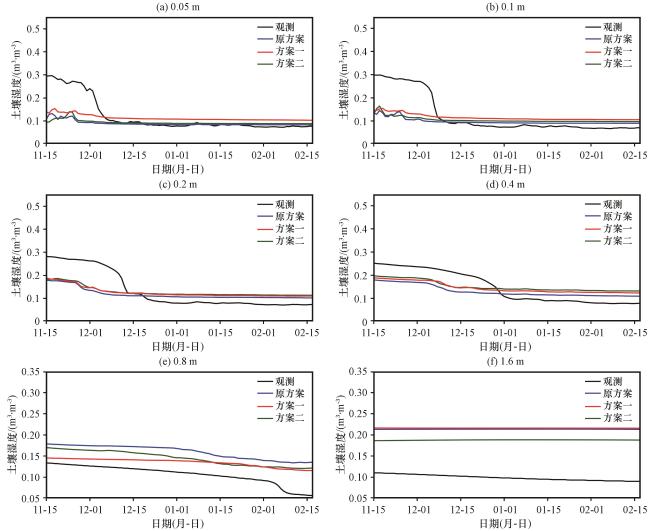
图9为消融转变期改进前后土壤垂直离散化方案对土壤温度的模拟与站点实测数据对比图。从图9中可以发现, 方案一与方案二对于土壤进入非冻结状态之后的土壤温度曲线变化趋势与数值大小模拟效果更好, 并且方案一的模拟结果最为准确。在土壤中层40 cm层, 原方案和方案二对于土壤由冻结状态进入非冻结状态的模拟日期明显提前, 而方案一对于这一层土壤发生消融的判定更加合理。图10为消融转变期改进前后土壤垂直离散化方案对土壤湿度的模拟与站点实测数据对比图。从图10中可以发现, 时间在4月10日前后土壤10 cm层, 土壤湿度有一明显增加的趋势, 方案一对这一趋势的模拟和实测数据更为吻合。同样在4月15日前后土壤20 cm层土壤发生消融进入非冻结状态, 土壤湿度明显增加, 而原方案和方案二对于这一趋势的模拟明显滞后, 方案一对此判定更加合理。从整体上看, 在土壤浅中层进入非冻结状态之后方案一对于土壤湿度的模拟与实测数据在数值大小上更为接近, 但依旧存在偏差。
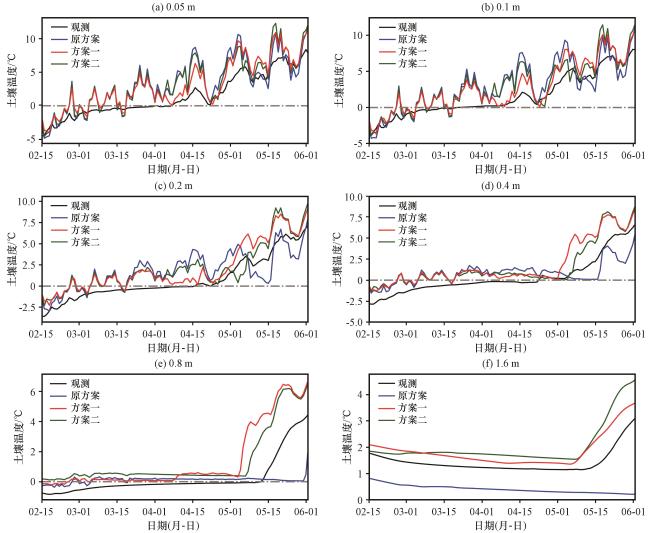
图9 融解转变期土壤温度新旧方案对比灰色点虚线为0 ℃线 Fig.9 Comparison of old and new schemes on soil temperature during melting transition period.The gray dotted line is the 0 ℃ line |
5 讨论
研究表明土壤温度是降水、 辐射、 蒸发综合作用的结果(Wen et al, 2014), 水分入渗不仅会直接降低土壤温度, 还对热量的传导过程存在一定的影响; 同时, 降水也是土壤湿度的主要来源, 土壤湿度的变化随降水的发生而波动(Zhu et al, 2019)。因此, 模式对于土壤水分的准确估计尤为重要。在本试验的3种不同土壤垂直离散化方案中, 方案一与原方案对比, 在相同的土壤深度下, 土壤分层更密集细致; 方案一与方案二对比, 土壤层次相同, 方案一在浅中层拥有更密集的土壤分层, 总体上, 方案一的土壤垂直离散化方案更密集细致。从模拟结果来看, 方案一对土壤温、 湿度的模拟效果改善最好, 对土壤各层温、 湿度的数值大小与曲线变化趋势的模拟效果均有了一定的提升, 特别表现在土壤浅中层。这是由于密集细致的土壤分层有利于土壤水分的准确估计, 从而对于提升模式对土壤水热输送的模拟能力有一定的积极影响。
本文还需要改进的几处地方: (1)本文验证改进前后的土壤垂直离散化方案的效果只是简单对若尔盖单站的模拟结果进行了对比分析, 在之后的工作中可以进一步探究改进前后土壤垂直离散化方案对于整个青藏高原的模拟效果来检验方案的可适用性; (2)在土壤深层, 改进前后的土壤垂直离散化方案对于湿度的模拟效果还有待改善, 并且有研究者发现在青藏高原地区, 土壤质地对于土壤温度和湿度模拟可能存在较大的影响(孙少波等, 2017; 马翠丽等, 2020; 刘宜纲等, 2022), 因此在之后的研究中可以继续探究土壤质地对土壤水热输送的影响。
6 结论
陆面模式中的最优土壤分层仍不确定, 但统一认为: 受大气-地面界面影响较大的土壤表层应该考虑细分, 深度越深, 土壤层分层的厚度可以加大。因此在BCC_AVIM模式中原分层方案为10层的基础上, 将土壤各层的节点深度, 土壤层厚度以及土壤各层的界面深度进行插值, 由10层土壤层插值到20层, 在本文中称为方案一; 参考模式CLM5.0中的土壤分层方式并改进到BCC_AVIM中, 原土壤层次也由10层增加到20层, 为本文的方案二。通过改进前后的土壤垂直离散化方案分别模拟若尔盖站单点数据, 得到以下的结论:
(1) 方案一、 方案二以及原方案都能较为准确地模拟出土壤各层次的温度。方案一和方案二相较于原方案对土壤温度的模拟效果有所提升, 特别是方案一对于土壤各层温度的数值大小与曲线变化趋势的模拟效果提升明显, 主要表现在土壤的浅层。
(2) 方案一、 方案二以及原方案都能较好地反映出浅层土壤湿度的垂直分布, 对于中层和深层土壤湿度的模拟相对较差。表现出夏季浅层土壤湿度高, 冬季浅层土壤湿度低的特点。并且方案一和方案二相较于原方案整体上对于土壤各层湿度的数值大小与曲线变化趋势的模拟效果均有了一定的提升。整体上, 方案一的模拟效果最佳。
(3) 对于辐射通量来说, 改进后的方案一和方案二的模拟结果与原方案变化不大, 模式改进前后方案对于感热通量的模拟效果较差, 对于潜热通量的模拟效果相对较好, 整体上, 改进后的方案一和方案二与原方案相比对于感热、 潜热通量的模拟趋势一致, 只在个别时段表现出细微差别。
(4) 在冻结转变期, 方案一相比于方案二和原方案对于土壤各层是否发生冻结的时间判定更合理, 更加接近实测数据, 并且在进入冻结状态后, 对于土壤温度模拟的变化趋势与最低温度都更接近于实测数据。在消融转变期, 方案一对于土壤浅层进入非冻结状态之后的土壤温度与土壤湿度的数值大小与曲线变化趋势的模拟都要更加准确, 效果更好。