
1 引言
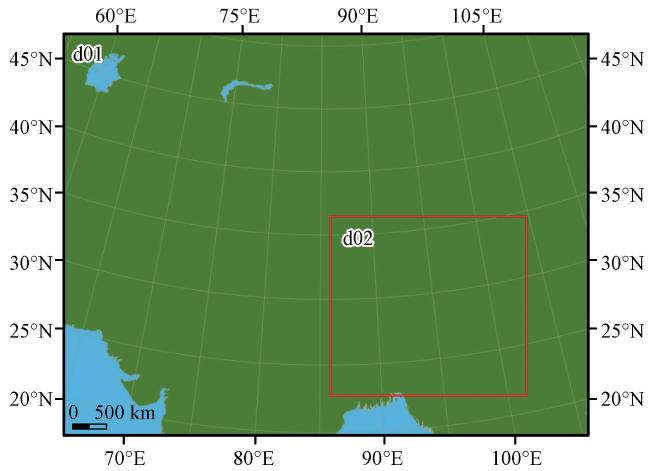
2 资料来源与试验方案
表1 模式物理过程参数化方案Table 1 Physical parameterization schemes selection in models |
| 序号 | 参数化方案 | 外层区域 | 内层区域 |
|---|---|---|---|
| 1 | 积云参数化方案 | New Grell scheme | 无 |
| 2 | 微物理方案 | WSM 3-class simple ice scheme | WSM 3-class simple ice scheme |
| 3 | 长波辐射方案 | rrtm scheme | rrtm scheme |
| 4 | 短波辐射方案 | Dudhia scheme | Dudhia scheme |
| 5 | 边界层方案 | YSU scheme | YSU scheme |
3 方法介绍
3.1 BGM法和LBGM法
3.2 降水检验方法
4 强降水过程分析及模拟
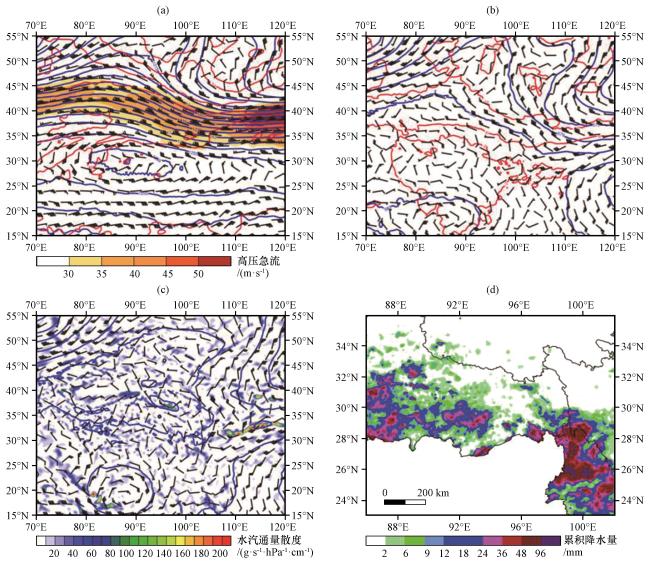
图2 2014年7月12日08:00 200 hPa位势高度场(蓝色等值线, 单位: dagpm), 风场(风羽, 长横线代表4 m·s-1, 单位: m·s-1), 温度场(红色等值线, 单位: ℃), 高空急流(彩色区, 单位: m·s-1)(a); 500 hPa位势高度场(蓝紫色等值线, 单位: dagpm)、 风场(风羽, 长横线代表4 m·s-1)和温度场(红色等值线, 单位: ℃)(b); 700 hPa位势高度场(蓝色等值线, 单位: dagpm)、 风场(风羽, 长横线代表4 m·s-1)和水汽通量散度(彩色区, 单位: g·s-1·hPa-1·cm-1)(c); 以及12日14:00至13日14:00 24 h观测累积降水量(d, 彩色区, 单位: mm)Fig.2 Geopotential height (blue contours, unit: dagpm), wind field (barb, unit: m·s-1, full barb denotes 4 m·s-1, unit: m·s-1), temperature (red contours, units: ℃), upper-level jet (color area, unit: m·s-1) at 200 hPa (a), geopotential height (blue contours, unit: dagpm), wind field and temperature at 500 hPa (b), geopotential height (blue contours, unit: dagpm), wind field (barb, unit: m·s-1, full barb denotes 4 m·s-1) and water vapor flux (color area, units: g·s-1·hPa-1·cm-1) at 700 hPa (c) at 08:00 on 12 July 2014, and the 24-hour accumulated precipitation from 14:00 on 12 to 14:00 on 13 July 2021 for the observations (d, color area, unit: mm) |

图3 2014年7月12日14:00至13日14:00基于BGM法控制预报(control)及扰动预报(e001~e015)累积降水量(彩色区, 单位: mm)Fig.3 24-hour accumulated precipitation forecast (color area, unit: mm) based on BGM method control forecast (control) and perturbation forecast members (e001~e015) from 14:00 on 12 to 14:00 on 13 July 2014 |
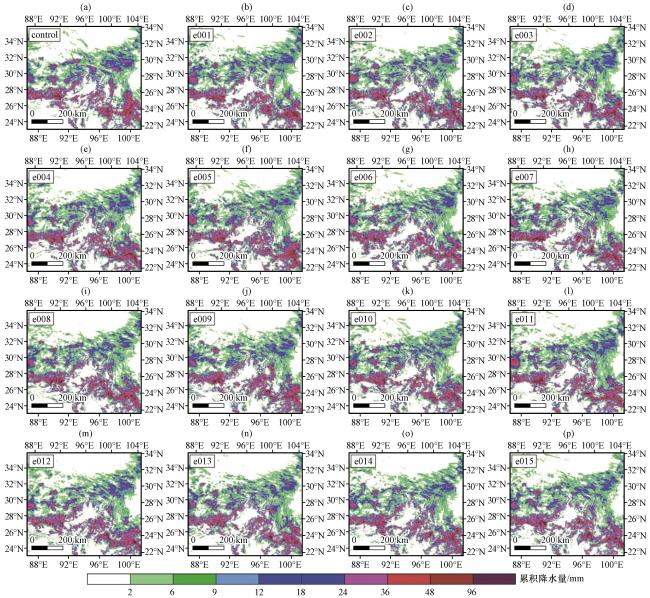
图4 2014年7月12日14:00至13日14:00基于LBGM法控制预报(control)及扰动预报(e001~e015)累积降水量(彩色区, 单位: mm)Fig.4 24-hour accumulated precipitation forecast (color area, unit: mm) based on LBGM method control forecast (control) and perturbation forecast members (e001~e015) from 14:00 on 12 to 14:00 on 13 July 2014 |
5 集合预报结果评估及扰动演变分析
5.1 预报结果

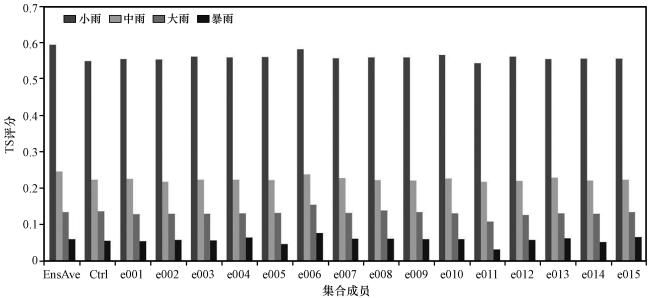
图5 基于BGM和LBGM法的集合平均预报(BGM-EM和LBGM-EM)、 控制预报(BGM-CON和LBGM-CON)2014年7月12日14:00至13日14:00 24 h累计降水量TS评分(a)、 空报率FAR(b)、 漏报率MAR(c)及Bias评分(d)Fig.5 TS scores (a)、 FAR (b)、 MAR (c)、 Bias scores (d) of ensemble mean forecasts based on BGM and LBGM methods (BGM-EM and LBGM-EM) and control forecasts based on BGM and LBGM methods (BGM-CON and LBGM-CON) cumulative precipitation for 24 hours from 14:00 on 12 to 14:00 on 13 July 2014 |
5.2 MODE评估

图8 2014年7月12日20:00观测场(a)与预报场(b、 c)的降水目标空间匹配情况Fig.8 Spatial matching of precipitation targets between observation field (a) and forecast field (b, c) at 20:00 on 12 July 2014 |
表2 2014年7月12日20:00基于BGM-EPS和LBGM-EPS模式降水集合预报MODE检验的空间诊断量值Table 2 The spatial diagnostic value of the MODE test based on BGM-EPS and LBGM-EPS model precipitation ensemble forecast at 20:00 on 12 July 2014 |
| 诊断量 | BGM-EPS | LBGM-EPS | ||||
|---|---|---|---|---|---|---|
| 目标1 | 目标2 | 目标3 | 目标1 | 目标2 | 目标3 | |
| 面积比 | 0.755 | 0.645 | 0.114 | 0.670 | 0.874 | 0.276 |
| 轴角差 | 8.640 | 170.332 | 35.067 | 31.496 | 0.279 | 36.405 |
| 重叠面积比 | 0.312 | 0.057 | 0.085 | 0.275 | 0.002 | 0.396 |
| 质心距离 | 0.622 | 1.862 | 1.002 | 0.334 | 1.517 | 0.617 |
| 整体相似度 | 0.917 | 0.623 | 0.675 | 0.888 | 0.735 | 0.821 |

