
1 引言
2 资料来源与方法介绍
2.1 资料来源
2.2 极端降水指数定义方法
2.3 旋转经验正交函数分解
2.4 HYSPLIT-4模式
3 极端降水时空分布
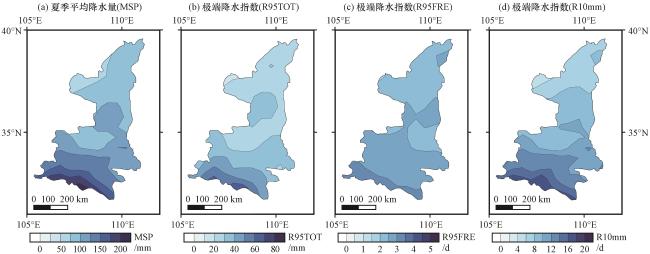
图2 1979 -2021年夏季平均降水量(MSP)(a, 单位: mm)、 夏季极端降水指数R95TOT(b, 单位: mm)、 R95FRE(c, 单位: d)和R10mm(d, 单位: d)的空间分布Fig.2 The spatial distribution of mean summer precipitation (MSP) (a, unit: mm), extreme summer precipitation R95TOT (b, unit: mm), R95FRE (c, unit: d) and R10mm (d, unit: d) from 1979 to 2021 |
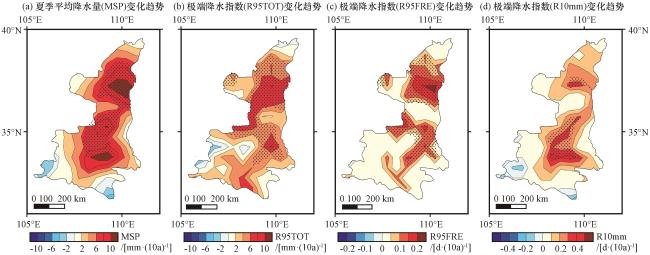
图3 1979 -2021年夏季平均降水量(MSP) [a, 单位: mm·(10a)-1]、 夏季极端降水指数R95TOT [b, 单位: mm·(10a)-1]、 R95FRE [c, 单位: d·(10a)-1]和R10mm [d, 单位: d·(10a)-1]变化趋势的空间分布Fig.3 The spatial distribution of mean summer precipitation trend (MSP) [a, unit: mm·(10a)-1], extreme summer precipitation trend R95TOT [b, unit: mm·(10a)-1], R95FRE [ c, unit: d·(10a)-1] and R10mm [ a, unit: d·(10a)-1] from 1979 to 2021 |
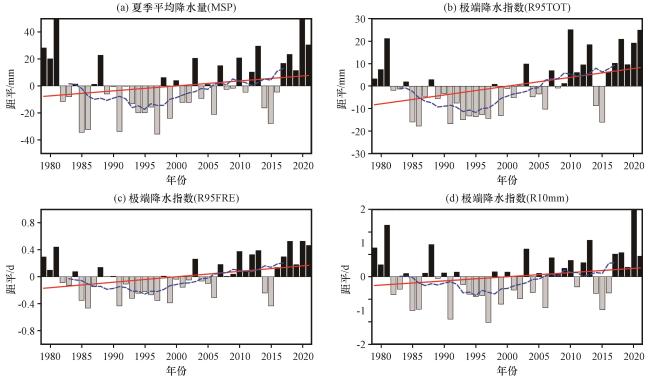
图4 1979 -2021年夏季平均降水量(MSP)距平的年际变化(a, 单位: mm), 夏季极端降水指数R95TOT距平(b, 单位: mm)、 R95FRE距平 (c, 单位: d), R10mm距平(d, 单位: d)的年际变化红线为变化趋势, 蓝色虚线为9年滑动平均线 Fig.4 The interannual variation of mean summer precipitation (MSP) anomaly (a, unit: mm), extreme summer precipitation R95TOT anomaly (b, unit: mm), R95FRE anomaly (c, unit: d) and R10mm anomaly (d, unit: d) from 1979 to 2021.The red line is the trend and the dashed blue line is the 9-year moving average |

4 水汽输送路径

5 极端降水大气环流形势分析
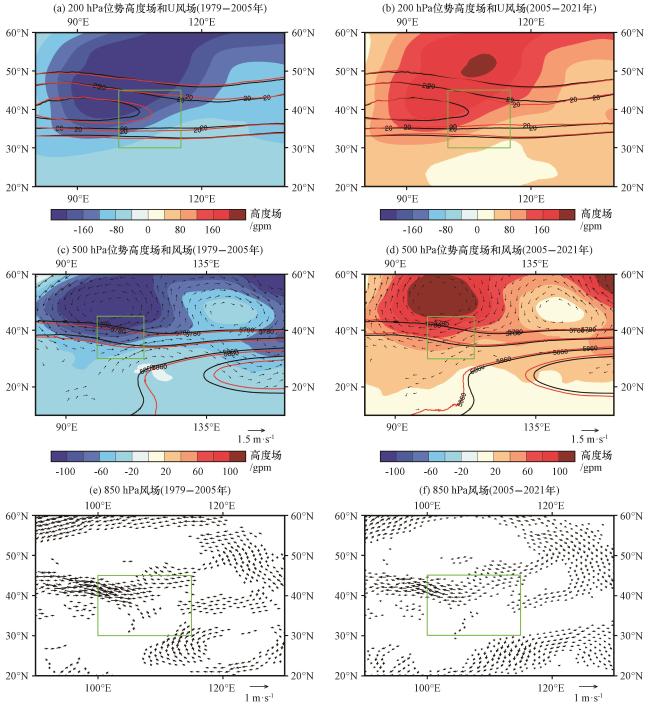
图7 1979 -2005年(a)、 2005 -2021年(b)与1980 -2020年在200 hPa高度场(彩色区, 单位: gpm)和U风(等值线, 单位: m·s-1)的差值场, 1979 -2005年(c)、 2005 -2021年(d)与1980 -2020年在500 hPa高度场(彩色区, 单位: gpm)和风场(矢量, 单位: m·s-1)的差值场, 1979 -2005年(e)、 2005 -2021年(f)分别与1980 -2020年在850 hPa风场(矢量, 单位: m·s-1)的差值场图7(a)和(b)中红线代表2005年前、 后时间段U风≥20 m·s-1, 黑线是气候态(U风); 图7(c)和(d)中红线代表2005年前、 后时间段5780~5900 gpm等值线, 黑线是气候态(5780~5900 gpm等值线); 绿色方框代表研究区域(陕西省) Fig.7 The differences of the geopential height (color area, unit: gpm) and zonal wind (contour, unit: m·s-1) at 200 hPa between 1979 -2005 and 1980 -2020 (a), 2005 -2021 and 1980 -2020 (b), respectively.The differences of the geopential height (color area, unit: gpm) and horizonal wind (vector, unit: m·s-1) at 500 hPa between 1979 -2005 and 1980 -2020 (c), 2005 -2021 and 1980-2020 (d), respectively.The differences of the horizonal wind (units: m·s-1) at 850 hPa between 1979 -2005 and 1980 -2020 (e) and between 2005 -2021 and 1980 -2020 (f), respectively.In Fig.7(a) and (b), The red line represents the U wind≥20 m·s-1 in the period before and after 2005, and the black line is the climate state (U wind≥20 m·s-1).In Fig.7(c) and (d), The red line represents the 5780~5900 gpm contours in the period before and after 2005, and the black line is the climate state (5780~5900 gpm contours).The green box represents the study area (Shaanxi Province) |