
1 引言
2 研究区域、 数据来源与研究方法
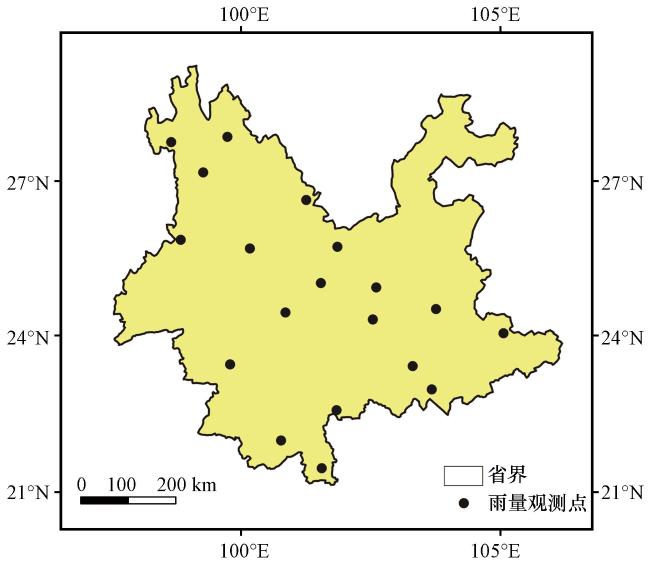
2.1 研究区域
2.2 数据来源
表1 多源降水数据源的详细信息Table 1 Specific information of multi-source rainfall data |
| 降水数据 | 时空分辨率 | 时间跨度 | 范围 | 数据来源 |
|---|---|---|---|---|
| 3B42V7 | 3 h/0.25° | 1998年1月至今 | 50°S -50°N | GES DISC |
| IMERG | 0.5 h/0.1° | 2000年6月至今 | 90°S -90°N | GES DISC |
| GSMaP | 24 h/0.1° | 2014年4月至今 | 60°S -60°N | JAXA |
| CBLD | 24 h/0.25° | 1998年1月至今 | 90°S -90°N | Joyce et al, 2004 |
| PCDR | 24 h/0.25° | 1983年1月至今 | 60°S -60°N | CHRS |
| 雨量计数据 | 12 h/不规则分布的点 | 1951年至今 | 中国 | 中国气象数据服务中心 |
2.3 研究方法
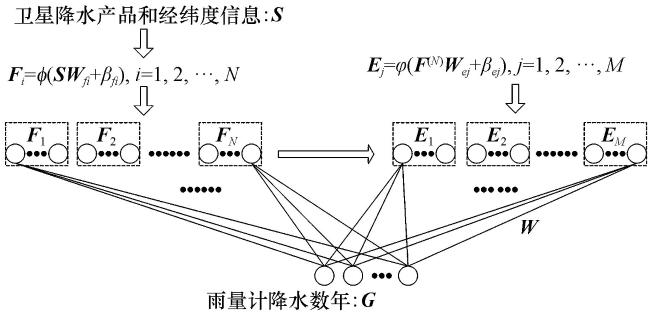
2.3.1 基于宽度学习的多源降水数据融合技术
2.3.2 统计指标
2.3.3 验证融合模型的方法
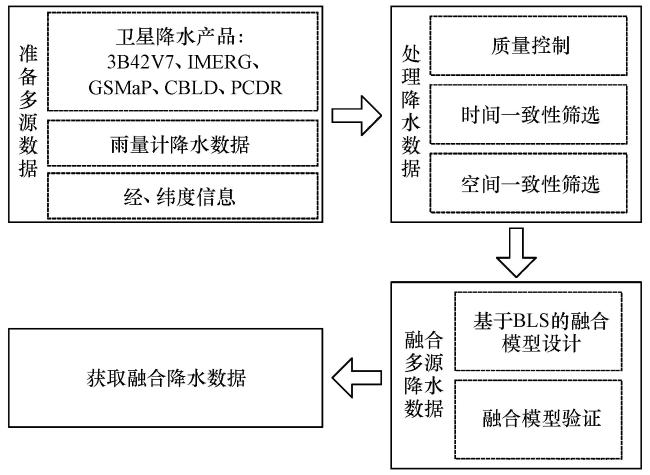
2.3.4 基于宽度学习的多源降水数据融合方法的流程
3 基于宽度学习的多源降水融合方法的表现
表2 留一年验证方法中的日平均统计指标Table 2 The daily mean statistical metrics of assimilating rainfall data in LOYOCV |
| 年份 | 降水产品 (序号) | CC | RMSE /mm | MAE /mm | NSE |
|---|---|---|---|---|---|
| 2014 | 3B42V7(1) | 0.676 | 6.659 | 2.784 | 0.369 |
| IMERG(2) | 0.724 | 6.214 | 2.377 | 0.455 | |
| GSMaP(3) | 0.660 | 6.738 | 2.556 | 0.324 | |
| CBLD(4) | 0.820 | 4.717 | 1.918 | 0.652 | |
| PCDR(5) | 0.416 | 8.651 | 3.661 | -0.200 | |
| BLS(6) | 0.833 | 4.600 | 1.834 | 0.687 | |
| 2015 | 3B42V7(1) | 0.704 | 6.657 | 2.830 | 0.341 |
| IMERG(2) | 0.731 | 6.217 | 2.471 | 0.465 | |
| GSMaP(3) | 0.660 | 7.187 | 2.725 | 0.233 | |
| CBLD(4) | 0.848 | 4.336 | 1.799 | 0.665 | |
| PCDR(5) | 0.505 | 8.084 | 3.530 | -0.063 | |
| BLS(6) | 0.853 | 4.324 | 1.769 | 0.684 | |
| 2016 | 3B42V7(1) | 0.630 | 6.828 | 2.967 | 0.256 |
| IMERG(2) | 0.661 | 6.672 | 2.555 | 0.282 | |
| GSMaP(3) | 0.582 | 7.377 | 2.793 | 0.138 | |
| CBLD(4) | 0.825 | 4.539 | 2.000 | 0.650 | |
| PCDR(5) | 0.437 | 8.045 | 3.584 | -0.056 | |
| BLS(6) | 0.831 | 4.505 | 1.976 | 0.671 | |
| 2017 | 3B42V7(1) | 0.621 | 6.934 | 3.092 | 0.242 |
| IMERG(2) | 0.647 | 6.749 | 2.704 | 0.306 | |
| GSMaP(3) | 0.603 | 7.214 | 2.863 | 0.141 | |
| CBLD(4) | 0.818 | 4.560 | 2.063 | 0.638 | |
| PCDR(5) | 0.454 | 8.132 | 3.660 | -0.062 | |
| SVM | 0.638 | 6.887 | 2.498 | 0.303 | |
| BLS(6) | 0.839 | 4.216 | 1.924 | 0.692 | |
| BLS-N | 0.831 | 4.479 | 2.022 | 0.664 | |
| BLS-Stability | 0.826 | 4.374 | 2.000 | 0.676 |
表中黑体代表最优统计指标; BL-N代表融合数据源中未加入经纬度信息; BLS-Stability代表使用更少样本加入到融合网络中 |
3.1 融合降水数据在时间尺度上的表现
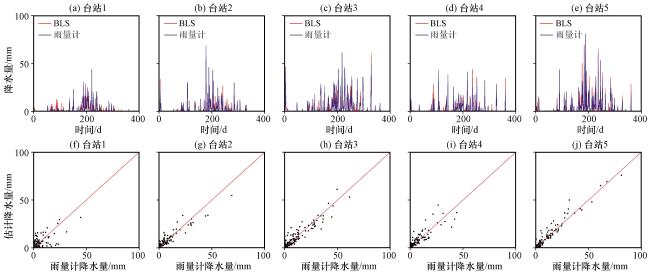
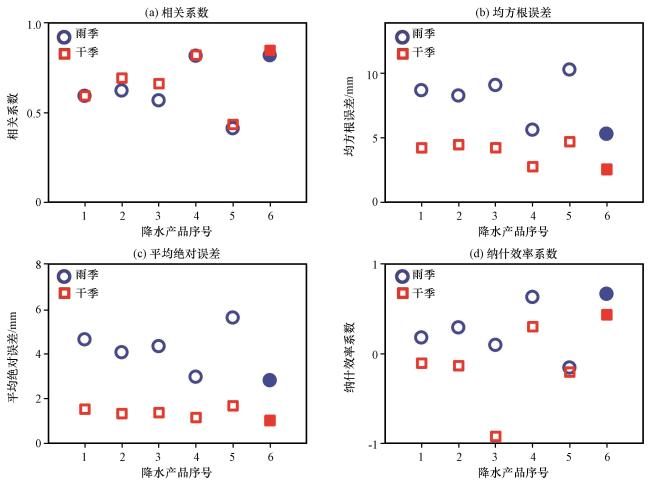
图5 融合降水在雨季和干季的CC(a), RMSE(b), MAE(c), NSE(d)与其他5个卫星降水产品相应的统计指标对比横轴的1~6分别代表3B42V7、 IMERG、 GSMaP、 CBLD、 PCDR、 BLS; 实心符号代表最优统计指标 Fig.5 The comparison of assimilating rainfall data and satellite-based rainfall data on CC (a), RMSE (b), MAE (c), NSE (d) in rainy season and dry season.The numbers of 1~6 on the horizontal axis stand for 3B42V7, IMERG, GSMaP, CBLD, PCDR, and BLS-based precipitation products; The solid symbol stands for the optimal statistical metrics |
3.2 融合降水数据在空间尺度上的表现
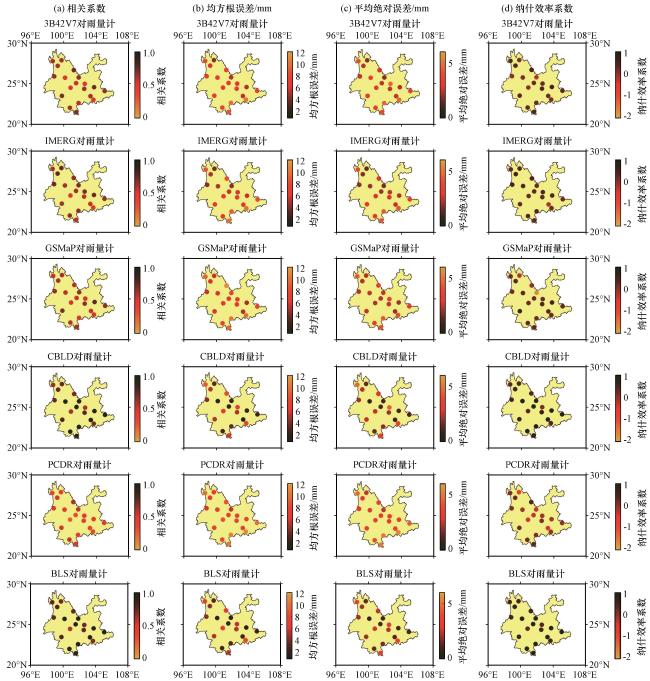
图6 卫星降水产品和融合降水数据在每一个台站对应的CC(a), RMSE(b, 单位: mm), MAE(c, 单位: mm), NSE(d)的空间分布图中圆点的颜色越深表示该测站的估计的降水量越准确 Fig.6 The spatial distribution of CC (a), RMSE (b, unit: mm), MAE (c, unit: mm), NSE (d) at each site of satellite-based and BLS-based rainfall data.The darker the color of the dots, the more accurate the estimated precipitation at the corresponding gauge stations |
表3 各个降水产品获得优异统计指标的台站数Table 3 The number of sites corresponding to satellite-based and BLS-based rainfall data with the best statistical metric |
| 降水产品/统计指标 | 3B42V7 | IMERG | GSMaP | CBLD | PCDR | BLS |
|---|---|---|---|---|---|---|
| CC | 0 | 0 | 0 | 4 | 0 | 15 |
| RMSE | 0 | 0 | 0 | 3 | 0 | 16 |
| MAE | 0 | 5 | 1 | 5 | 0 | 8 |
| NSE | 0 | 0 | 0 | 3 | 0 | 16 |
加黑字体代表最多台站数 |
4 讨论
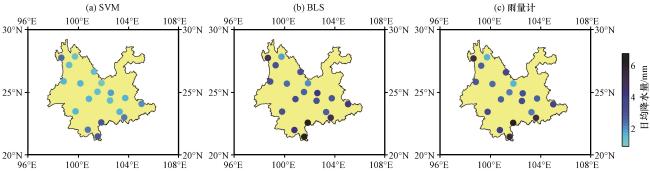
4.1 与SVM融合降水对比
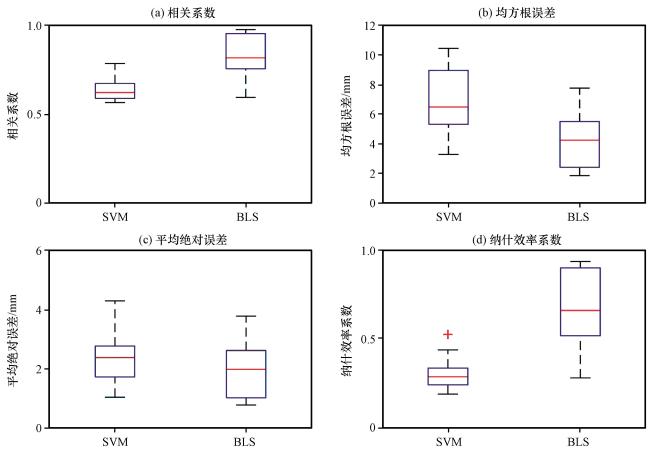
图7 基于SVM和BLS融合降水的CC(a), RMSE(b), MAE(c), NSE(d)的箱线图Fig.7 The boxplot of CC (a), RMSE (b), MAE (c), NSE (d) of SVM- and BLS-based rainfall estimates |
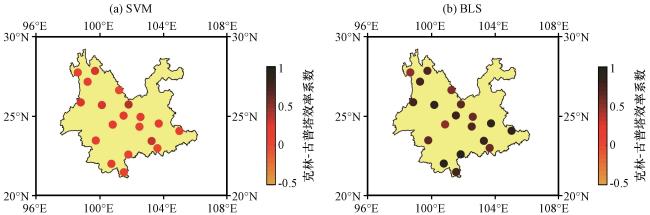
图8 基于SVM(a)和BLS(b)的融合模型的2017年在每一个台站的日降水量估计的KGE的空间分布Fig.8 Spatial distribution of KGE estimated by daily rainfall based on SVM (a) and BLS (b) daily rainfall estimates at each site in 2017 |
4.2 基于BLS与深度学习网络的降水融合模型对比
表4 基于BLS和DNN的多源降水融合网络的效率对比Table 4 Efficiency comparison of assimilating multi-source precipitation based on BLS and DNN |
| 融合方法 | 训练时间/s | RMSE/mm |
|---|---|---|
| DNN1 | 3.101 | 4.922 |
| DNN2 | 6.714 | 4.829 |
| BLS | 0.372 | 4.216 |
4.3 经纬度信息在融合模型中的作用
4.4 基于BLS的多源降水融合模型稳定性和泛化性分析
表5 各个降水产品在某一个台站的2017年的日统计指标Table 5 Daily statistical indicators of six precipitation products at one site in 2017 |
| 降水产品 | CC | RMSE/mm | MAE/mm | NSE |
|---|---|---|---|---|
| 3B42V7 | 0.632 | 4.371 | 1.800 | 0.141 |
| IMERG | 0.725 | 3.775 | 1.406 | 0.359 |
| GSMaP | 0.618 | 5.330 | 2.162 | -0.277 |
| CBLD | 0.724 | 3.319 | 1.418 | 0.505 |
| PCDR | 0.439 | 6.328 | 2.551 | -0.800 |
| BLS | 0.754 | 3.136 | 1.192 | 0.558 |
加黑字体表示最优统计指标 |