论文

黄土高原表层土壤湿度与降水关系的分析

  • 廖慧仁 ,
  • 黄倩 ,
  • 王梦圆 ,
  • 王瑞 ,
  • 张君霞 ,
  • 张永鹏 ,
  • 郭坤
展开
  • 1. 兰州大学大气科学学院半干旱气候变化教育部重点实验室,甘肃 兰州 730000
    2. 兰州中心气象台,甘肃 兰州 730020

廖慧仁(1999 -), 男, 广西贺州人, 硕士研究生, 主要从事大气边界层和陆气相互作用的研究. E-mail:

收稿日期: 2023-06-12

  修回日期: 2023-09-12

  网络出版日期: 2023-09-12

基金资助

国家自然科学基金项目(42175088); 甘肃省自然科学基金青年科技基金计划项目(22JR5RA514); 干旱气象科学研究基金项目(IAM202206)

Analysis of the Relationship between Surface Soil Moisture and Precipitation over the Loess Plateau

  • Huiren LIAO ,
  • Qian HUANG ,
  • Mengyuan WANG ,
  • Rui WANG ,
  • Junxia ZHANG ,
  • Yongpeng ZHANG ,
  • Kun GUO
Expand
  • 1. Key Laboratory for Semi-Arid Climate Change of the Ministry of Education,College of Atmospheric Sciences,Lanzhou University,Lanzhou 730000,Gansu,China
    2. Lanzhou Central Meteorological Observatory,Lanzhou 730020,Gansu,China

Received date: 2023-06-12

  Revised date: 2023-09-12

  Online published: 2023-09-12

摘要

使用黄土高原气象台站的土壤湿度和降水观测资料以及GLDAS和CMFD再分析资料, 分析黄土高原地区土壤湿度与降水量的时空分布及变化特征, 通过回归分析、 格兰杰因果检验和奇异值分解(Singular value decomposition, SVD), 研究土壤湿度与降水之间的关系, 分析初始土壤湿度影响随后降水的时间尺度与空间范围。结果显示: 黄土高原的土壤湿度与随后1~2个月降水回归分析的解释方差相对较高, 较大值在夏秋季节(7 -10月), 黄土高原不同区域(I区、 II区和III区)的土壤湿度与随后21天降水相关的时间较全区域的多, 时间较集中, 说明黄土高原土壤湿度分布不均匀, 不同区域差别较大, 较大的滞后降水时间尺度适用于较大空间范围的分析。格兰杰因果检验表明黄土高原全区域秋季(10月、 11月)的初始土壤湿度对随后1个月或2个月的降水有显著影响, 在III区8月土壤湿度对10月的降水也有显著影响, 这与回归分析的结果一致。再分析资料的SVD分解的结果显示, 1979 -2014年7月黄土高原中部、 北部和东部土壤较湿润时, 8月西部和北部边缘的降水偏多; 9月东部的土壤偏湿润, 则10月黄土高原西部以及南北部的一些地区降水偏多。土壤湿度与降水的显著相关区域重叠部分较少, 说明黄土高原土壤湿度对降水的影响存在一定程度的时空不对称性。

本文引用格式

廖慧仁 , 黄倩 , 王梦圆 , 王瑞 , 张君霞 , 张永鹏 , 郭坤 . 黄土高原表层土壤湿度与降水关系的分析[J]. 高原气象, 2024 , 43(3) : 549 -560 . DOI: 10.7522/j.issn.1000-0534.2023.00075

Abstract

Observed soil moisture and precipitation as well as GLDAS and CMFD reanalysis data are used to analyze the spatial and temporal distribution and variation trend in the Loess Plateau region.Regression analysis, Granger causality test and singular value decomposition (SVD) are used to study the relationship between soil moisture and precipitation, and to analyze the temporal scale and spatial range of the influence of initial soil moisture on subsequent precipitation.The results show that the explained variance of the regression analysis of soil moisture and subsequent 1~2 months precipitation on the Loess Plateau is relatively high, with larger values in the summer and fall seasons (July, August, September, and October).That the correlation between soil moisture and the subsequent 21 days of precipitation in different regions of the Loess Plateau (zones I, II, and III) is more frequent and concentrated than that in the whole region.This indicates that soil moisture on the Loess Plateau is heterogeneous so that a larger lagged precipitation time scale is just suitable for analysis at larger spatial scales.The Granger causality test shows that the initial soil moisture in the fall (October and November) across the Loess Plateau has a significant effect on the precipitation in the following 1 or 2 months, and the soil moisture in August also has a significant effect on the precipitation in October in Area III, which is consistent with the results of the regression analysis.The result of the SVD decomposition shows that from 1979 to 2014, when soils in the central, northern, and eastern parts of the Loess Plateau are wetter in July, the precipitation in the western and northern margins of the plateau is accordingly more in August.A wetter soil in the eastern part of the plateau in September means more precipitation in the western part of the plateau, as well as some parts of the northern and southern parts of the plateau, in October.The significant correlation between soil moisture and precipitation has fewer overlapping regions, suggesting spatial and temporal asymmetry in the influence of soil moisture on precipitation on the Loess Plateau.

1 引言

陆地-大气相互作用直接或间接影响天气系统的发生、 发展与演变, 进而对气候和环境产生重要影响(Meehl, 1994; Koster et al, 2006; Santanello et al, 2013; Wu et al, 2013; 刘维成等, 2021)。陆面水分过程是陆面过程的重要组成部分, 影响区域水分循环和水资源分布, 是气候系统的关键环节之一, 并且对全球气候变化的响应十分敏感(张强和王胜, 2007; 林朝晖等, 2008; Seneviratne et al, 2010)。
土壤湿度是地球系统中缓慢变化的组成部分, 作为陆面过程的重要参量, 它在调解地表水分和能量平衡过程中扮演着重要角色(张人禾等, 2016; 王澄海等, 2021; 马耀明等, 2021)。土壤湿度直接影响地表的蒸散发, 进而影响大气降水(Wang and Dickinson, 2012)。土壤湿度对地表吸收的辐射能量以及向大气发射辐射的物理过程有重要影响。土壤湿度通过影响地表净辐射来调节地表感热通量和潜热通量的分配, 改变大气边界层内的水汽含量, 进而影响大气边界层高度、 气象要素的时空分布(Eltahir and Pal, 1996; Eltahir, 1998; Findell and Eltahir, 2003; 马英赛等, 2019)以及水分循环(李峰平等, 2013)。在陆气相互作用中, 边界层是直接受地表影响的一层大气, 其温度、 湿度、 风速等气象要素有明显的日变化特征, 垂直梯度也较大, 与上层自由大气气象要素的时空变化有明显差异。观测研究表明, 随着土壤湿度增加, 地表潜热通量增大, 感热通量减小, 地表波文比(地表感热与潜热通量的比值)减小, 更多的水汽蒸散进入边界层, 导致近地面温度降低, 边界层高度增长缓慢, 同时湿静力能增加(Gu et al, 2006; Sanchez-Mejia and Papuga, 2014), 这些变化可能进一步影响降水。然而, 土壤湿度与降水之间的关系却不是简单的线性关系, 仍然存在许多不确定性。
目前, 有许多数值模拟研究工作聚焦于土壤湿度对降水的影响, 如使用高分辨率的云解析模式、 大涡模式等, 模拟土壤湿度对边界层热力学结构和演变的影响, 进而影响深对流的触发过程(Guichard et al, 2004; Couvreux et al, 2015; 栾澜等, 2018; 张璐等, 2021)。一般在干旱地表发展的对流边界层(CBL)属于暖干边界层, 厚度较大, 湿润下垫面上的CBL高度明显低于干旱下垫面, 但是水汽含量较多, 这导致抬升凝结高度(LCL)和自由对流高度(LFC)降低(理论上CBL的高度与LCL和LFC达到相同高度时对流发生)(Huang et al, 2010; Garcia-Carreras et al, 2015), 因此在干旱或者湿润下垫面都有可能触发深对流, 形成降水。另一方面的模拟研究则考虑土壤湿度非均匀分布对深对流触发的影响(Kim and Entekhabi, 1998; Taylor et al, 2011; Kang and Bryan, 2011; Kang, 2016)。土壤湿度的空间非均匀分布引起不同区域地表的热力特征差异显著, 特别是地表感热通量和潜热通量的分配(Rochetin et al, 2017)。地表感热通量和潜热通量的非均匀分布可以激发局地中尺度环流, 例如城市热岛和干旱区的冷湿岛效应(Wang et al, 2017; 吴稀稀等, 2020)。在土壤湿度非均匀性较强的情况下, 受中尺度环流影响, 干暖区低空大气的水平辐合上升运动增强, 少数对流积云首先在其上空形成, 有利于深对流的触发, 形成的降水又影响土壤湿度以此形成反馈作用(Rieck et al, 2014; Han et al, 2019)。另外, 统计学分析方法(如相关分析、 趋势检验和SVD分析等)也是研究土壤湿度与降水之间反馈作用的常用方法。其通过对土壤湿度和降水的观测资料或者再分析资料的时空分布进行分析, 研究两者的耦合与反馈规律, 为区域气候预测提供参考。如Meng et al (2018)利用Mann-Kendall趋势检验和线性回归方法分析青藏高原ESA(European Space Agency)土壤湿度与降水水文的一致性; Meng et al(2023)还采用偏相关分析方法研究青藏高原土壤湿度对降水、 地面气温和叶面积指数的年代际响应; 高佳佳等(2021)和丁旭等(2022)利用SVD分解方法研究了青藏高原土壤湿度和降水的关系, 这些研究结果加深了我们对青藏高原土壤湿度对降水的影响和反馈作用的理解, 但是利用统计学方法对黄土高原土壤湿度与降水关系的研究较少。
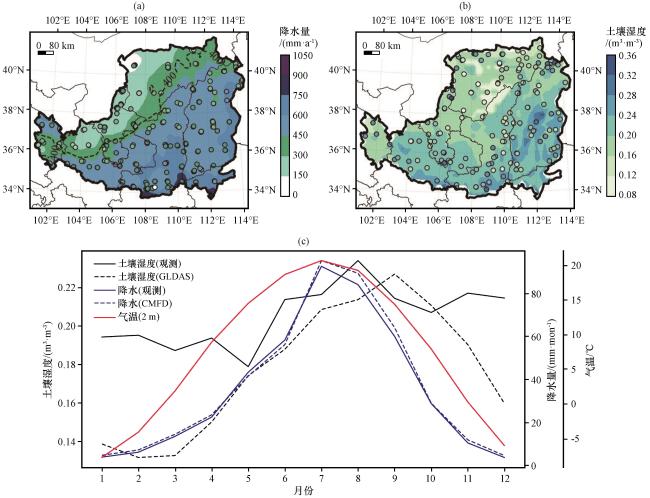
黄土高原地处中国沿海向内陆、 平原向高原的过渡地带, 400 mm年等降水线穿过黄土高原, 以此为分界线, 黄土高原自东南向西北横贯半湿润和半干旱两个区[图1(a)中的黑色虚线]。有研究发现黄土高原土壤湿度对地表反照率和短波辐射影响较小, 土壤湿度增加, 净长波辐射显著增加, 地表波文比减小(马英赛等, 2019)。另外, 有研究指出黄土高原土壤湿度和降水呈正相关关系, 相关关系最大出现在表层土壤(程善俊等, 2013)。这些研究帮助我们理解黄土高原土壤湿度对地表能量分配的影响, 以及土壤湿度对降水的影响。但是黄土高原初始土壤湿度对随后降水是否有影响还不明确, 不同区域的土壤湿度对滞后降水影响的差异也不清楚。本文将利用黄土高原的观测和区域再分析资料, 探究黄土高原表层土壤湿度(表层土壤湿度是指0~10 cm的土壤湿度, 以下简称为土壤湿度)对随后不同时间降水的影响。
图1 黄土高原2009 -2014年CMFD和实测平均年总降水量空间分布(a, 单位: mm·a-1)、 GLDAS和实测平均土壤湿度分布(b, 深度: 10 cm, 单位: m3·m-3), 以及GLDAS和实测土壤湿度(深度10 cm)、 CMFD和实测降水量、 CMFD气温(2 m高度)季节变化(c)

图(a)和(b)中的圆圈表示站点实测资料; 虚线表示400 mm等降水线

Fig.1 The spatial distribution of CMFD and observed annual mean total precipitation (a, unit: mm·a-1), GLDAS and observed mean soil moisture (b, soil depth 10 cm, unit: m3·m-3), and monthly GLDAS and observed soil moisture (soil depth 10 cm), monthly CMFD and observed precipitation, and monthly CMFD temperature (2 m) over the Loess Plateau from 2009 to 2014.The observations in Fig.1(a) and (b) are represented in circles, the dashed line indicates the 400 mm precipitation isoline

2 数据来源与方法介绍

2.1 资料介绍

利用兰州中心气象台提供的黄土高原130个站点观测的10 cm土壤湿度和89个站点降水资料分析土壤湿度与降水的关系。观测时间为2009 -2017年, 降水量为日数据, 土壤湿度大约10天一次观测数据。本文还使用了中国区域地面气象要素驱动数据集(CMFD), 它是第一个专为研究中国陆面过程而开发的网格化的高时空分辨率近地表气象数据集(Yang et al, 2017)。数据集是由遥感产品、 再分析数据集和台站观测数据融合而成。其记录开始于1979年1月, 时间分辨率为3 h, 空间分辨率为0.1°。CMFD数据集提供了7个近地面气象要素, 包括2 m的气温、 地表气压和比湿、 10 m的风速、 向下短波辐射、 向下长波辐射以及降水率。与站点观测的降水结果相比, CMFD的质量优于GLDAS(全球陆地数据同化系统), 这是因为用于生成CMFD的站点数量大于GLDAS中使用的站点数量(He et al, 2020)。 CMFD数据集可在国家青藏高原科学数据中心网站获取(https: //doi.org/10.11888/AtmosphericPhysics.tpe.249369.file.), 本文采用CMFD降水和2 m气温数据(1979 -2014年)进行土壤湿度对降水影响的分析。
另外, 本文还使用了全球陆面同化系统(Global Land Data Assimilation Systems, GLDAS)提供的土壤湿度资料。GLDAS驱动多个陆面模式(不与大气耦合), 包括 CLM、 NOAH和CLSM等, 集成大量基于观测的数据, 并在陆地信息系统(LIS)的支持下以高分辨率(2.5°~0.25°)在全球范围内运行(Rodell et al, 2004)。有研究指出, 尽管GLDAS产品与日时间尺度上的观测结果有较好的一致性, 其对年代际降水趋势的响应并不一致(Meng et al, 2023)。考虑到GLDAS的土壤湿度与其他再分析资料相比与实测结果较为接近, 且能较好地模拟黄土高原土壤湿度(10 cm)的时空变化特征(刘欢欢等, 2018), 以及GLDAS-NOAH数据集驱动场稳定、 时间序列长等优势, 因此本文分析黄土高原土壤湿度与降水的时空相关关系时, 使用1979 -2014年的GLDAS-NOAH土壤湿度(0~10 cm土壤含水量)日数据, 空间分辨率是0.25°× 0.25°。该数据集可在美国航空航天局(NASA)的戈达德(Goddard)地球科学数据和信息服务中心网站获取(https: //disc.gsfc.nasa.gov/)。文中涉及的地图是基于资源环境科学数据注册与出版系统的中国多年度省级行政区划边界数据(徐新良, 2023)绘制。

2.2 回归分析

本文选取黄土高原2010 -2017年某日区域平均的土壤湿度数据, 以及该日后21天的总降水量数据, 对这两组序列进行线性回归分析并进行F检验, 其解释方差在一定程度上反映了土壤湿度变化对降水量的影响程度。同理计算不同日期以及不同降水时间长度的结果, 研究不同时间土壤湿度对随后不同时间长度降水的影响程度。解释方差计算公式如下:
R 2 = ∑ i = 1 n ( x i - x ¯ ) ( y i - y ¯ ) ∑ i = 1 n ( x i - x ¯ ) 2 ∑ i = 1 n ( y i - y ¯ ) 2 2

2.3 格兰杰因果检验

本文还使用格兰杰因果检验, 进一步研究土壤湿度与降水之间是否存在一定程度的因果关系。格兰杰因果检验是一种分析两个平稳时间序列之间关系的方法(Granger, 1981; 王益君等, 2021), 对于等式:
F y t ( η | ( Y , X ) t - 1 ) = F y t ( η | Y t - 1 ) , ∀ η ∈ R
式中: 等号左边表示已知t-1时刻x和y的条件下, t时刻y的分布; 等号右边表示已知t-1时刻y的条件下, t时刻y的分布。若等式(2)成立, 则说明x不是y的格兰杰原因, 反之说明, x是y的格兰杰原因。一般检验x是否是y在均值上的格兰杰原因, 利用线性模型
y t = α 0 + ∑ i = 1 p α i y t - i + ∑ j = 1 q β j y t - j
若存在βj =0 (j=1, …, q), 说明x对y的回归没有贡献; 反之, 则表示x是y的格兰杰原因。

2.4 奇异值分解

奇异值分解(Singular Value Decomposition, SVD)由矩阵理论方法引入, 是在 EOF 分析用于两个气象场交叉相关系数场的分解计算基础上发展而来。自从1976 年首次用于气象场分析以来, 由于其计算简便, 被广泛应用于气候诊断研究中(丁裕国和江志红, 1996)。SVD 是针对两个气象场相关关系的重要诊断工具, 其目的是寻求不同的奇异值所对应的特征向量, 以揭示两个气象场之间的各种典型关联特征。假定两个要素场, 一个右场记为Y(q, t), 另一个左场记为X(p, t), p和q为要素场空间站点(网格点)数, t为时间序列, 其长度为n个样本。两个场的交叉协方差矩阵为:
C ( p , q ) = X ( p , n ) Y ( q , n ) '
式中: Y ( q , n ) '表示矩阵 Y ( q , n )的转置。将 C ( p , q )作奇异值分解:
C ( p , q ) = U ( p , m ) ∑ ( m , m ) V ( q , m ) '
式中: m ≤ m i n ( p , q ); U ( p , m )是C的左奇异向量; U U ' = I, V ( p , m )是C的右奇异向量; V V ' = I, I为单位矩阵; ∑ ( m , m )是对角矩阵, 对应的奇异值为 σ 1 , σ 2 , … , σ m > 0。将X、 Y按照各自的奇异向量完全展开为:
X ( p , n ) = U ( p , m ) A ( m , n )
Y ( q , n ) = V ( q , m ) B ( m , n )
式中: A、 B分别为X和Y的时间系数矩阵。SVD 可以最大限度地从左、 右场分离出相互独立的耦合分布型, 揭示两个气象场所存在的时域相关性的空间联系。为了反映两个气象场的遥相关区及相互作用的关键区, SVD的结果为各模态的模态相关系数, 异性相关系数定义为左(右)场时间系数与右(左)场气象序列之间的相关系数, 同性相关系数定义为左(右)场时间系数与左(右)场气象场序列的相关系数。本文使用SVD方法分析黄土高原土壤湿度场和降水场之间的时空变化特征。

3 结果分析

3.1 黄土高原土壤湿度以及降水时空分布特征

图1是黄土高原2009 -2014年台站观测和再分析的土壤湿度和降水的空间分布和季节变化。从图1(a)可以看出, 黄土高原的东南部受夏季风影响, 降水较多, 而西北部处于季风西北边缘, 降水较少。图1(b)是黄土高原2009 -2014年站点观测土壤湿度与GLDAS土壤湿度的空间分布。由于站点观测的是土壤相对湿度, 而GLDAS是土壤体积含水量, 为了便于数据比较, 根据以下公式对土壤湿度进行换算:
q = r × f c × ρ
式中: r为土壤相对湿度(单位: %); fc 为田间持水量(单位: %); ρ为土壤容重(单位: g·cm-3)。根据黄土高原0~10 cm土壤田间持水量和土壤容重的研究结果(游松财等, 2009; 赵亚丽等, 2020), fc 和ρ分别取为30%和1.4 g·cm-3。从图1(b)可以看到, GLDAS土壤湿度在黄土高原总体呈现从东南向西北减小的特征, 与降水的空间分布比较一致, 东南部的土壤湿度较大, 中部和西北地区的土壤相对干燥, 这与孙秉强等(2005)的研究结果一致。观测资料显示西北边缘也有少数站点的土壤湿度相对较高, 超过0.3 m3·m-3。黄土高原既有季风区也有非季风区, 降水主要集中在6 -9月, 站点观测和CMFD同时段的降水季节变化一致性较好[图1(c)蓝色虚线和实线]。从图1(c) GLDAS和观测的10 cm土壤湿度有明显的季节变化特征, 春季(3 - 5月)土壤熵值减小, 这可能与降水少而蒸发较多有关, 夏季随着降水增多, 土壤湿度增大。GLDAS和观测的土壤湿度在5 -10月的变化特征基本一致, 观测的10 cm土壤湿度最大值出现在8月(约0.23 m3·m-3), 而GLDAS的最大值在9月(约0.22 m3·m-3)。冬季两者的差别较大, 而且观测的土壤湿度明显较GLDAS的大, 这可能与冬季站点土壤湿度缺测较多有关(2009 -2014年冬季130个站点的观测只有1436次)。另外, CMFD黄土高原2 m气温的季节变化显示[图1(c)中红色实线]12月、 1月和2月的平均气温均低于0 ℃, 分别是-6.0 ℃、 -7.7 ℃和-4.0 ℃, 说明冬季黄土高原的气温较低, 土壤水分可能冻结。而站点只观测0 ℃以上的土壤相对湿度, 这可能也是导致影响观测的土壤相对湿度较大的原因。考虑到冬季土壤湿度可能受冻土影响, 本文以下的内容中只分析3 -11月的土壤湿度。

3.2 黄土高原土壤湿度及降水长期变化趋势

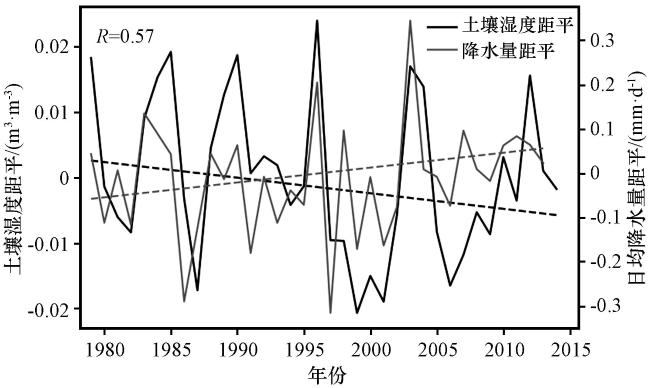
以往的研究表明, 在全球气候变暖的背景下, 我国西北地区气候呈现从暖干向暖湿的转型(马柱国等, 2018)。黄土高原位于西北地区东部, 是华北湿润区向干旱半干旱气候区的过渡带, 1979 - 2014年, 降水量呈现显著的上升趋势(如图2灰色实线所示, 通过95%显著性Mann-Kendall趋势检验), 年增长速率约为0.56 mm·a-1(图2灰色虚线), 符合西北地区总体湿润化的变化特征。而黄土高原土壤湿度自1979 -2014年总体呈现下降趋势, 这与程善俊等(2013)的研究结果一致, 但是变化速率较小, 没有通过显著的Mann-Kendall趋势检验, 这可能与黄土高原土壤湿度空间分布差异较大有关。另外, 图2中土壤湿度和降水距平的时间序列有较好的相关性, 相关系数约为0.57, 降水方差较土壤湿度的大。土壤湿度正异常与降水正异常的对应较它们的负异常对应更好, 这与Meng et al(2018)的研究结果一致, 这也进一步说明黄土高原的土壤湿度并不是一定随降水增加而增大。
图2 黄土高原1979 -2014年土壤湿度(GLDAS资料, 10 cm深度)和日均降水量(CMFD资料)距平的年变化

黑色实线表示土壤湿度距平, 黑色虚线表示土壤湿度距平趋势, 灰色实线表示降水量距平, 灰色虚线表示降水量距平趋势

Fig.2 Annual changes of soil moisture anomaly (GLDAS, 10 cm) and precipitation anomaly (CMFD) over the Loess Plateau from1979 to 2014.The black solid curve and dashed line show annual variation of soil moisture anomaly and its trend, the gray solid curve and dashed line present precipitation anomaly and its trend

3.3 土壤湿度与降水的回归分析

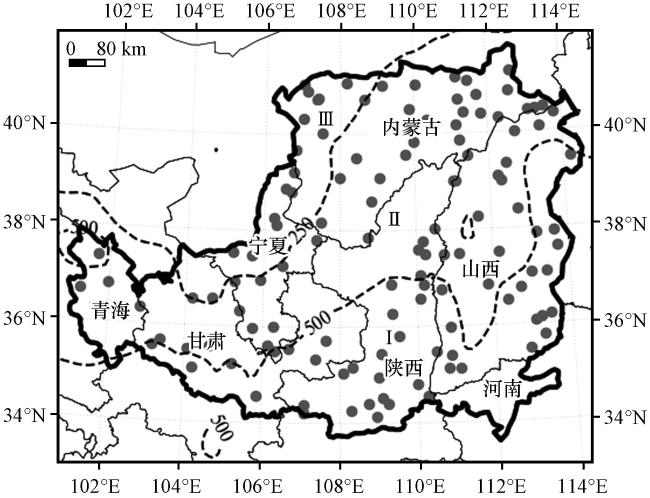
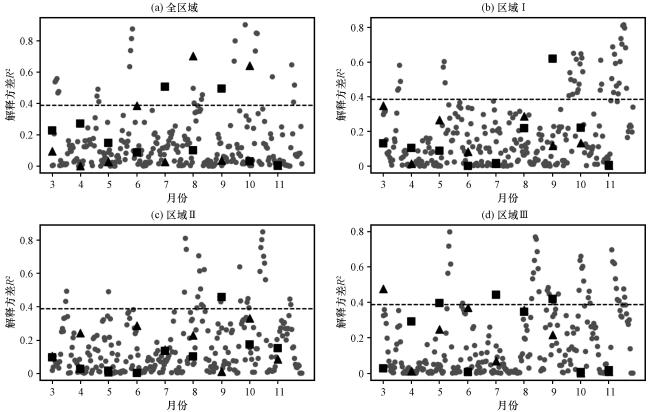
Findell and Eltahir(1997)利用Illinois的观测资料研究了土壤湿度与滞后降水的相关关系, 发现夏季土壤湿度与随后21天的降水有显著的线性相关性。为了研究分析黄土高原土壤湿度对降水的滞后影响, 本文也选择21天的时间长度, 并且进一步将时间尺度延长至1个月以及2个月进行分析。另外, 由图1(a)和(b)的分析可知, 黄土高原降水量以及土壤湿度的空间分布差异较大, 本文参考陈少勇等(2008)的方法, 用250 mm和500 mm的年降水量线, 将黄土高原分成三个区域(图3中的I区、 II区和III区), 采用线性回归分析方法对全区域、 区域I、 II和III的土壤湿度与随后不同时间的降水关系进行对比分析。另外, 由于2009年的站点观测资料并不是整年的, 为了方便处理数据, 相关分析利用的资料是2010 -2017年。图4(a)中散点表示某天土壤湿度与随后21天降水量的解释方差, 方块表示n月土壤湿度与n+1月降水的解释方差, 三角表示n月土壤湿度与n+2月降水的解释方差(n代表3,…, 11月), 虚线表示F检验90%的显著性水平。从图4(a)中散点可以看出, 3 -11月土壤湿度与随后21天降水回归分析结果中有23天(共275天)通过显著性检验, 主要是在春末和秋季, 并且分布较分散, 而且土壤湿度和降水相关程度较高的时间并不连续, 与Findell and Eltahir(1997)分析结果差别较大, 这可能与黄土高原复杂下垫面导致土壤湿度时空分布差异较大有关。
图3 黄土高原土壤湿度观测站点位置(黑色圆点)以及区域划分

虚线代表250 mm和500 mm年等降水线

Fig.3 Observation stations of soil moisture (black dots) and regional divisions over the Loess Plateau.The dashed lines present 250 mm and 500 mm annual precipitation isolines, respectively

图4 黄土高原2010 -2017年3 -11月全区域(a)、 区域Ⅰ(b)、 Ⅱ(c)和Ⅲ(d)观测的平均土壤湿度与降水回归分析的解释方差

灰色圆点表示初始土壤湿度与随后21天降水量的解释方差; 方块表示n月土壤湿度与n+1月降水的解释方差; 三角表示n月土壤湿度与n+2月降水的解释方差; 虚线表示F检验90%的显著性水平

Fig.4 Interpretive variance of regression analysis of observed mean soil moisture and precipitation in whole (a), the region Ⅰ (b), Ⅱ (c) and Ⅲ (d) over the Loess Plateau from March to November from 2010 to 2017.Gray dots represent the interpretative variance between initial soil moisture and precipitation in the following 21 days, squares represent the that between soil moisture in the nth month and precipitation in the n+1st month, triangles represent the that between soil moisture in nth month and precipitation in the n+2nd month, and dashed lines represent the significance level of 90% of the F-test

如果将土壤湿度对随后降水影响的时间尺度加长至1个月或2个月, 可以看到7月土壤湿度与8月降水和9月土壤湿度与10月降水[图4(a)中的方块]之间存在较高的解释方差, 8月土壤湿度与10月降水和10月土壤湿度与12月降水[图4(a)中的三角]之间也有较好的相关关系, 而且主要集中在夏秋季节。从Ⅰ区、 Ⅱ区和Ⅲ区的解释方差[图4(b)~(d)]可以看出, 相对整个黄土高原土壤湿度与随后21天降水的相关关系, 分区后通过显著性检验的时间增多, 特别是降水相对较多的I区秋季, 说明黄土高原不同区域土壤湿度对降水影响的特征不同。图4(b)和(c)显示I区和II区只有9月土壤湿度与10月降水的相关通过显著性检验, 而在降水较少的III区, 5月与6月、 7月与8月以及9月与10月的土壤湿度与降水均存在显著相关, 而且3月的土壤湿度显著影响5月的降水, 其他月份则均未通过显著性检验。说明在黄土高原全域的空间范围内, 土壤湿度分布不均匀, 局地特征差异较大, 较长的滞后降水时间尺度适用于较大空间范围的分析。另外, 我们还分析了黄土高原单站(如天水站和介休站)观测的土壤湿度与随后21天降水的相关关系(图略), 发现相关性较全区域和分区的强, 这也进一步说明土壤湿度对随后降水的影响在短时间内受局地影响显著。
格兰杰因果检验在一定程度上反映了两组平稳时间序列之间的因果关系, 本文选取与回归分析一样的时间序列, 做格兰杰因果检验, 排除降水对土壤湿度的反馈, 进一步检验初始土壤湿度是否对随后降水有影响。格兰杰因果检验要求时间序列具有平稳性, 为了简化计算, 本文假设土壤湿度和降水的序列都是平稳的, 这样的假设可能引起结果的误差。为了与回归分析的F检验进行对比, 针对所有时间序列都做两种检验。表1显示了2010 - 2017年通过90%显著性的格兰杰因果检验的土壤湿度序列月份和对应的降水序列月份。对于整个黄土高原区域来说, 10月和11月的土壤湿度是12月降水的格兰杰原因, Ⅰ区和Ⅱ区的12月降水也与之前1个月或2个月的土壤湿度存在格兰杰因果关系, 这也可能与12月降水相对较少, 其随时间变化较小有关。在降水量相对较小的春季, 土壤湿度与随后降水也存在格兰杰因果关系, 而降水量较多的夏季, 则没有通过检验。另外, 对于21天的格兰杰检验, 与回归分析的检验结果相似, 土壤湿度和降水的格兰杰因果关系通过显著性检验的结果在时间上较分散。综上所述, 由于黄土高原地形复杂, 下垫面特征不均一, 土壤湿度的时空分布差别较大, 回归分析和格兰杰因果检验显示全区域土壤湿度与随后21天降水的相关性不明确, 但是秋季的土壤湿度对随后1个月或2个月的降水有显著影响, 在III区8月土壤湿度对10月的降水也有显著影响, 在其他区域和时间两种分析方法的结果并不相同。
表1 2010 -2017年黄土高原全区域、 区域I、 II和III土壤湿度和随后降水通过90%显著性的格兰杰因果检验

Table 1 The Granger-causality test of soil moisture and following precipitation pass with 90% significance over the whole region, region I, II and III of the Loess Plateau from 2010 to 2017

区域 月份 F统计量 p值
土壤湿度 降水
全区域 11月 12月 8 0.04
全区域 10月 12月 14 0.02
I 11月 12月 23 0.008
I 10月 12月 10 0.03
II 3月 4月 5 0.09
II 11月 12月 18 0.01
II 10月 12月 14 0.02
III 3月 4月 5 0.09
III 4月 6月 10 0.03
III 8月 10月 13 0.02

3.4 土壤湿度与降水的SVD分析

由于黄土高原土壤湿度观测数据的时间连续性较差、 不同站点观测时间也不一致、 观测年份较少, 初始平均土壤湿度与随后降水的显著相关的时间分布较分散, 本文使用土壤湿度和降水再分析资料(CMFD降水资料和GLDAS土壤湿度资料), 采用SVD分析方法, 进一步分析黄土高原区域3 -11月土壤湿度与降水的关系。相同月份的土壤湿度与降水的SVD分析显示, 第一模态的协方差贡献均超过82%, 并且第一模态相关系数都通过95%的Monte-Carlo检验, 最高总体相关系数达0.83(4月土壤湿度和降水, 8月土壤湿度和降水), 这可能是降水对土壤湿度的正反馈作用导致的较大相关系数。表2是n月土壤湿度与n+1月降水的SVD分析, 与相同月份的SVD结果相比, 第一模态的协方差占比(最小方协方差贡献约48%)和总体相关系数均明显减小, 其中7月土壤湿度与8月降水的SVD总体相关性最大。而在n月土壤湿度与n+2月降水的SVD分析中, 5月土壤湿度与7月降水的第一模态时间序列相关性最大, 约为0.73。根据图4(a)观测数据的结果, 本文进一步分析黄土高原7月的土壤湿度与8月降水, 以及9月的土壤湿度与10月降水的SVD分解第一模态异类相关系数分布。
表2 1979 -2014年不同月份黄土高原土壤湿度(GLDAS)与降水(CMFD)的SVD分析

Table 2 SVD analysis of soil moisture (GLDAS) and precipitation (CMFD) in different months of the Loess Plateau from 1979 to 2014

月份 第一模态 协方差占比 总体相关 系数
土壤湿度 降水
3月 4月 0.83 0.48
4月 5月 0.54 0.31
5月 6月 0.72 0.44
6月 7月 0.52 0.43
7月 8月 0.68 0.56
8月 9月 0.48 0.43
9月 10月 0.84 0.47
10月 11月 0.58 0.3
11月 12月 0.77 0.28
3月 5月 0.58 0.62
4月 6月 0.51 0.37
5月 7月 0.59 0.73
6月 8月 0.46 0.48
7月 9月 0.64 0.57
8月 10月 0.61 0.41
9月 11月 0.46 0.31
10月 12月 0.58 0.26
11月 13月 0.65 0.53
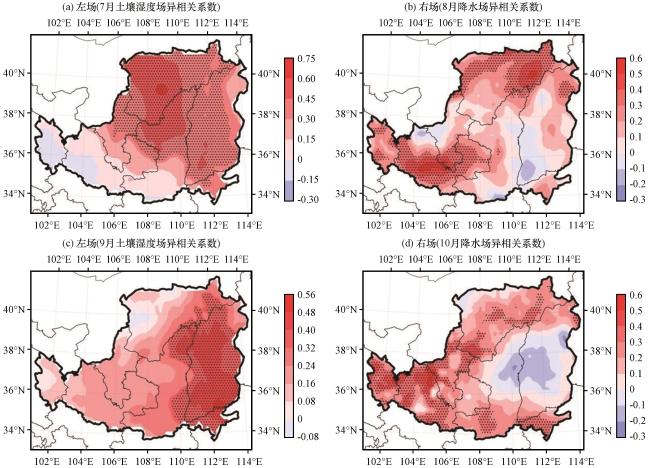
图5是1979 -2014年黄土高原土壤湿度与降水第一模态的异类相关系数场分布。7月土壤湿度与8月降水的SVD分解的第一模态协方差贡献率为68%, 相关系数为0.56, 打点部分通过95%置信度检验。图5(a)第一模态左场(土壤湿度)显示黄土高原中部和西北部土壤较湿润(有较大正值), 而图5(b)第一模态右场(降水)的显著区域分布在西南部和北部边缘, 也为正值, 说明7月黄土高原中部、 北部地区的土壤湿度与8月西南和北部的降水存在较强正相关性, 即黄土高原7月土壤较湿润时, 8月其西南部、 北部的降水也会偏多。图5(c)显示, 9月黄土高原东部地区的土壤湿度, 与10月西部以及北部和南部部分地区的降水存在一定程度的正相关关系。这说明9月黄土高原东部的土壤如果偏湿润, 10月在西部以及北部和南部的某些地区降水偏多。值得注意的是, 9月土壤湿度的显著区域和10月降水的显著区域重叠部分较少, 说明黄土高原的土壤湿度和降水的影响存在一定程度的时空不对称性。
图5 黄土高原区域1979 -2014年7月土壤湿度与8月降水(a, b), 以及9月土壤湿度与10月降水(c, d)SVD分解的第一模态异类相关系数场

打点部分表示通过95%的显著性检验

Fig.5 Heterogeneous correlation coefficient fields of the first mode of SVD analysis of July soil moisture and August precipitation (a, b) and September soil moisture and October precipitation (c, d) in the Loess Plateau region from 1979 to 2014.The dotted area indicates that it passes the 95% significance test

4 结论

利用2009 -2017年黄土高原土壤湿度和降水的观测资料, 分析了土壤湿度和降水的时空分布及变化特征, 进一步利用1979 -2014年中国区域地面气象要素驱动数据集(CMFD)的降水和全球陆面同化系统(GLDAS)土壤湿度, 探究了黄土高原初始土壤湿度与随后降水的相关关系。分析得到以下主要结论:
(1) 黄土高原土壤湿度从1979 -2014年略有下降, 而降水量则表现为0.56 mm·a-1的上升趋势; 冬春季节土壤较为干燥, 夏秋季较湿润, 降水主要集中在夏季, 冬春季节降水较少; 黄土高原东南和西南边缘的土壤湿度较大, 而中部地区的土壤相对干燥; 降水则是东南多、 西北少的分布。
(2) 不同站点的观测资料显示, 黄土高原初始土壤湿度与随后21天降水相关的时间分布较分散。黄土高原不同区域(I、 II和III)两者的解释方差在21天的时间尺度上通过显著性检验的天数增多, 其中降水较多的区域I秋季增加较明显。黄土高原全域的初始土壤湿度与随后1~2个月降水回归分析的解释方差在夏季明显增加, 高值集中在7 -10月。黄土高原区域I和区域II 9月土壤湿度与10月降水的回归分析通过显著性检验, 而在降水较少的区域III, 5月与6月、 7月与8月以及9月与10月的两者存在显著相关。格兰杰因果检验表明黄土高原全区域秋季的初始土壤湿度对随后1个月或2个月的降水有显著影响, 在区域III 8月土壤湿度对10月的降水也有显著性影响, 这与回归分析的结果一致。
(3) 黄土高原n月土壤湿度与n+1月降水的SVD分析中, 7月土壤湿度与8月降水的SVD第一模态的总体相关系数最大(约0.56), 而在n月土壤湿度与n+2月降水的SVD分析中, 5月土壤湿度与7月降水的第一模态总体相关系数可以达到0.73。1979 -2014年, 7月黄土高原中部、 北部和东部土壤湿度较大时, 8月西部和北部边缘的降水偏多。9月东部的土壤较湿润时, 10月西部以及南北的部分地区降水偏多。另外, 9月土壤湿度的显著区域与10月降水的显著区域重叠部分较少, 说明黄土高原的土壤湿度对降水的影响存在一定程度的时空不对称性。

参考文献

null
Couvreux F, Roehrig R, Rio C, et al, 2015.Representation of daytime moist convection over the semi-arid Tropics by parameterizations used in climate and meteorological models[J].Quarterly Journal of the Royal Meteorological Society, 141(691): 2220-2236.DOI: 10.1002/qj.2517 .
null
Eltahir E A B, Pal J S, 1996.Relationship between surface conditions and subsequent rainfall in convective storms[J].Journal of Geophysical Research: Atmospheres, 101(D21): 26237-26245.DOI: 10.1029/96JD01380 .
null
Eltahir E A B, 1998.A soil moisture-rainfall feedback mechanism: 1.theory and observations[J].Water Resources Research, 34(4): 765-776.DOI: 10.1029/97WR03499 .
null
Findell K L, Eltahir E A B, 1997.An analysis of the soil moisture-rainfall feedback, based on direct observations from Illinois[J].Water Resources Research, 33(4): 725-735.DOI: 10.1029/96WR03756 .
null
Findell K L, Eltahir E A B, 2003.Atmospheric controls on soil moisture-boundary layer interactions.part i: framework development[J].Journal of Hydrometeorology, 4(3): 552-569.DOI: 10. 1029/2001JD001515 .
null
Granger C W J, 1981.Some properties of time series data and their use in econometric model specification[J].Journal of Econometrics, 16(1): 121-130.DOI: 10.1016/0304-4076(81)90079-8 .
null
Gu L H, Meyers T, Pallardy S G, et al, 2006.Direct and indirect effects of atmospheric conditions and soil moisture on surface energy partitioning revealed by a prolonged drought at a temperate forest site[J].Journal of Geophysical Research, 111(D16): D16102.DOI: 10.1029/2006JD007161 .
null
Guichard F, Petch J C, Redelsperger J L, et al, 2004.Modeling the diurnal cycle of deep precipitating convection over land with cloud-resolving models and single-column models[J].Quarterly Journal of the Royal Meteorological Society, 130(604): 3139-3172.DOI: 10.1256/qj.03.145 .
null
Garcia-carreras L, Parker D J, Marsham J H, et al, 2015.The turbulent structure and diurnal growth of the Saharan atmospheric boundary layer[J].Journal of the Atmospheric Sciences, 72(2): 693-713.DOI: 10.1175/JAS-D-13-0384.1 .
null
Huang Q, Marsham J H, Parker D J, et al, 2010.Simulations of the effects of surface heat flux anomalies on stratification, convective growth, and vertical transport within the Saharan boundary layer[J].Journal of Geophysical Research, 115(D5): D05201.DOI: 10.1029/2009JD0126897 .
null
Han C, Brdar S, Kollet S, 2019.Response of convective boundary layer and shallow cumulus to soil moisture heterogeneity: a large-eddy simulation study[J].Journal of Advances in Modeling Earth Systems, 11(12): 4305-4322.DOI: 10.1029/2019MS001772 .
null
He J, Yang K, Tang W J, et al, 2020.The first high-resolution meteorological forcing dataset for land process studies over China[J].Scientific Data, 7(1): 25.DOI: 10.1038/s41597-020-0369-y .
null
Koster R D, Sud Y C, Guo Z, et al, 2006.GLACE: the global land-atmosphere coupling experiment.Part I: overview[J].Journal of Hydrometeorology, 7(4): 590-610.DOI: 10.1175/JHM510.1 .
null
Kim C P, Entekhabi D, 1998.Impact of soil heterogeneity in a mixed-layer model of the planetary boundary layer[J].Hydrological Sciences Journal, 43(4): 633-658.DOI: 10.1080/02626669809492158 .
null
Kang S L, Bryan G H, 2011.A large-eddy simulation study of moist convection initiation over heterogeneous surface fluxes[J].Monthly Weather Review, 139(9): 2901-2917.DOI: 10.1175/MWR-D-10-05037.1 .
null
Kang S L, 2016.Regional Bowen ratio controls on afternoon moist convection: a large eddy simulation study: Bowen Ratio controls on moist convection[J].Journal of Geophysical Research: Atmospheres, 121(23): 14056-14083.DOI: 10.1002/2016JD025567 .
null
Meehl G A, 1994.Influence of the land surface in the Asian Summer Monsoon: external conditions versus internal feedbacks[J].Journal of Climate, 7(7): 1033-1049.DOI: 10.1175/1520-0442(1994)007<1033: IOTLSI>2.0.CO; 2 .
null
Meng X H, Li R, Luan L, et al, 2018.Detecting hydrological consistency between soil moisture and precipitation and changes of soil moisture in summer over the Tibetan Plateau[J].Climate Dynamics, 51, 4157-4168.DOI: 10.1007/s00382-017-3646-5 .
null
Meng X H, Deng M S, Talib J, et al, 2023.Diagnosing product variability in the soil moisture response to precipitation on the Tibetan Plateau[J].Journal of Hydrometeorology, 24: 625-639.DOI: 10.1175/JHM-D-22-0181.1 .
null
Rochetin N, Couvreux F, Guichard F, 2017.Morphology of breeze circulations induced by surface flux heterogeneities and their impact on convection initiation: breeze circulations induced by surface heterogeneities[J].Quarterly Journal of the Royal Meteorological Society, 143(702): 463-478.DOI: 10.1002/qj.2935 .
null
Rieck M, Hohenegger C, Van Heerwaarden C C, 2014.The influence of land surface heterogeneities on cloud size development[J].Monthly Weather Review, 142(10): 3830-3846.DOI: 10.1175/MWR-D-13-00354.1 .
null
Rodell M, Houser P R, Jambor U, et al, 2004.The global land data assimilation system[J].Bulletin of the American Meteorological Society, 85(3): 381-394.DOI: 10.1175/BAMS-85-3-381 .
null
Santanello J A, Peters-lidard C D, Kennedy A, et al, 2013.Diagnosing the nature of land-atmosphere coupling: a case study of dry/wet extremes in the U.S.Southern Great Plains[J].Journal of Hydrometeorology, 14(1): 3-24.DOI: 10.1175/JHM-D-12-023.1 .
null
Seneviratne S I, Corti T, Davin E L, et al, 2010.Investigating soil moisture-climate interactions in a changing climate: a review[J].Earth-Science Reviews, 99(3/4): 125-161.DOI: 10.1016/j.earscirev.2010.02.004 .
null
Sanchez-mejia Z M, Papuga S A, 2014.Observations of a two-layer soil moisture influence on surface energy dynamics and planetary boundary layer characteristics in a semiarid shrubland: observations of two-layer soil moisture[J].Water Resources Research, 50(1): 306-317.DOI: 10.1002/2013WR014135 .
null
Taylor C M, Gounou A, Guichard F, et al, 2011.Frequency of Sahelian storm initiation enhanced over mesoscale soil-moisture patterns[J].Nature Geoscience, 4(7): 430-433.DOI: 10.1038/ngeo1173 .
null
Wu L Y, Zhang J Y, 2013.Role of land-atmosphere coupling in summer droughts and floods over eastern China for the 1998 and 1999 cases[J].Chinese Science Bulletin, 58(32): 3978-3985.DOI: 10.1007/s11434-013-5855-6 .
null
Wang K C, Dickinson R E, 2012.A review of global terrestrial evapotranspiration: observation, modeling, climatology, and climatic variability: global terrestrial evapotranspiration[J].Reviews of Geophysics, 50(2): 1-54.DOI: 10.1029/2011RG000373 .
null
Wang Y, Di Sabatino S, Martilli A, et al, 2017.Impact of land surface heterogeneity on urban heat island circulation and sea-land breeze circulation in Hong Kong: UHIC and SLBC in Hong Kong[J].Journal of Geophysical Research: Atmospheres, 122(8): 4332-4352.DOI: 10.1002/2017JD026702 .
null
Yang F, Lu H, Yang K, et al, 2017.Evaluation and comparison among multiple forcing data sets for precipitation and shortwave radiation over Mainland China[J].Hydrology and Earth System Sciences Discussions, 21(11): 5805-5821.DOI: 10. 5194/HESS-2017-321 .
null
程善俊, 管晓丹, 黄建平, 等, 2013.利用GLDAS资料分析黄土高原半干旱区土壤湿度对气候变化的响应[J].干旱气象, 31(4): 641-649.DOI: 10.11755/j.issn.1006-7639(2013)-04-0641.Cheng S J ,
null
Guan X D, Huang J P, et al, 2013.Analysis of response of soil moisture to climate change in semi-arid Loess Plateau in China based on GLDAS data[J].Journal of Arid Meteorology, 31(4): 641-649.DOI: 10.11755/j.issn.1006-7639(2013)-04-0641 .
null
陈少勇, 郭凯忠, 董安祥, 2008.黄土高原土壤湿度变化规律研究[J].高原气象, 27(3): 530-537.
null
Chen S Y, Guo K Z, Dong A X, 2008.Research of variety rule of soil humidity in Loess Plateau of China[J].Plateau Meteorology, 27(3): 530-537.
null
丁裕国, 江志红, 1996.SVD方法在气象场诊断分析中的普适性[J].气象学报, 54(3): 365-372.DOI: 10.11676/qxxb1996. 037.Ding Y G ,
null
Jiang Z H, 1996.Generality of singular value decomposition in diagnostic analysis of meteorological field[J].Acta Meteorologica Sinica, 54(3): 365-372.DOI: 10.11676/qxxb1996.037 .
null
丁旭, 赖欣, 范广洲, 2022.青藏高原春季土壤湿度异常与我国夏季降水的联系[J].高原气象, 41(1): 24-34.DOI: 10.7522/j.issn.1000-0534.2020.00094.Ding X ,
null
Lai X, Fan G Z, 2022.Impacts of spring soil moisture anomalies in Qinghai-Xizang Plateau on the summer precipitation variability in China[J].Plateau Meteorology, 41(1): 24-34.DOI: 10.7522/j.issn.1000-0534. 2020.00094 .
null
高佳佳, 杜军, 卓嘎, 2021.青藏高原春季土壤湿度与夏季降水的关系[J].大气科学学报, 44(2): 219-227.DOI: 10.13878/j.cnki.dqkxxb.20200720001.Gao J J ,
null
Du J, Zhuo G, 2021.Relationship between soil moisture in spring and precipitation in summer over the Tibetan Plateau[J].Transactions of Atmospheric Sciences, 44(2): 219-227.DOI: 10.13878/j.cnki.dqkxxb. 20200720001 .
null
刘维成, 张强, 刘新伟, 2021.陆-气相互作用对大气对流活动影响研究进展和展望[J].高原气象, 40(6): 1278-1293.DOI: 10.7522/j.issn.1000-0534.2021.zk0019.Liu W C ,
null
Zhang Q, Liu X W, 2021.The impact of land-atmosphere interaction on the initiation and development of convective activities: a review[J].Plateau Meteorology, 40(6): 1278-1293.DOI: 10.7522/j.issn.1000-0534.2021.zk0019 .
null
刘欢欢, 王飞, 张廷龙, 2018.CLDAS和GLDAS土壤湿度资料在黄土高原的适用性评估[J].干旱地区农业研究, 36(5): 270276.DOI: 10.7606/j.issn.1000-7601.2018.05.38.Liu H H ,
null
Wang F, Zhang T L, 2018.Evaluation applicability of CLDAS and GLDAS soil moisture for the Loess Plateau[J].Agricultural Research in the Arid Areas, 36(5): 270276.DOI: 10.7606/j.issn.1000-7601.2018.05.38 .
null
李峰平, 章光新, 董李勤, 2013.气候变化对水循环与水资源的影响研究综述[J].地理科学, 33(4): 457-464.DOI: 10.13249/j.cnki.sgs.2013.04.457.Li F P ,
null
Zhang G X, Dong L Q, 2013.Studies for impact of climate change on hydrology and water resources[J].Scientia Geographica Sinica, 33(4): 457-464.DOI: 10.13249/j.cnki.sgs.2013.04.457 .
null
林朝晖, 刘辉志, 谢正辉, 等, 2008.陆面水文过程研究进展[J].大气科学, 32(4): 935-949.DOI: 10.3878/j.issn.1006-9895. 2008.04.19.Lin Z H ,
null
Liu H Z, Xie Z H, et al, 2008.Recent progress in the land-surface and hydrological process studies[J].Chinese Journal of Atmospheric Sciences, 32(4): 935-949.DOI: 10.3878/j.issn.1006-9895.2008.04.19 .
null
栾澜, 孟宪红, 吕世华, 等, 2018.青藏高原土壤湿度触发午后对流降水模拟试验研究[J].高原气象, 37(4): 873-885.DOI: 10.7522/j.issn.1000-0534.2018.00008.Luan L ,
null
Meng X H, Lü S H, et al, 2018.Simulation on afternoon convective precipitation triggered by soil moisture over the Qinghai-Tibetan Plateau[J].Plateau Meteorology, 37(4): 873-885.DOI: 10.7522/j.issn.1000-0534.2018.00008 .
null
马英赛, 孟宪红, 韩博, 等, 2019.黄土高原土壤湿度对地表能量和大气边界层影响的观测研究[J].高原气象, 38(4): 705-715.DOI: 10.7522/j.issn.1000-0534.2019.00036.Ma Y S ,
null
Meng X H, Han B, et al, 2019.Observations of soil moisture influence on surface energy dynamics and planetary boundary layer characteristics over the Loess Plateau[J].Plateau Meteorology, 38(4): 705-715.DOI: 10.7522/j.issn.1000-0534.2019.00036 .
null
马柱国, 符淙斌, 杨庆, 等, 2018.关于北方干旱化及其转折性变化[J].大气科学, 42(4): 951-961.DOI: 10.3878/j.issn. 10069895.1802.18110.Ma Z G ,
null
Fu Z B, Yang Q, et al, 2018.Drying trend in northern China and its shift during 1951-2016[J].Chinese Journal of Atmospheric Sciences, 42(4): 951-961.DOI: 10.3878/j.issn.10069895.1802.18110 .
null
马耀明, 胡泽勇, 王宾宾, 等, 2021.青藏高原多圈层地气相互作用过程研究进展和回顾[J].高原气象, 40(6): 1241-1262.DOI: 10.7522/j.issn.1000-0534.2021.zk006.Ma Y M ,
null
Hu Z Y, Wang B B, et al, 2021.The review of the observation experiments on land-atmosphere interaction progress on the Qinghai-Xizang(Tibetan)Plateau[J].Plateau Meteorology, 40(6): 1241-1262.DOI: 10.7522/j.issn.1000-0534.2021.zk006 .
null
孙秉强, 张强, 董安祥, 等, 2005.甘肃黄土高原土壤水分气候特征[J].地球科学进展, 20(9): 1041-1046.DOI: 10.11867/j.issn.1001-8166.2005.09.1041.Sun B Q ,
null
Zhang Q, Dong A X, et al, 2005.Evolution feature on the moisture of so il for loess highland in Gansu[J].Advances in Earth Science, 20(9): 1041-1046.DOI: 10.11867/j.issn.1001-8166.2005.09.1041 .
null
吴稀稀, 黄倩, 王婵, 等, 2020.夏季金塔绿洲效应的理想数值试验研究[J].干旱气象, 38(2): 195-204.DOI: 10.11755/j.issn. 1006-7639(2020)-02-0195.Wu X X ,
null
Huang Q, Wang C, et al, 2020.Idealized numerical tests of oasis effect in Jinta oasis in summer[J].Journal of Arid Meteorology, 38(2): 195-204.DOI: 10.11755/j.issn.1006-7639(2020)-02-0195 .
null
王益君, 魏美云, 周潮, 等, 2021.经济政策不确定性, 通货膨胀与国别异质性——基于16个样本国家的分位数格兰杰因果检验分析[J].金融理论与实践, 504(7): 70-81.
null
Wang Y J, Wei M Y, Zhou C, et al, 2021.Economic policy uncertainty, inflation, and country heterogeneity: Quantile Granger causality test analysis for 16 sample countries[J].Financial Theory & Practice, 504(7): 70-81.
null
王澄海, 杨凯, 张飞民, 等, 2021.青藏高原土壤冻融过程的气候效应: 进展和展望[J].高原气象, 40(6): 1318-1336.DOI: 10.7522/j.issn.1000-0534.2021.zk021.Wang C H ,
null
Yang K, Zhang F M, et al, 2021.Climate effects of soil freeze-thaw process over Qinghai-Xizang Plateau: progress and perspectives[J].Plateau Meteorology, 40(6): 1318-1336.DOI: 10.7522/j.issn.1000-0534.2021.zk021 .
null
徐新良, 2023.中国多年度省级行政区划边界数据[DB/OL].资源环境科学数据注册与出版系统.DOI: 10.12078/2023010103 .[2023-06-10].2023.China's multi-year provincial administrative division boundary data[DB/OL].Resource and Environmental Science Data Registration and Publication System.DOI: 10.12078/2023010103 .[2023-06-10].
null
游松财, 邸苏闯, 袁晔, 2009.黄土高原地区土壤田间持水量的计算[J].自然资源学报, 24(3): 545-552.DOI: 10.11849/zrzyxb. 2009.03.020.You S C ,
null
Di S C, Yuan Y, 2009.Study on soil field capacity estimation in the Loess Plateau region[J].Journal of Natural Resources, 24(3): 545-552.DOI: 10.11849/zrzyxb.2009.03.020 .
null
张强, 王胜, 2007.关于干旱和半干旱区陆面水分过程的研究[J].干旱气象, 25(2): 1-4.
null
Zhang Q, Wang S, 2007.Processes of water transfer over land surface in arid and semi arid region of China[J].Journal of Arid Meteorology, 25(2): 1-4.
null
张人禾, 刘栗, 左志燕, 2016.中国土壤湿度的变异及其对中国气候的影响[J].自然杂志, 38(5): 313-319.DOI: 10.3969/j.issn.0253-9608.2016.05.001.Zhang R H ,
null
Liu L, Zuo Z Y, 2016.Variations of soil moisture over China and their influences on Chinese climate[J].Chinese Journal of Nature, 38(5): 313-319.DOI: 10.3969/j.issn.0253-9608.2016.05.001 .
null
张璐, 黄倩, 张宏昇, 等, 2021.干湿地表的湍流特征及其对深对流影响的大涡模拟[J].气象学报, 79(4): 659-673.DOI: 10. 11676/qxxb2021.037.Zhang L ,
null
Huang Q, Zhang H S, et al, 2021.Large eddy simulation of turbulence effects on deep-convection triggering over dry and wet surfaces[J].Acta Meteorologica Sinica, 79(4): 659-673.DOI: 10.11676/qxxb2021. 037 .
null
赵亚丽, 王云强, 张兴昌, 2020.黄土高原生态工程区土壤容重及饱和导水率的分布特征[J].农业工程学报, 36(10): 83-89.DOI: 10.11975/j.issn.1002-6819.2020.10.010.Zhao Y L ,
null
Wang Y Q, Zhang X C, 2020.Distribution characteristics of bulk density and saturated hydraulic conductivity in intensive land restoration project areas on the Loess Plateau[J].Transactions of the Chinese Society of Agricultural Engineering, 36(10): 83-89.DOI: 10.11975/j.issn.1002-6819.2020.10.010 .
文章导航

/

〈 〉