
1 引言
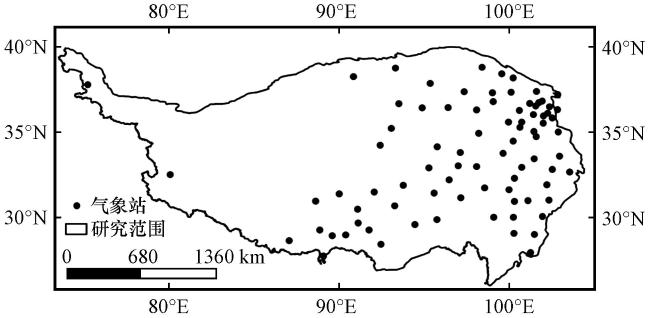
2 资料来源和方法介绍
3 青藏高原冬季降雪特征及关键环流分析
3.1 时空变化特征
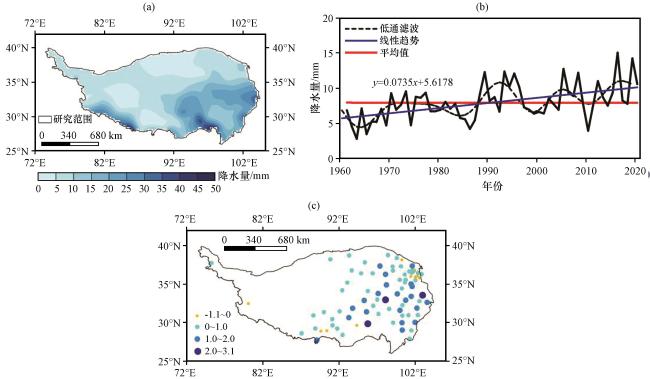
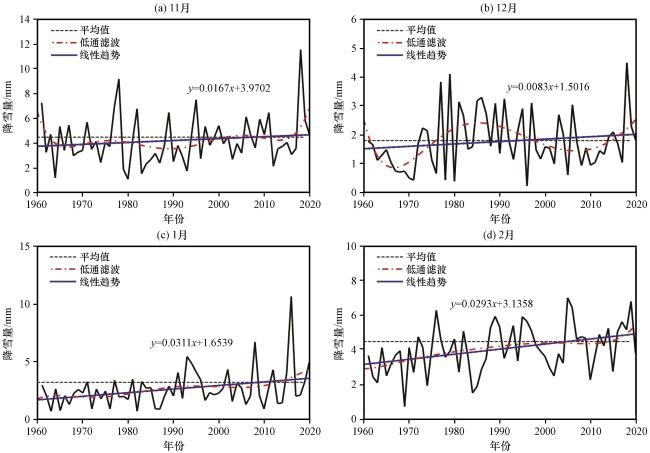
表1 青藏高原冬季和季内不同时期降雪相关系数表Table 1 The correlation coefficients between wintertime and subseasonal snowfall over the Qinghai-Xiang (Tibetan) Plateau |
| 时段 | 冬季 | 11月 | 12月 | 1月 | 2月 | 11 -12月 | 1 -2月 |
|---|---|---|---|---|---|---|---|
| 冬季 | 1 | 0.759*** | 0.506*** | 0.486*** | 0.586*** | 0.815*** | 0.726*** |
| 11月 | 1 | 0.294* | 0.042 | 0.246 | 0.928*** | 0.185 | |
| 12月 | 1 | -0.002 | 0.176 | 0.630*** | 0.109 | ||
| 1 月 | 1 | 0.062 | 0.036 | 0.781*** | |||
| 2 月 | 1 | 0.270* | 0.672*** | ||||
| 11 -12月 | 1 | 0.193 | |||||
| 1 -2月 | 1 |
*、 **和***分别表示通过了0.10, 0.05和0.001信度水平检验(*, **, and *** respectively indicate passing 0 10, 0. 05 and 0 001 Reliability Level Test) |
3.2 高原冬季降雪主模态特征
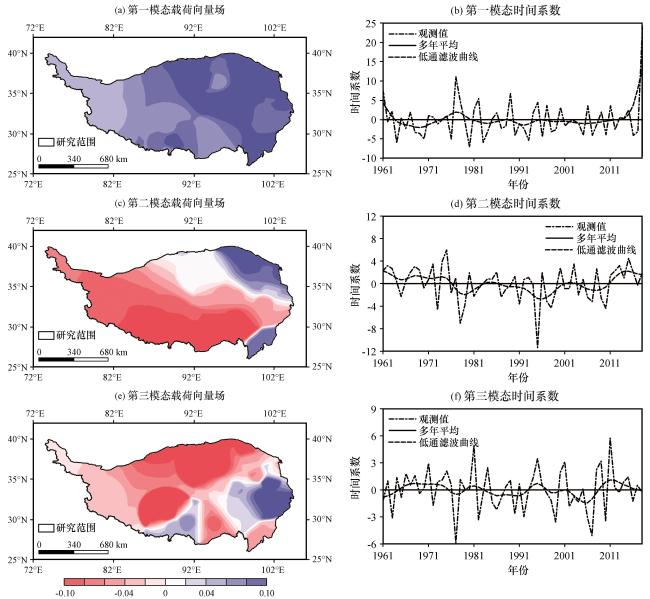
图4 青藏高原冬季降雪EOF前三主模态载荷向量场及其时间系数(a)第一模态载荷向量场, (b)第一模态时间系数, (c)第二模态载荷向量场, (d)第二模态时间系数, (e)第三模态载荷向量场, (f)第三模态时间系数 Fig.4 The first three EOF patterns of snowfall in Qinghai-Xizang Plateau and time factors.(a) the first-mode eigenvector for EOF, (b) the first-mode time factor for EOF, (c) the second-mode eigenvector for EOF, (d) the second-mode time factor for EOF, (e) the three-mode eigenvector for EOF, (f) the three-mode time factor for EOF |
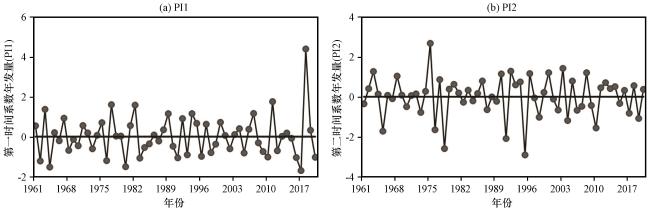
图6 青藏高原冬季降雪前两个主模态对应时间系数的年际分量Fig.6 Annual time series of the first two modes for snowfall in winter over Qinghai-Xizang (Tibetan) Plateau |
表2 青藏高原冬季降雪典型异常年份对照表Table 2 Typical abnormal years of snowfall in winter over Qinghai-Xizang (Tibetan) Plateau |
| 类别 | 第一时间系数年际分量(PI1) | 第二时间系数年际分量(PI2) |
|---|---|---|
| 正位相年 | 1963, 1977, 1982, 1989, 1994, 2007, 2011, 2018 | 1963, 1975, 1990, 1992, 1996, 2000, 2003, 2008 |
| 负位相年 | 1962, 1964, 1976, 1980, 1983, 1991, 1996, 2010, 2016, 2017, 2020 | 1965, 1976, 1978, 1991, 1995, 1998, 2004, 2010, 2019 |
3.3 高原冬季降雪异常的环流背景
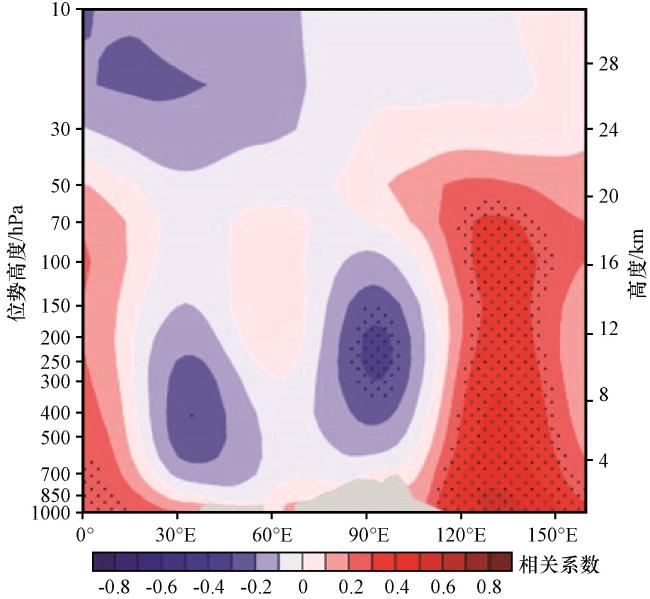
图7 PI1和位势高度场的垂直相关剖面(沿20°N -40°N)打点区表示相关性通过了95%置信水平检验 Fig.7 The vertical correlation section between PI1 and geopotential height (along 20°N -40°N).Dots represent have passed the 95% confidence level test |
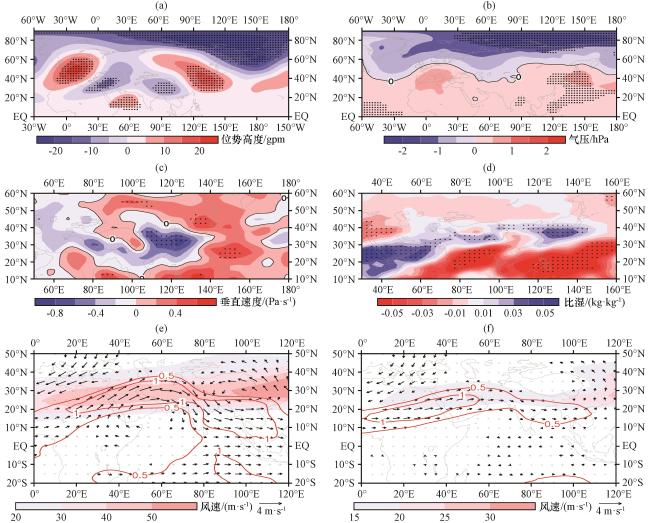
图8 PI1回归的冬季300 hPa位势高度(a, 彩色区, 单位: gpm), 海平面气压(b, 彩色区, 单位: hPa), 500 hPa垂直速度场(c, 彩色区, 单位: Pa·s-1), 500 hPa比湿(d, 彩色区, 单位: kg·kg-1)及200 hPa(e)和500 hPa(f)矢量风(矢量)、 纬向风场(彩色区)及其距平场(等值线)(单位: m·s-1)黑色打点区、 加粗矢量表示通过95%置信水平检验 Fig.8 Regression of 300 hPa height (a, color area, unit: gpm), sea level pressure (b, color area, unit: hPa), 500 hPa vertical velocity (c, color area, unit: Pa·s-1), 500 hPa specific humidity (d, color area, unit: kg·kg-1), 200 hPa (e) and 500 hPa (f) vector wind (vector) and zonal wind (color area) and its anomaly field (contour) (unit: m·s-1) against PI1 in winter.The black dots and black vectors represent passing the 95% confidence level test, respectively |
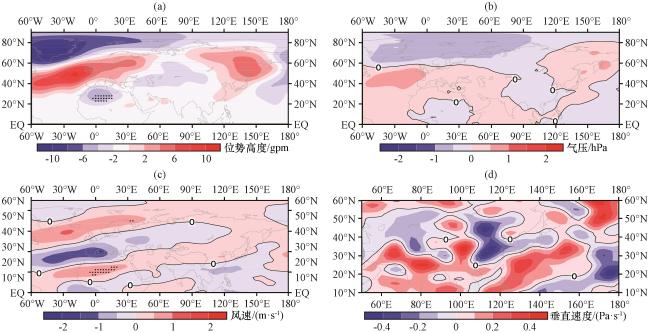
图9 PI2回归的冬季500 hPa位势高度场(a, 彩色区, 单位: gpm), 海平面气压场(b, 彩色区, 单位: hPa), 200 hPa纬向风场(c, 彩色区, 单位: m·s-1)及500 hPa垂直速度场(d, 彩色区, 单位: Pa·s-1)打点区域为通过95%置信水平检验 Fig.9 Regression of anomalous winter 500 hPa height (a, color area, unit: gpm), SLP (b, color area, unit: hPa), 200 hPa zonal wind (c, color area, unit: m·s-1), and 500 hPa vertical wind (d, color area, unit: Pa·s-1) against PI2, respectively.Dots represent passing the 95% confidence level test |
3.4 NAO的影响分析
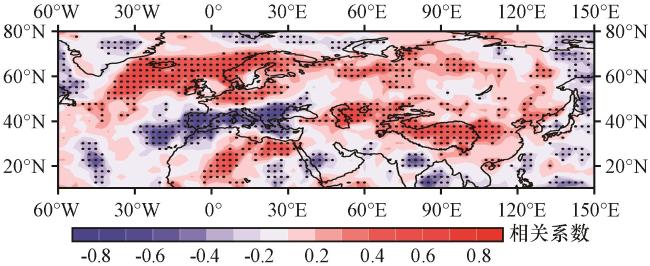
图10 冬季NAO和青藏高原降雪相关关系打点区域表示通过95%置信水平 Fig.10 Correlation between NAO and snowfall in winter over Qinghai-Xizang (Tibetan) Plateau.Dots represent passing the 95% confidence level test |
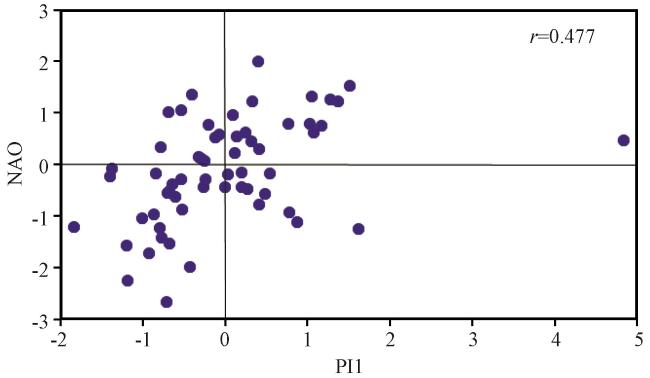
表3 NAO和PI1正负异常典型年对照表Table 3 List years of NAO and PI1 in abnormal cases |
| 类别 | NAO | PI1 |
|---|---|---|
| 正位相年 | 1974, 1975, 1982, 1988, 1989, 1991, 1992, 1993, 1994, 1999, 2007, 2011, 2014 | 1963, 1977, 1982, 1989, 1994, 1996, 2007, 2011 |
| 负位相年 | 1962, 1963, 1964, 1965, 1968, 1969, 1970, 1976, 1977, 1984, 1985, 1995, 2000, 2009, 2010, 2012, 2016, 2017, 2020 | 1962, 1964, 1976, 1980, 1983, 1991, 1996, 2010, 2016, 2017, 2020 |
表中加粗字体表示NAO和PI1同位相的年份(The bold fonts indicate the years in which NAO and PI1 are in phase) |
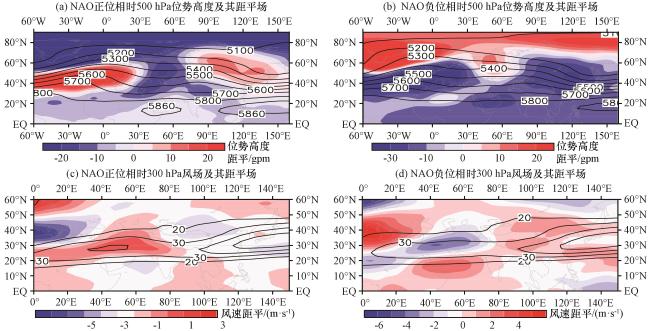
图12 冬季NAO正(a, c)负(b, d)位相合成的500 hPa位势高度场(等值线, 单位: gpm)、 300 hPa纬向风场(等值线, 单位: m·s-1)及其距平场(阴影区)(a)NAO正位相时500 hPa位势高度及其距平场, (b)NAO负位相时500 hPa位势高度及其距平场, (c)NAO正位相时300 hPa风场及其距平场, (d)NAO负位相时300 hPa风场及其距平场 Fig.12 Composition maps of mean (contour) and anomaly (shading) for 500 hPa geopotential height (unit: gpm), 300 hPa zonal wind (unit: m·s-1) positive (a, c) and negative (b, d) NAO.(a)500 hPa geopotential height and its anomaly while positive NAO, (b)500 hPa geopotential height and its anomaly while negative NAO, (c)300 hPa zonal wind and its anomaly while positive NAO, (d)300 hPa zonal wind and its anomaly while negative NAO |
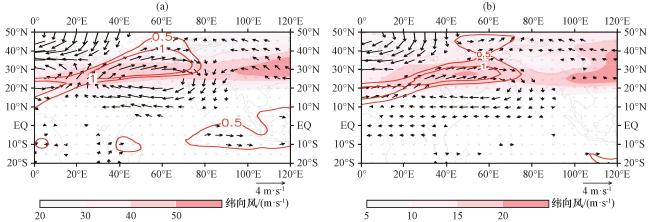
图13 NAO回归的冬季200 hPa(a)和500 hPa(b)水平风场(矢量, 单位: m·s-1)及其纬向风场(彩色区, 单位: m·s-1)加粗矢量和红色等值线分别表示水平风场和纬向风通过95%显著性水平检验 Fig.13 Regression of anomalous winter 200 hPa (a) and 500 hPa (b) horizontal (vector, unit: m·s-1) and zonal (color area, unit: m·s-1) wind on NAO.The bold vector and red contour represent that the horizontal and zonal wind passes the 95% confidence level test, respectively |
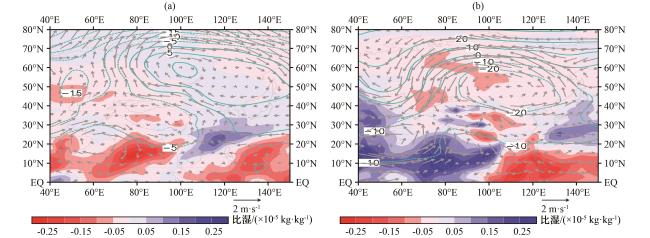
图14 冬季NAO正位相(a)和负位相(b)时合成的600 hPa风场(矢量, 单位: m·s-1)、 比湿场(彩色区, 单位: ×10-5 kg·kg-1)和高度场(等值线, 单位: gpm)异常分布Fig.14 Composition maps of 600 hPa wind field (vector, unit: m·s-1), specific humidity (color area, unit: ×10-5 kg·kg-1) and geopotential height (contour, unit: gpm) anomalies in positive (a) and negative (b) |
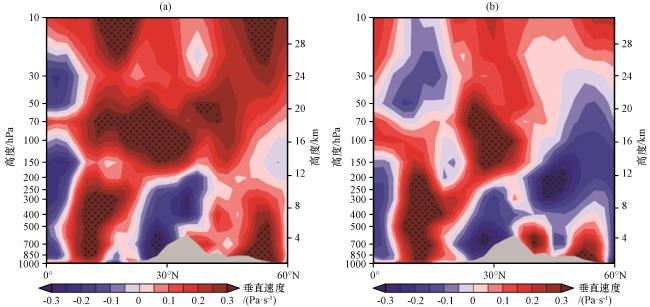
图15 冬季PI1(a)和NAO (b)同垂直速度场沿70°E -103°E范围的高度-纬度剖面打点区域表示相关性通过了95%置信水平检验 Fig.15 The vertical section correlation between PI1 and vertical velocity field (a), and between NAO and vertical velocity field (b) along 70°E -103°E.The dotted areas indicate that the correlations passed the 95% confidence level test |