
1 引言
2 数据来源与方法介绍
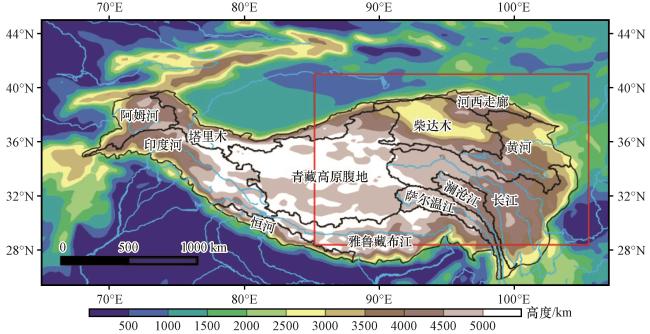
2.1 研究区概况
2.2 数据来源
2.3 方法介绍
2.3.1 Delta分位数映射法
2.3.2 精度评价指标
表1 降水数据精度评价指标、 公式及最优值Table 1 The formula and optimal value about evaluation metrics |
| 统计指标 | 公式 | 最优值 |
|---|---|---|
| 相关系数CC | 1 | |
| 平均绝对偏差MAE | 0 | |
| 平均相对偏差MRE | 0 | |
| 相对标准差RSD | 1 | |
| 均方根误差RMSE | 0 | |
| 临界成功指数CSI | 1 | |
| BIAS评分BIAS | 1 | |
| 命中率POD | 1 | |
| 误报率FAR | 0 | |
| 准确率Precision | 1 | |
| F评分Fscore | 1 |
n表示精度评价中所用到的数据对个数; Si 和Oi 分别代表第i个格点的卫星降水值和观测值; 和 分别表示所有格点的卫星和观测降水平均值; TP表示在特定阈值下, 卫星和观测同时成功捕捉到的降水事件个数; FN表示在特定阈值下, 观测捕捉成功而卫星捕捉失败的降水事件个数; FP表示在特定阈值下, 卫星捕捉到而没有观测到的降水事件个数。 |
3 结果与分析
3.1 降水概率分布
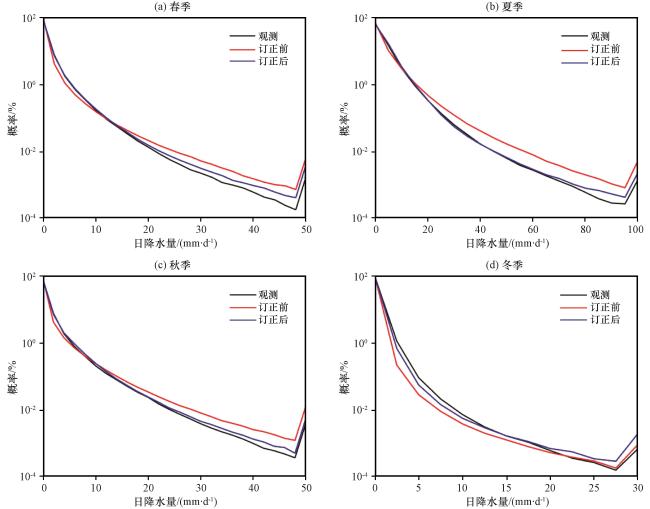
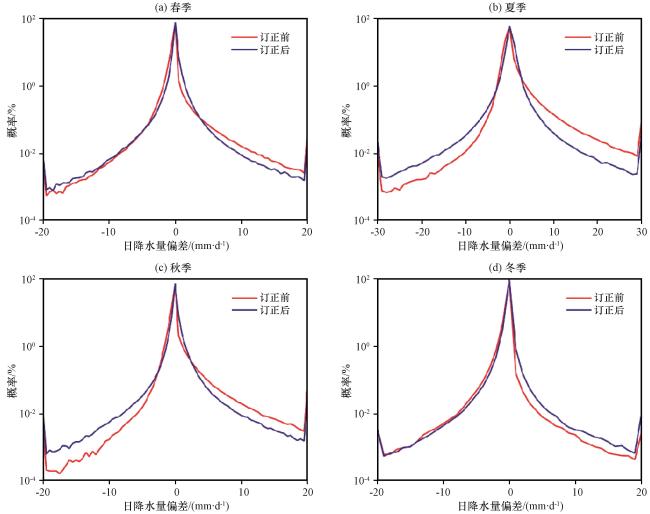
图2 验证期的不同季节日降水量概率分布 (a)春季, (b)夏季, (c)秋季, (d)冬季Fig.2 Probability distribution of daily precipitation in different seasons for the validation period.(a) spring, (b) summer, (c) autumn, (d) winter |
表2 验证期的日降水量在5个降水量级的概率分布Table 2 Probability distribution of daily precipitation in five precipitation intensities for the validation period |
| 概率分布/% | 日降水量/(mm·d-1) | ||||
|---|---|---|---|---|---|
| <1 | 1~5 | 5~10 | 10~20 | >20 | |
| 观测 | 69.56 | 23.61 | 4.5 | 1.85 | 0.49 |
| 订正前 | 78.92 | 14.35 | 3.84 | 2.06 | 0.84 |
| 订正后 | 69.75 | 22.72 | 5.04 | 1.98 | 0.51 |
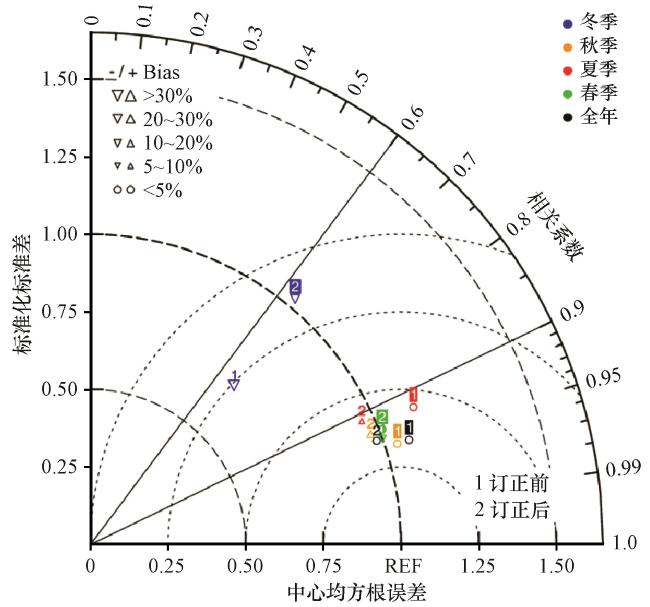
3.2 年和季节降水验证
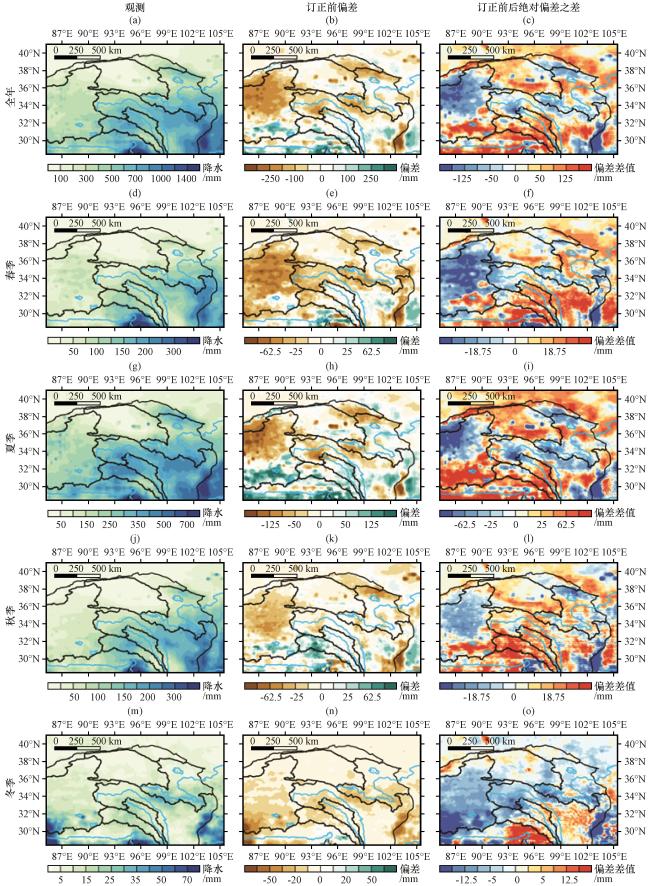
图4 验证期年和季节平均降水观测值(第一列)、 订正前偏差(第二列)和订正后绝对偏差与订正前绝对偏差相减(第三列)的空间分布(单位: mm)(a~c)全年, (d~f)春季, (g~i)夏季, (j~l)秋季, (m~o)冬季 Fig.4 Spatial distribution of annual and seasonal mean precipitation during the validation period of the observations (first column), deviations before correction (second column), and differences from absolute deviations before and after correction (third column) (unit: mm). (a~c) annual, (d~f) sping, (g~i) summer, (j~l) autumn, (m~o) winter |
表3 验证期年和季节平均降水的区域平均值Table 3 Regional average of annual and seasonal mean precipitation for the validation period |
| 时段 | 降水的区域平均值/mm | ||
|---|---|---|---|
| OBS | 订正前 | 订正后 | |
| 年 | 413 | 393 | 433 |
| 春季 | 77 | 64 | 79 |
| 夏季 | 239 | 244 | 256 |
| 秋季 | 84 | 80 | 88 |
| 冬季 | 14 | 5 | 10 |
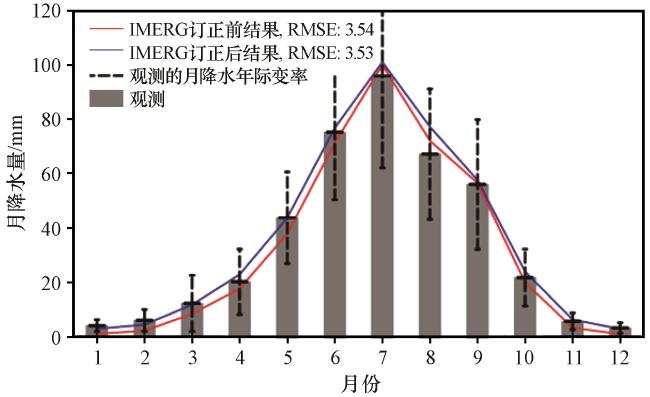
3.3 月降水验证
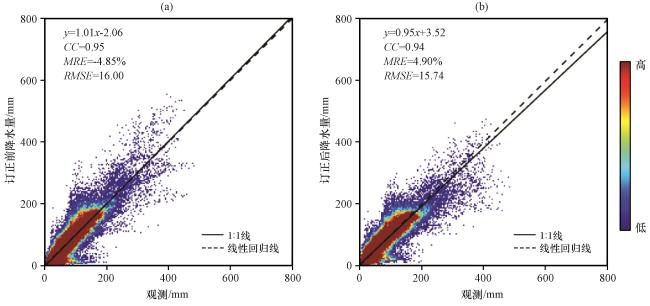
3.4 日降水验证
表4 全年和不同季节IMERG订正前后日降水量的评分Table 4 Statistical scores of annual and seasonal daily precipitation before and after correction |
| 时期 | 全年 | 春季 | 夏季 | 秋季 | 冬季 | |||||||||
|---|---|---|---|---|---|---|---|---|---|---|---|---|---|---|
| 数据 | 订正前 | 订正后 | 订正前 | 订正后 | 订正前 | 订正后 | 订正前 | 订正后 | 订正前 | 订正后 | ||||
| CC | 0.93 | 0.93 | 0.91 | 0.91 | 0.94 | 0.93 | 0.94 | 0.93 | 0.7 | 0.66 | ||||
| RSD | 1.24 | 1.05 | 1.2 | 1.11 | 1.28 | 1.02 | 1.23 | 1.06 | 0.76 | 1.1 | ||||
| RMSE | 1.49 | 1.26 | 1.17 | 1.07 | 2.37 | 1.9 | 1.24 | 1.09 | 0.52 | 0.63 | ||||
| CSI | 0.6 | 0.66 | 0.6 | 0.68 | 0.71 | 0.78 | 0.57 | 0.62 | 0.24 | 0.32 | ||||
| BIAS | 0.6 | 0.98 | 0.6 | 0.98 | 0.72 | 1.01 | 0.57 | 0.97 | 0.24 | 0.91 | ||||
加粗字体表示误差订正后评分有改进(Bold font indicates improvements in scores after error correction) |
表5 IMERG订正前后日降水量在5个降水量级的评分Table 5 Statistical scores of daily precipitation in different precipitation intensities before and after correction |
| 降水量级/(mm·d-1) | 数据 | CSI | BIAS | POD | FAR | Precision | Fscore |
|---|---|---|---|---|---|---|---|
| 0.1~1微量 | 订正前 | 0.09 | 1.39 | 0.20 | 0.86 | 0.14 | 0.16 |
| 订正后 | 0.15 | 1.34 | 0.31 | 0.77 | 0.23 | 0.26 | |
| 1~5小量 | 订正前 | 0.09 | 4.05 | 0.43 | 0.89 | 0.11 | 0.17 |
| 订正后 | 0.13 | 4.17 | 0.59 | 0.86 | 0.14 | 0.23 | |
| 5~10中量 | 订正前 | 0.025 | 16.38 | 0.43 | 0.97 | 0.026 | 0.07 |
| 订正后 | 0.029 | 16.93 | 0.51 | 0.97 | 0.030 | 0.08 | |
| 10~20大量 | 订正前 | 0.012 | 46.73 | 0.54 | 0.99 | 0.012 | 0.04 |
| 订正后 | 0.012 | 49.24 | 0.60 | 0.99 | 0.012 | 0.05 | |
| >20暴量 | 订正前 | 0.50 | 1.73 | 0.91 | 0.47 | 0.53 | 0.86 |
| 订正后 | 0.54 | 1.04 | 0.71 | 0.31 | 0.69 | 0.87 |
加粗字体表示误差订正后评分有改进(Bold font indicates improvements in scores after error correction) |
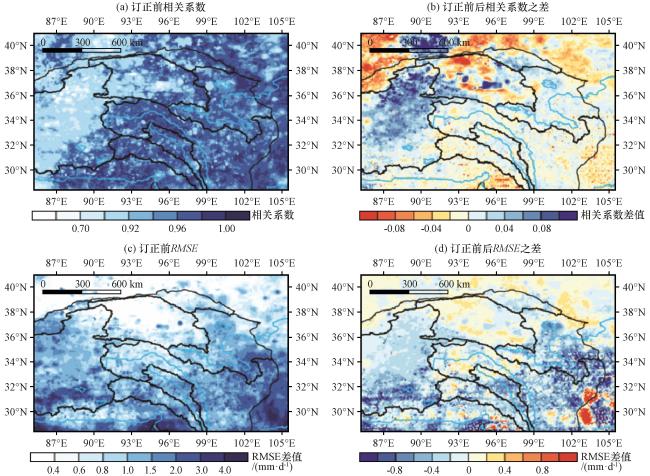
图8 验证期IMERG日降水量订正前相关系数(a)和订正后与订正前相关系数之差(b)的空间分布; 订正前均方根误差(c)和订正后与订正前均方根误差之差(d)的空间分布(单位: mm·d-1)Fig.8 Spatial distribution for daily precipitation during the validation period of correlation coefficients before correction (a) and differences of correlation coefficients before and after correction (b), and its root-mean-square error before correction (c) and differences of correlation coefficients before and after correction (d).Unit: mm·d-1 |
3.5 极端降水验证
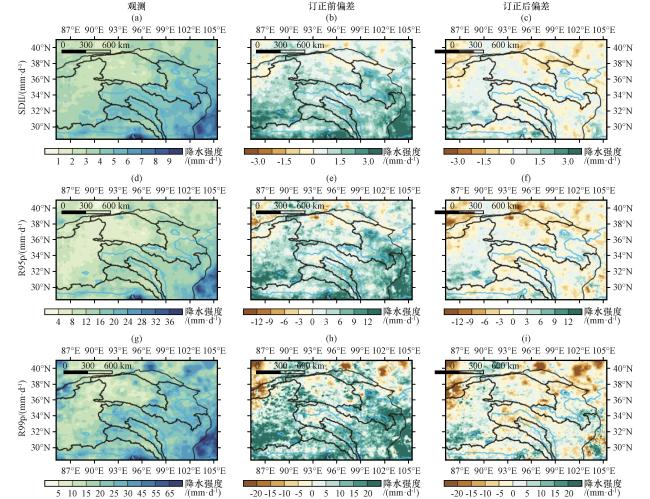
图9 验证期降水强度(SDII)与极强降水量(R95p和R99p)的空间分布(单位: mm·d-1) (a, d, g)观测, (b, e, h) 订正前偏差, (c, f, i) 订正后偏差Fig.9 Spatial distribution of simple daily intensity index (SDII) and percentile-based threshold indices (R95p and R99p) during the validation period.Unit: mm·d-1.(a, d, g)observation, (b, e, h) Pre-correction deviation, (c, f, i) corrected deviation |