
1 引言
2 数据来源与方法介绍
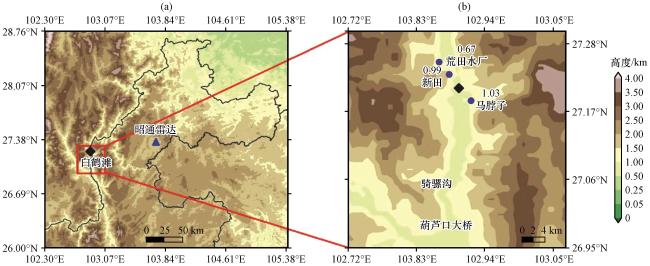
图1 金沙江下游地形海拔(阴影, 单位: km)、 白鹤滩水电站(菱形)和观测站位置(蓝色圆点)(a)中黑色曲线为云南和四川的省界, 三角形为昭通雷达站; (b)中数值为测站海拔(单位: km) Fig.1 The topographic height above the sea level of the lower reaches of Jinsha River (shadow, unit: km), and Baihetan Hydropoder (lozenge) and the location of observation stations (blue dot).The black line in (a) is the provincial boundary, and triangle means Zhaotong Radar Station, and the number in (b) shows the stations’ altitude (unit: km) |
3 飑线经过时地面气象要素分析
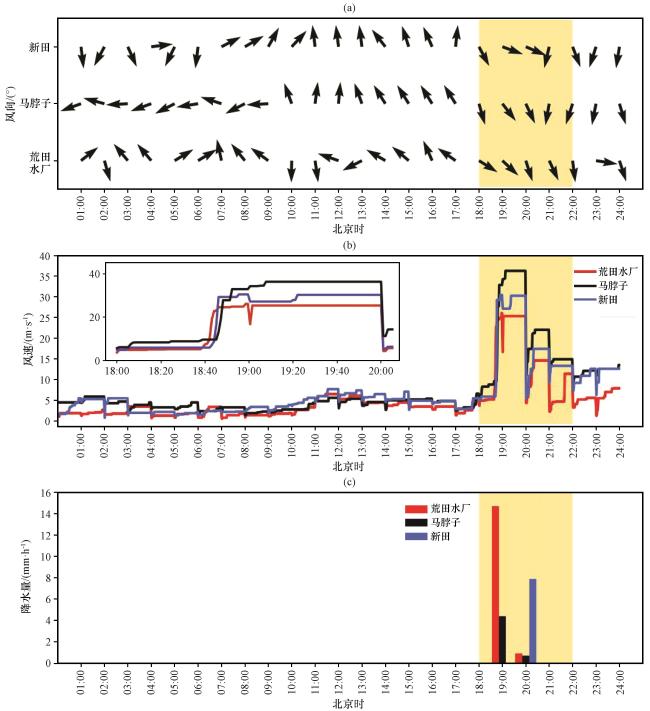
图2 新田、 马脖子和荒田水厂站2016年6月4日小时极大风速的风向[(a), 单位: (°)]、 逐分钟风速(b, 单位: m·s-1, 方框小图为18:00 -20:00的放大)和小时降水量(c)变化曲线黄色阴影为飑线经过峡谷的时段 Fig.2 The variations of direction of maximum wind speed vector [a, unit: (°)], the maximum wind speed (b, unit: m·s-1, the box is the enlarge picture from 18:00 to 20:00) and the hourly precipitation (c) over Xintian, Mabozi and Huangtian on June 4, 2016.The yellow shaded means the duration of squall line arrived the canyon |
4 飑线的环流形势背景分析
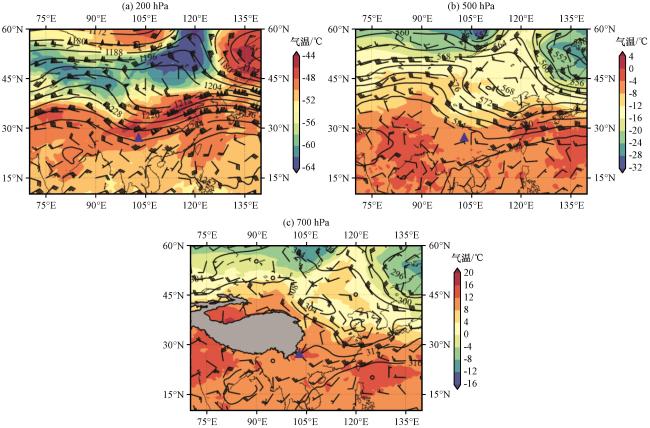
图4 2016年6月4日08:00的200 hPa(a)、 500 hPa(b)和700 hPa(c)的风场(风羽, 单位: m·s-1, 长线为4 m· s-1, 短线为2 m·s-1)和位势高度等值线(黑实线, 单位: dagpm), 以及气温(彩色区, 单位: ℃)分布蓝色三角形为水电站位置, 图(c)中灰色阴影为青藏高原地形 Fig.4 The distribution of wind vector field (bar, unit: m·s-1, long line means 4 m·s-1 and short line means 2 m·s-1), geopotential height contour (black solid line, unit: dagpm ) and temperature (color area, unit: ℃) at the levels of 200 hPa (a), 500 hPa (b) and 700 hPa (c) at 08:00 on June 4, 2016.The blue triangle is the location of Baihetan hydropower station, and gray area in (c) is the terrain of Qinghai-Xizang Plateau |
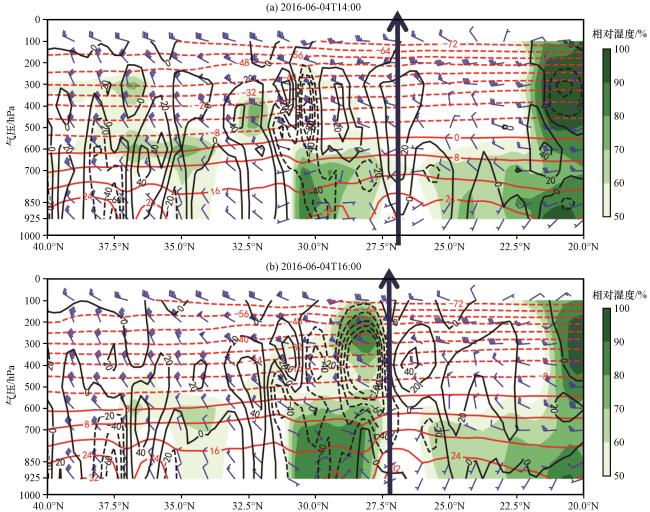
图5 2016年6月4日14:00(a)和16:00(b)沿坝区所在103°E的水平风场(风羽, 单位: m·s-1)、 垂直风速(黑色曲线, 单位: ×10-2 Pa·s-1)、 气温(红色曲线, 单位: ℃)和相对湿度(绿色阴影, 单位: %)的纬度-高度剖面垂直向上箭头为水电站所在纬度 Fig.5 The Latitude-height sections of horizontal wind vector (barb, unit: m·s-1), vertical velocity (black curve, unit: ×102·Pa·s-1), temperature (red curve, unit: ℃) and relative humidity (green shadow, units: %) along the canyon at 103°E longitude at 14:00 (a) and 16:00 (b) on June 4, 2016.The blue arrow shows the latitude of the hydropower station |
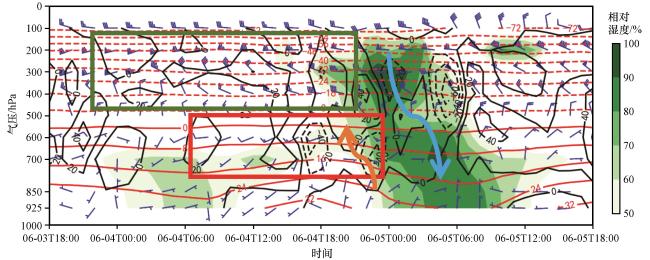
图6 2016年6月3 -5日沿峡谷地形的水平风场(风羽, 单位: m·s-1)、 垂直速度(黑线, 单位: ×10-2 Pa·s-1)、 气温(红线, 单位: ℃)和相对湿度(绿色阴影, 单位: %)的时间变化剖面红色和绿色方框分别为暖平流和冷平流区, 蓝色和棕色箭头分别表示上升和下沉运动 Fig.6 The variation of time-height profile of horizontal wind vector (barb, unit: m·s-1), vertical velocity (black line, unit: ×10-2 Pa·s-1), temperature (red line, unit: ℃), and relative humidity (shaded, unit: %) on June 3 -5, 2016.The box of red and green mean the warm and cold advection zones.Blue and brown arrows mean ascending and descending motion, respectively |
5 雷达探测飑线的中小尺度特征分析
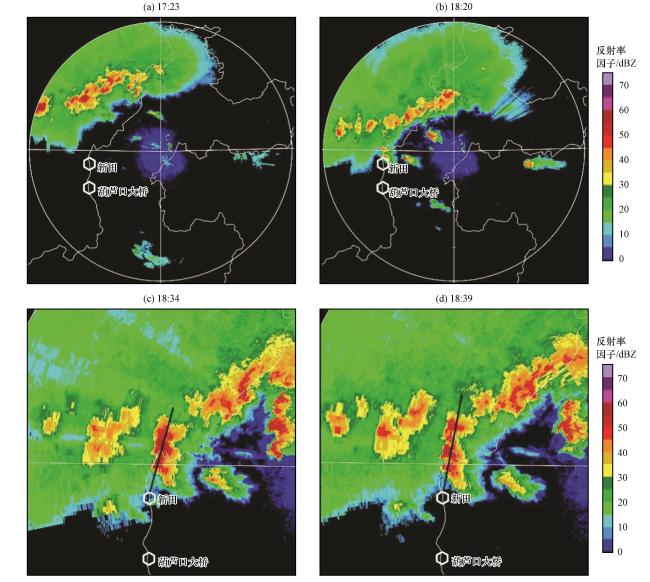
图7 昭通雷达2016年6月4日1.5°仰角探测的反射率因子分布(单位: dBZ)图(c, d)中黑直线为图9(a, b)剖面的基线, 白色曲线为云南和四川的省界 Fig.7 The distribution of reflectivity detected by ZhaoTong radar at 1.5° elevation on June 4, 2016(unit: dBZ).The black lines in (c, d) are the baseline of Fig.9(a, b), and the white curves are the provincial boundaries between Yunnan and Sichuan |

图8 昭通雷达2016年6月4日1.5°仰角的径向速度场(单位: m·s-1)分布图(b, c)中黑直线为图9(b, c)剖面的基线, 白色曲线为云南和四川的省界 Fig.8 The distributions of radial velocity (unit: m· s-1) detected by ZhaoTong radar at 1.5 ° elevation on June 4, 2016.The black in (b, c) is the baseline for the Fig.9 (c, d), and the white curves are the provincial boundaries between Yunnan and Sichuan province |
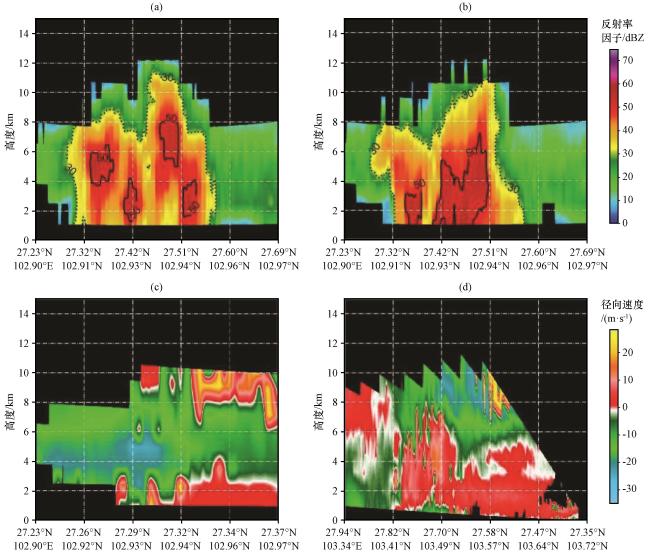
图9 昭通雷达2016年6月4日探测的反射率因子(a~b, 单位: dBZ)和径向速度(c~d, 单位: m·s-1)的剖面图(a, b)以图7(c, d)的黑线为基线, 图(c, d)以图8(b, c)的黑线为基线 Fig.9 The profile of reflectivity (unit: dBZ) and radial velocity (unit: m·s-1) detected by Zhaotong radar on June 4, 2016.Fig.9 (a, b) are based on black line in Fig.7 (c, d), and Fig.9(c, d) are based on black line of Fig.8(b, c) |