论文

柴达木盆地尘卷风的时空分布特征

  • 王梦圆 ,
  • 黄倩 ,
  • 廖慧仁 ,
  • 张永鹏 ,
  • 郭坤
展开
  • 兰州大学大气科学学院,半干旱气候变化教育部重点实验室,甘肃 兰州 730000
黄倩(1970-), 女, 甘肃兰州人, 教授, 主要从事大气边界层和大气湍流的研究.E-mail:

王梦圆(1997 -), 女, 内蒙古呼和浩特人, 硕士研究生, 主要从事大气边界层和大气湍流的研究E-mail:

收稿日期: 2023-04-19

  修回日期: 2023-07-18

  网络出版日期: 2024-03-26

基金资助

国家自然科学基金面上项目(42175088)

甘肃省自然科学基金项目(23JRRA1049)

Spatial and Temporal Distribution Characteristics of Dust Devils in the Qaidam Basin

  • Mengyuan WANG ,
  • Qian HUANG ,
  • Huiren LIAO ,
  • Yongpeng ZHANG ,
  • Kun GUO
Expand
  • Key Laboratory for Semi-Arid Climate Change of the Ministry Education,College of Atmospheric Sciences,Lanzhou University,Lanzhou 730000,Gansu,China

Received date: 2023-04-19

  Revised date: 2023-07-18

  Online published: 2024-03-26

Copyright

© Editorial Department of Plateau Meteorology (CC BY-NC-ND)

摘要

沙尘气溶胶是大气气溶胶的重要组成部分, 其通过辐射效应和对云的形成及降水过程影响全球天气和气候变化, 而尘卷风对全球沙尘气溶胶排放的贡献不容忽视。青藏高原北部的柴达木沙漠为高原尘卷风的发生提供了沙源。为研究柴达木盆地尘卷风的发生条件及其时空特征, 本文利用1991 -2020年ERA5再分析资料评估了尘卷风发生的热力学阈值, 分析青藏高原尘卷风发生时数(PDDPhours)和柴达木盆地尘卷风起沙量的时空分布特征, 探究了1991 -2020年近地面温度递减率(LR)、 对流比(w* /u *)和PDDPhours的变化趋势。利用2016 -2020年德令哈国家基本气象站的地面降水数据、 德令哈空气质量监测站的细颗粒物PM2.5和PM10数据以及Aura卫星臭氧监测仪的紫外吸收性气溶胶指数(UVAI)数据, 分析柴达木盆地夏季尘卷风对PM2.5和PM10的可能贡献。结果表明, w* /u *和LR是影响尘卷风形成的关键因素, 不同热力条件下PDDPhours均具有单峰日变化特征, 在12:00 -16:00(北京时)达到峰值。结合柴达木盆地PDDPhours累计贡献的日变化特征, 确定尘卷风发生的热力学阈值是w* /u *>5和LR>10 K·m-1。分析表明, 青藏高原夏季北部的柴达木盆地和西南部PDDPhours较大。柴达木盆地夏季尘卷风的起沙量最大, 起沙范围也较大, 平均起沙量可达1.28×10⁵ t, 占全年平均起沙量的69.8%。1991 -2020年柴达木盆地LR呈现明显的减小趋势, w* /u *呈增加趋势, 导致PDDPhours有明显的减小趋势。虽然夏季德令哈降水明显较其他季节多, 但夏季UVAI较大, 说明夏季除沙尘暴外尘卷风可能对该地区PM2.5和PM10有重要贡献。

本文引用格式

王梦圆 , 黄倩 , 廖慧仁 , 张永鹏 , 郭坤 . 柴达木盆地尘卷风的时空分布特征[J]. 高原气象, 2024 , 43(2) : 510 -519 . DOI: 10.7522/j.issn.1000-0534.2023.00060

Abstract

Dust aerosols are significant components of atmospheric aerosols, and they play a crucial role in global weather and climate changes through radiative effects and the formation of cloud and precipitation.The impact of dust devils on the worldwide emissions of dust aerosols should not be underestimated.The Qaidam Desert located in the northern part of the Tibetan Plateau is a source of dust devils.To investigate the meteorology conditions that lead to the occurrence of dust devils and to understand their spatial and temporal distribution characteristics in the Qaidam Basin, the thermodynamic criteria of dust devils are examined using the ERA5 reanalysis data from 1991 to 2020.The spatio-temporal distributions of the potential dust devil and dust plumes occurrence (PDDPhours) across the Tibetan Plateau and the estimation of dust emission caused by dust devils and dust plumes in the Qaidam Basin have been carried out based on these criteria.In the analysis of trends from 1991 to 2020, lapse rate (LR), convective ratio (w */u *), and PDDPhours have been examined.The precipitation from the Delingha National Basic Meteorological Station, PM2.5 and PM10 from the Delingha Air Quality Monitoring Station, and ultraviolet aerosol index (UVAI) data derived from the Aura satellite from 2016 to 2020 have been utilized to investigate the contribution of dust devils to PM2.5 and PM10 in summer in the Qaidam Basin.The results show that w*/u* and LR are the primary factors that influence the formation of dust devils.The PDDPhours reveals a diurnal cycle with peaking at 12:00 -16:00 (Beijing Time) under different thermodynamic conditions.Based on the diurnal variation of the cumulative contribution of PDDPhours, the combined w */u * > 5 and LR > 10 K·m-1 criteria are considered to be the most appropriate for determining the occurrence of dust devils in the Qaidam Basin.On the basis of the PDDPhours criteria, the analysis highlights the significant presence of PDDPhours in the Qaidam Basin and the southwestern part of the Tibetan Plateau in summer.The results also reveal that the larger dust devil emissions occur in summer with the average dust emission of up to 1.28×10⁵ t, which accounts for 69.8% of annual dust emissions.The lapse rate has shown a significant downward trend and the convective ratio has shown an upward trend in the Qaidam Basin, which finally lead to an obvious downward trend of PDDPhours.The observations indicate that the annual variation of UVAI shows a larger magnitude in summer, despite there is more precipitation in Delingha during this season compared to others.It indicates that, in addition to the dust storm, dust devils may attribute to PM2.5 and PM10 in summer.

1 引言

沙尘气溶胶是气溶胶的重要组成部分, 在天气和气候变化中扮演重要角色, 它能吸收和散射太阳辐射(Francis et al, 2020Wang et al, 2020b), 为海洋浮游植物提供营养物质(Jickells et al, 2005), 改变云微物理过程影响降水(Spyrou, 2018Schepanski, 2018), 同时还影响人类的生活和健康(Milford et al, 2019Wang et al, 2020a)。沙尘暴是指强风将地面大量沙尘物质吹起并卷入空中, 水平能见度低于1 km的灾害性天气现象, 一般发生在沙漠地带或者干旱区域沙漠化地带(周旭等, 2017), 是全球沙尘排放量的主要来源(Tanaka and Chiba, 2006刘建慧等, 2013)。但是尘卷风也是一种重要的沙尘排放来源(刘莹等, 2018Pan et al, 2021)。
沙尘暴起沙是动力机制, 而尘卷风是由于地表强烈受热引起小尺度湍流涡旋携带地表沙尘向上输送的热力起沙现象, 其中心气压较低且温度较高, 高度一般在十几米, 通常发生在午后(Sinclair, 1969Balme and Greeley, 2006)。关于尘卷风的结构、 旋转方向、 高度等特征已有大量研究(Balme et al, 2003Horton et al, 2016Franzese et al, 2021)。随着研究的深入, 尘卷风的形成机理及其发生的热力学阈值等问题受到越来越多的关注。研究发现在晴朗弱风条件下, 近地面层结不稳定引起热羽并携带沙尘上升, 底部由于周围冷空气的补充导致角动量增大, 进而引起尘羽旋转, 形成尘卷风(Rennó et al, 1998顾兆林等, 2003Ito et al, 2013)。Lyons et al(2008)研究发现代表边界层对流浮力的自由对流速度尺度w *(单位: m·s-1)和近地面摩擦耗散的摩擦速度u *(单位: m·s-1)是决定对流涡旋形成和发展的重要因子。Oke et al(2007)指出当对流比(用w */u *定义)大于5时增大环境风速有利于尘卷风的发生。Ansmann et al(2009)认为地表和2 m高度之间的温度差在17~20 K且水平风速在2~7 m·s-1时有利于对流羽的形成。这些研究结果给出了尘卷风发生的热力学条件, 但不同区域尘卷风发生的热力学条件存在差异, 针对特殊地形尘卷风发生的条件还需要进一步的研究。
青藏高原作为“世界第三极”, 平均海拔4 km, 其高大地形引起的热动力过程对沙尘传输有重要的影响(Xu et al, 2018Tan et al, 2021)。毛睿等(2012)指出青藏高原可能是东亚上空沙尘气溶胶的潜在来源, 但是此结果并未考虑柴达木盆地对青藏高原上空沙尘气溶胶的贡献。柴达木盆地位于青藏高原东北部, 是中国海拔最高的盆地, 接受的太阳辐射较平原地区多。同时周边山脉围绕, 阻挡了外来水汽的滋润, 形成了极端干旱的气候环境, 温差起伏剧烈, 较大温差可能为柴达木盆地尘卷风的发生提供了有利条件(Jiang et al, 2022)。
准确评估尘卷风起沙量对东亚及全球沙尘排放量的贡献具有重要意义。Koch and Rennó(2005)研究发现尘卷风和尘羽对全球沙尘气溶胶收支的贡献约有35%。Jemmett‐Smith et al(2015)使用对流比(w */u *)大于5且近地面温度递减率大于8.5 K·m-1的热力学阈值对全球尘卷风和尘羽发生的气候学评估表明, 尘卷风的起沙量可达729×105 t, 对全球沙尘排放量的贡献约为3.4%。Tang et al(2018)研究表明在东亚地区, 尘卷风对大气气溶胶的贡献率为30.4±13%。Han et al(2016)的研究结果显示尘卷风和尘羽约占中国西部沙漠地区沙尘气溶胶贡献的53%(计算结果存在不确定性)。以上研究结果表明尘卷风起沙量对区域或全球沙尘排放量的贡献不能忽视。因此, 柴达木盆地的尘卷风起沙量值得深入研究。
本文将利用1991 -2020年ERA5再分析资料以及地面降水、 紫外吸收性气溶胶指数、 PM2.5和PM10数据, 研究柴达木盆地潜在尘卷风和尘羽(以下称为尘卷风)发生的热力学阈值, 分析青藏高原尘卷风发生时数和柴达木盆地尘卷风起沙量的时空分布特征。进一步分析1991 -2020年柴达木盆地满足阈值的近地面温度递减率、 对流比以及尘卷风发生时数的变化趋势以及不同季节的变化趋势。以上研究结果将为深入研究影响青藏高原尘卷风的热动力因子提供科学参考。

2 资料来源与方法介绍

2.1 尘卷风发生的热力学阈值

本文利用欧洲中期天气预报中心(ECMWF)提供的1991 -2020年ERA5再分析资料地表温度、 2 m高度温度、 边界层高度、 摩擦速度以及感热通量数据, 计算对流比(w */u *)和近地面温度递减率(LR)。数据的空间分辨率为0.25°×0.25°, 时间分辨率为1 h。其中自由对流速度w *的计算公式如下(Deardorff, 1970):
w * = g T ¯ h ( w T ¯ ) 0 1 3
式中: g T ¯是理想气体下的浮力参数; h是边界层高度; ( w T ¯ ) 0是地表运动热通量。用2 m高度的空气温度和地表温度之间的差值来确定近地面温度递减率。
利用以上数据分析了柴达木盆地近地面温度递减率(LR)、 对流比(w */u *)以及尘卷风发生时数(PDDPhours)的变化趋势, 同时还分析了不同季节的变化趋势。

2.2 尘卷风起沙量

参考Rennó et al(1998)提出的尘卷风热力学理论, 计算尘卷风起沙量。Rennó et al(1998)认为尘卷风的强度与其热力学效率有关, 热力学效率用式(2)表示为:
η = Г a d Z C B L T h
式中: Z CBL是对流边界层顶高度; T h是地表温度; Г ad代表干绝热递减率, 取10 K·km-1。将对流上升气流所占的分数面积定义为:
σ = μ η 1 2 Δ p g T R ρ a i r 3 2 F i n ρ a i r - 1 2
式中: 湍流机械能对流比的无量纲系数μ为12~24; Δ p为地表到对流边界层顶的压强差值; ρ a i r为空气密度; g为重力加速度; 输入对流涡旋的热量通量F in约为11±5 K·W·m-2; 对流边界层的辐射时间尺度T R约为9×10⁵ s。
尘卷风起沙量(Ftot)采用Han et al(2016)研究中用到的公式:
F t o t = P D D P h o u r s × S × σ × F d
式中: PDDPhours为尘卷风和尘羽发生时数(potential dust devil and dusty plume hours, 以下称为发生时数), 由对流比和近地面温度递减率确定, S为沙源面积, 尘卷风的起沙通量Fd 约为0.7±0.3 g·m-2·s-1

2.3 实测资料

使用了2016 -2020年德令哈国家基本气象站地面降水和德令哈空气质量监测站细颗粒物PM2.5、 PM10质量浓度数据, 时间分辨率均为1 h。剔除缺测数据后, 计算得到累计日降水量和PM2.5、 PM10日平均浓度。另外还使用了Aura地球观测系统卫星的臭氧监测仪(OMI)的三级产品紫外吸收性气溶胶指数(UVAI), 空间分辨率为1°×1°, 时间分辨率为1天。该产品定义为两个紫外通道光谱的辐射通量之比, 可以区分吸收性气溶胶(黑碳、 有机碳和沙尘气溶胶)和非吸收性气溶胶(Torres et al, 2007Chen et al, 2012)。一般沙尘暴天气的持续时间约3天(韩廷芳等, 2022), 为减少沙尘暴对夏季PM浓度的影响, 根据格尔木国家基准气候站提供的2016 -2020年夏季的沙尘暴记录数据, 剔除夏季沙尘暴当天及其后2天数据, 并用邻近的日数据插值后进行分析。文中涉及的地图是基于自然资源部标准地图服务系统下载的审图号为GS(2019)1822号的中国地图制作, 底图无修改。

3 柴达木盆地尘卷风特征

3.1 尘卷风发生的热力学阈值

边界层的对流浮力和摩擦耗散是影响尘卷风形成的关键因子, 一般在中尺度地形上用w */u *>5 的条件作为尘卷风形成的基本条件(Lyons et al, 2008)。另外, 近地面的温度递减率也对尘卷风的形成有重要影响。Ansmann et al (2009)对撒哈拉沙漠对流羽垂直廓线的观测研究中发现, 尘卷风发生时地表与2 m高度的温度递减率的变化为8.5~10 K·m-1, 水平风速小于7 m·s-1。不同区域近地面的热力学特征不同, 尘卷风发生的热力学阈值也可能存在差异, 为确定柴达木盆地尘卷风发生的热力学阈值, 首先分析当10 m高度风速小于7 m·s-1时, 柴达木盆地夏季的对流比w */u *和地面到2 m高度温度递减率LR的联合概率密度。从图1可以看出, 柴达木盆地夏季w */u *和LR的平均值分别约为8.8和5.5 K·m-1, 且w */u *和LR出现频率较高的变化范围分别是5~12和3~11 K·m-1。因此将依据w */u *和LR的变化范围, 进一步确定柴达木盆地尘卷风发生的热力学阈值。图2是不同对流比和近地面温度递减率条件下柴达木盆地年平均尘卷风发生时数(PDDPhours)的日变化和PDDPhours累积量的日变化。图2(a)显示不同热力条件下尘卷风发生时数均具有明显的日变化特征, 其发生时间为08:00 -21:00(北京时, 下同), 日变化呈现单峰分布特征, 在12:00 -16:00达到峰值。不同的对流比只影响PDDPhours的峰值, 而对尘卷风的发生时段影响较小。当对流比增大1倍(从5增大到10), PDDPhours减小约一个量级, 这说明自由对流太强不利于尘卷风发生, 因此选择对流比w */u *>5作为阈值。另外, 如果只依据对流比来判断尘卷风的发生, 上午尘卷风发生时数较多, 如图2(b)10:00尘卷风发生时数的累计贡献达到10%, 这不符合尘卷风通常在午后发生的规律。因此进一步利用近地面温度递减率判断尘卷风的发生。因为柴达木盆地夏季LR的平均值约为5.5 K·m-1(如图1), 当w */u *>5和LR>5.5 K·m-1时, 尘卷风发生时数的峰值和时段都有所减小, 但12:00尘卷风发生时数的累积量达到30%[图2(b)], 且到19:00仍有尘卷风发生, 这也不符合一般规律。如果LR增加到11 K·m-1, PDDPhours的发生时段减小为4 h, 这明显小于观测的尘卷风发生时段(Balme and Greeley, 2006)。当LR大于8.5 K·m-1时, 尘卷风发生时数的峰值和时段显著减小, 但12:00发生时数的累积量仍有20%, 考虑到柴达木盆地LR为8.5 K·m-1的概率密度仍然较大, 而尘卷风并不是发生频率较高的天气现象, 因此选取w */u *>5和LR>10 K·m-1作为柴达木盆地尘卷风发生的热力学阈值。
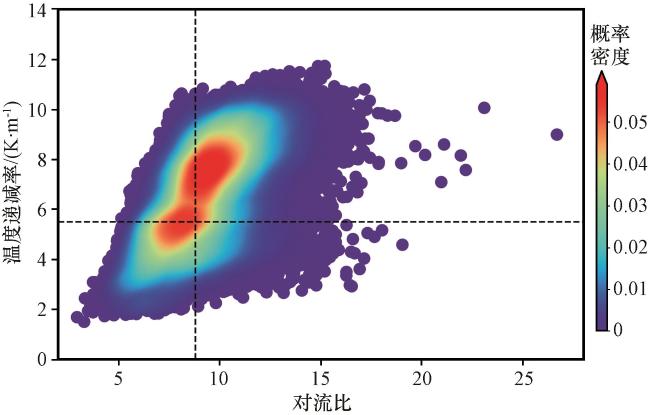
图1 柴达木盆地夏季对流比(w */u *)和近地面温度递减率(LR)的联合概率密度

虚线代表平均值

Fig.1 Joint probability density plot of convective ratio (w */u *) and near-surface temperature lapse rate (LR) in summer in the Qaidam Basin.Dashed lines represent mean values

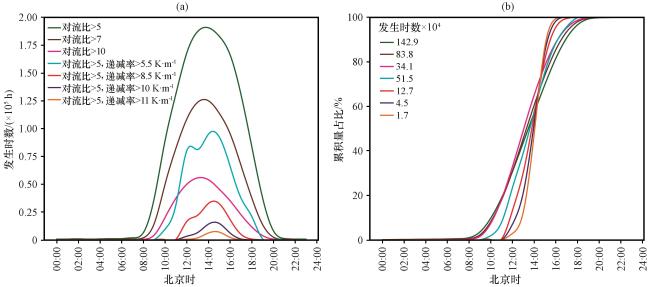
图2 柴达木盆地不同对流比(w */u *)和近地面温度递减率(LR)阈值对应的1991 -2020年的年平均尘卷风发生时数(PDDPhours)的日变化(a)和PDDPhours累积量占比的日变化(b)

Fig.2 Diurnal changes in the annual mean number of PDDPhours during 1991 to 2020 (a) and the cumulative proportion of PDDPhours (b) using different convective ratio (w */u *) and near-surface temperature lapse rate (LR) criteria in the Qaidam Basin

3.2 尘卷风发生时数和起沙量的分布特征

利用确定的柴达木盆地尘卷风发生的热力学阈值, 进一步分析不同季节青藏高原尘卷风发生时数的时空分布特征。从图3可以看出, 青藏高原地区尘卷风发生时数的季节分布特征差异明显。春季[图3(a)]尘卷风多发生在青藏高原以北的库木塔格沙漠、 高原北部的柴达木盆地沙漠, 其中年平均最大发生时数可达234 h。夏季[图3(b)]多发生在高原以北的库木塔格沙漠、 塔克拉玛干沙漠西部以及柴达木盆地, PDDPhours的高值区明显增多, 最大值可达311 h。另外, 春季和夏季在高原西南部冈底斯山脉西侧附近也有PDDPhours高值区, 这可能是受地形和季节的影响, 该地区近地层的气象条件有利于热力对流的生成, 而且近地面风场也能提供一定的角动量, 因此容易形成涡旋, 导致PDDPhours较大。如果地表是土质稀松的裸土, 涡旋可能将尘土卷起, 形成尘卷或尘羽。图3(c)和(d)显示秋冬季PDDPhours明显减少, 冬季PDDPhours最小。综上所述, 青藏高原春夏季尘卷风发生较多, 考虑到沙源地的影响, PDDPhours高值区主要位于柴达木盆地以及高原北部的沙漠地区。
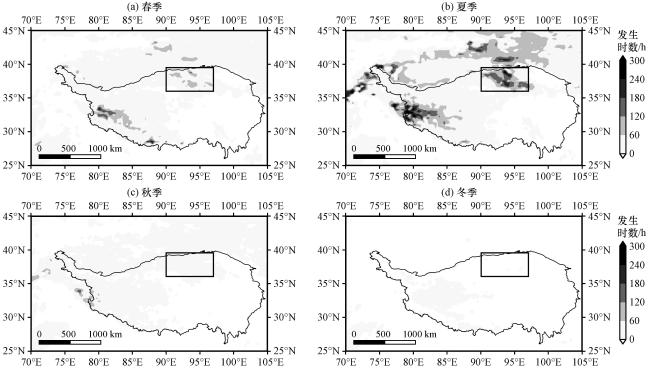
图3 满足热力学阈值条件w */u *>5、 LR > 10 K·m-1的1991 -2020年春季(a)、 夏季(b)、 秋季(c)、 冬季(d)PDDPhours 的空间分布(单位: h)

黑线为海拔为3000 m等值线, 黑色方框表示柴达木盆地

Fig.3 Spatial distribution of PDDPhours under the criteria of w */u *>5, LR > 10 K·m-1 for a time period from 1991 to 2020 in spring(a), summer(b), autumn(c)and winter(d).Unit: h.Black lines represent the altitude of 3000 m, and the black box indicates the location of Qaidam Basin

由于柴达木盆地土地沙漠化面积大, 沙漠化严重(王发科等, 2007), 因此在统计PDDPhours的基础上进一步利用式(4)估算柴达木盆地(图3中黑色矩形区域)尘卷风起沙量(Ftot), 并分析其时空分布特征。从图4可以看出, 柴达木盆地夏季尘卷风起沙量明显较其他季节多, 最大起沙量可达1.74×10⁶ t, 主要分布在大柴旦和格尔木地区, 这与戴升等(2013)研究的盆地气候从暖干向暖湿转型的范围较一致, 即盆地中部的格尔木、 大柴旦及乌兰东部的部分地区属于暖湿轻度转型区。夏季平均起沙量约为1.28×10⁵ t, 占尘卷风和尘羽全年平均起沙量的69.8%(全年平均起沙量约为1.84×10⁵ t)。虽然柴达木盆地夏季尘卷风起沙量较塔克拉玛干沙漠的起沙量小约2个量级, 但是它也是中国的沙尘源区之一, 不仅影响局地的空气质量, 沙尘通过远距离输送也会影响下游地区云和降水过程(Kapp et al, 2011An et al, 2012李本涛等, 2023)。
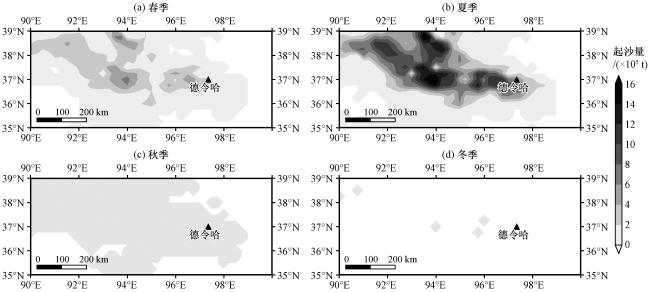
图4 根据PDDPhours估算的 1991-2020年春季(a)、 夏季(b)、 秋季(c)、 冬季(d)柴达木盆地尘卷风平均起沙量的空间分布(单位: ×105 t)

黑色三角形代表德令哈

Fig.4 Spatial distribution of dust emission estimated by PDDPhours in the Qaidam Basin for a time period from 1991 to 2020 in spring(a), summer(b), autumn(c) and winter(d).Unit: ×105 t.The black triangle stands for the location of Delingha

3.3 热力学阈值及尘卷风发生时数的变化趋势

研究发现与北半球气候增暖相比, 高原增暖时间较早, 而且增暖速率也较北半球同纬度区域大(Wu et al, 2012), 同时高原的地表温度也呈显著增加趋势(李栋梁等, 2005)。为进一步了解柴达木盆地尘卷风发生的变化趋势, 分析了1991 -2020年夏季满足尘卷风发生阈值的LR、 w */u *以及PDDPhours的时空变化特征。图5(a)显示, 夏季柴达木盆地区域大于10 K·m-1的LR基本呈减小趋势, 而且大部分地区通过显著性检验, 但是在高原以北地区LR有明显增大趋势。另外, 1991 -2020年柴达木盆地不同季节大于10 K·m-1的LR随时间减小, 其中夏季减小最明显[图5(b)], 且只有夏季LR的变化趋势通过0.05显著性水平检验, 这是因为柴达木盆地夏季地面气温较地表温度的增加速率快(图略), 导致柴达木盆地地区近地面温度递减率减小。夏季大于5的对流比w */u *的空间变化趋势显示[图5(c)], 柴达木盆地西部和东部的部分地区的w */u *有增加趋势, 但是并未通过显著性检验, 而中部地区的w */u *有减小趋势, 并且通过0.05显著性水平检验。图5(d)显示柴达木盆地秋冬季大于5的w */u *随时间减小, 而春夏季却随时间增加, 但是夏秋季的结果并未通过显著性水平检验。
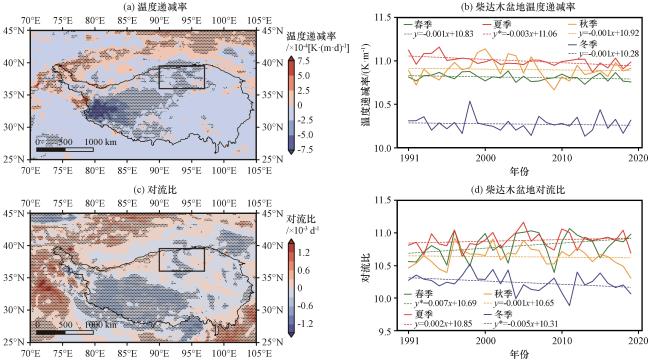
图5 1991 -2020年青藏高原夏季近地面温度递减率LR[a, 单位: ×10-4 K·(m·d)-1]、 对流比w */u *(c, 单位: ×10-3 d-1)的变化趋势和不同季节柴达木盆地温度递减率LR(b)、 对流比w */u *(d)的时间变化 (a~c)中黑线为海拔3000 m的等值线, 黑色方框表示柴达木盆地, 黑色打点区域代表通过了0.05的信度检验; (b~d)中*号代表通过了0.05的信度检验

Fig.5 The trend of surface temperature lapse rate LR [a, unit: ×10-4 K·(m·d)-1], convective ratio (w */u *) (c, unit: ×10-3 d-1)over the Qinghai-Xizang Plateau during the time period of 1991 -2020.And the time series of temperature lapse rate LR (b) and convective ratio (w */u *) (d) at Qaidam Basin in different seasons.Black lines in (a~c) represent the altitude of 3000 m, and the black box indicates the location of Qaidam Basin., and the black dotted area represents a reliability test of 0.05.Stars in the equation in (b~d) denote the significant values at the 95% confidence level

图6(a)是青藏高原夏季PDDPhours的时空变化趋势。可以看出1991 -2020年青藏高原中西部以及柴达木盆地尘卷风发生时数呈减小趋势, 而在高原以北的沙漠地区有增大趋势。从图6(b)可以看出, 柴达木盆地1991 -2020年不同季节的PDDPhours逐渐下降, 均通过了0.05的显著性水平检验, 其中夏季的下降趋势最明显。这与柴达木盆地气候变暖, 近地面地气温差减小有关。另外, 1995年夏季PDDPhours达到最大值, 约为63 h, 2015年约为50 h。春季PDDPhours在1994年达到最大值, 约为30 h。秋季发生时数变化较小, 峰值约为5 h, 冬季发生时数基本为0 h。秋冬季尘卷风发生的气象条件较难满足, 因此PDDPhours及其变化趋势都较小。
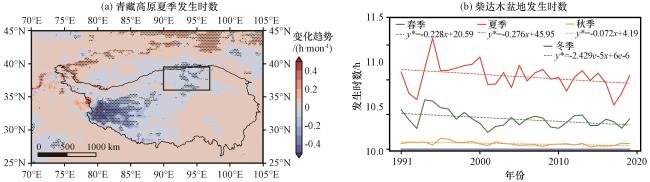
图6 1991 -2020年青藏高原夏季发生时数PDDPhours的变化趋势(a, 单位: h·mon-1)和不同季节柴达木盆地发生时数的时间变化(b, 单位: h)(a)中黑线为海拔3000 m的等值线, 黑色方框表示柴达木盆地, 黑色打点区域代表通过了0.05的信度检验; (b)中*号代表通过了0.05的信度检验

Fig.6 The spatial distribution of PDDPhours trend over the Tibetan Plateau (a, unit: h·mon-1) and the time series of PDDPhours in the Qaidam Basin in different seasons during the time period of 1991 -2020 (b, unit: h).Black lines in (a) represent the altitude of 3000 m, the black box indicates the location of Qaidam Basin, and the black dotted area represents a reliability test of 0.05.Stars in the equation in (b) denote the significant values at the 95% confidence level

虽然柴达木盆地气候由暖干向暖湿转型, 但是其气温增暖速度较快, 导致近地面温度递减率减小, 进而导致PDDPhours存在减小的变化趋势。另外, 对流比也是影响PDDPhours变化的重要因子, w */u *和LR是如何相互作用进而影响尘卷风的发生还需要进一步的模拟研究。

3.4 实测资料分析

为验证柴达木盆地尘卷风在夏季发生频率较高, 选择2016 -2020年PM2.5和PM10的监测数据、 地面降水数据以及紫外吸收性气溶胶指数(UVAI), 分析四种数据的年平均季节变化。从图7可以看出, 德令哈的降水集中在夏季, 夏季累计降水量最多, 最大日降水量约为44.3 mm, 春季次之, 秋冬季最少。德令哈的UVAI为正值, 说明该地区以吸收性气溶胶为主。UVAI呈现平缓的单峰变化, 春季缓慢上升, 夏季达到最大, 但是峰值较小, 秋冬季缓慢下降, 在冬季达到最低值, 说明夏季的吸收性气溶胶比其他三季更多(Sreekanth, 2014)。Pan et al(2021)研究北非地区尘卷风特征时也发现UVAI在夏季最大。图7还显示PM2.5和PM10的季节变化特征基本一致, 春季最大, 平均值分别为27.5 μg·m-3和83.1 μg·m-3; 冬季次之, 平均值约为17.4 μg·m-3和57.7 μg·m-3; 夏季平均值分别为16.8 μg·m-3和40.5 μg·m-3, 秋季平均值与夏季较接近。春冬季PM2.5和PM10质量浓度较大, 可能与冬春季沙尘暴发生频率较高, 引起沙尘气溶胶浓度较高有关。另外, 图7显示, 减少夏季沙尘暴影响的PM2.5和PM10与未减少的差别不大, 这可能与夏季沙尘暴发生频率较低有关。研究发现降水对PM有一定的清除作用(吴亚平等, 2020武高峰等, 2021), 德令哈夏季的降水明显多于秋季, 但夏季德令哈的PM2.5和PM10基本与秋季的一致, 这可能与夏季尘卷风对PM的贡献较多有关。结合夏季UVAI较大的特征, 说明夏季尘卷风可能对德令哈PM2.5和PM10有较大的贡献。
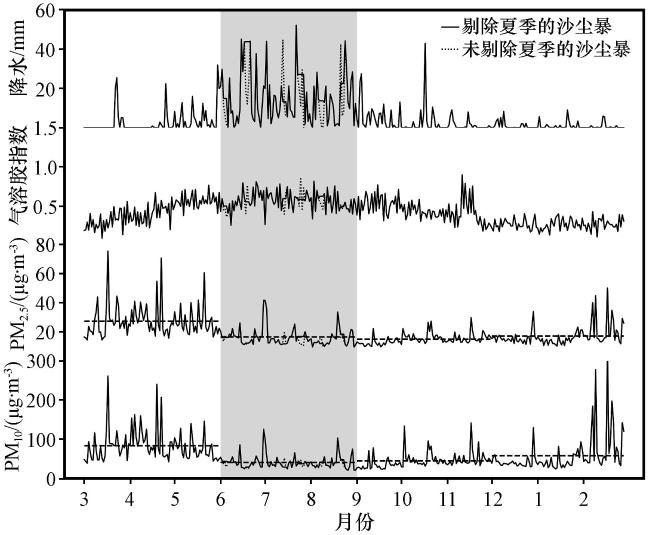
图7 2016 -2020年德令哈紫外吸收性气溶胶指数、 德令哈气象站累计日降水量, 以及德令哈空气质量监测站日平均PM2.5和PM10随时间的变化

阴影表示夏季, 黑色虚线代表各季节平均值

Fig.7 Time series of UV aerosol index at Delingha, cumulative daily precipitation at Delingha meteorological station, PM2.5 and PM10 at Delingha air quality monitoring station from 2016 to 2020.Summer is highlighted in the shaded gray, and black dashed lines represent the seasonal average value

4 结论

本研究利用ERA5再分析资料、 Aura卫星资料、 德令哈国家基本气象站降水数据和空气质量监测站PM数据, 研究了柴达木盆地尘卷风发生的热力学阈值, 并分析了青藏高原尘卷风发生时数和柴达木盆地尘卷风起沙量的时空分布特征, 以及柴达木盆地夏季尘卷风对PM2.5和PM10的可能贡献。得到以下主要结论:
(1) 不同热力条件下尘卷风的发生时数(PDDPhours)呈单峰分布, 在午后达到峰值。对流比只影响PDDPhours的峰值大小, 对尘卷风发生时段的影响较小。综合考虑尘卷风的发生时段和PDDPhours的累计贡献, 将w */u *>5和LR>10 K·m-1确定为柴达木盆地尘卷风发生的热力学阈值。
(2) 青藏高原春夏季PDDPhours最大, 高值区主要位于柴达木沙漠和冈底斯山脉西侧。而柴达木盆地夏季尘卷风的起沙量较大, 平均起沙量可达1.28×10⁵ t, 占全年的69.8%。 另外1991 -2020年近地面温度递减率(满足LR>10 K·m-1)呈现明显的减小趋势, 导致PDDPhours也有减小趋势, 而对流比(满足w */u *>5)表现出增加的趋势。
(3) 德令哈夏季降水明显较其他季节多, 但是夏季PM2.5和PM10浓度与秋季差别不大, 而且夏季UVAI也较大, 说明夏季吸收性气溶胶较多。因此, 除沙尘暴外, 尘卷风可能对夏季柴达木盆地PM2.5和PM10有主要贡献。
An F Y Ma H Z Wei H C, et al, 2012.Distinguishing aeolian signature from lacustrine sediments of the Qaidam Basin in northeastern Qinghai-Tibetan Plateau and its palaeoclimatic implications [J].Aeolian Research, 4: 17-30.DOI: 10.1016/j.aeolia.2011. 12.004 .

Ansmann A Tesche M Knippertz P, et al, 2009.Vertical profiling of convective dust plumes in southern Morocco during SAMUM [J].Tellus B: Chemical and Physical Meteorology61(1): 340.DOI: 10.1111/j.1600-0889.2008.00384.x .

Balme M Greeley R2006.Dust devils on Earth and Mars [J].Reviews of Geophysics44(3): RG3003.DOI: 10.1029/2005RG000188 .

Balme M Metzger S Towner M, et al, 2003.Friction wind speeds in dust devils: a field study: friction wind speeds in dust devils[J].Geophysical Research Letters30(16): 1830.DOI: 10.1029/2003GL017493 .

Chen Z Torres O McCormick M P, et al, 2012.Comparative study of aerosol and cloud detected by CALIPSO and OMI [J].Atmospheric Environment, 51: 187-195.DOI: 10.1016/j.atmosenv. 2012.01.024 .

Deardorff J W1970.Convective velocity and temperature scales for the unstable planetary boundary layer and for rayleigh convection [J].Journal of the Atmospheric Sciences27(8): 1211-1213.DOI: 10.1175/1520-0469(1970)027<1211: CVATSF>2.0.CO; 2 .

Francis D Chaboureau J P Nelli N, et al, 2020.Summertime dust storms over the Arabian Peninsula and impacts on radiation, circulation, cloud development and rain[J].Atmospheric Research, 250: 105364.DOI: 10.1016/j.atmosres.2020.105364 .

Franzese G Silvestro S Vaz D A, et al, 2021.Dust devils: Characteristics of the forward motion from a Saharan survey[J].Aeolian Research, 50: 100678.DOI: 10.1016/j.aeolia.2021.100678 .

Han Y X Wang K H Liu F, et al, 2016.The contribution of dust devils and dusty plumes to the aerosol budget in western China [J].Atmospheric Environment, 126: 21-27.DOI: 10.1016/j.atmosenv.2015.11.025 .

Horton W Miura H Onishchenko O, et al, 2016.Dust devil dynamics: DUST DEVIL[J].Journal of Geophysical Research: Atmospheres121(12): 7197-7214.DOI: 10.1002/2016JD024832 .

Ito J Niino H Nakanishi M2013.Formation mechanism of dust devil-like vortices in idealized convective mixed layers[J].Journal of the Atmospheric Sciences70(4): 1173-1186.DOI: 10.1175/JAS-D-12-085.1 .

Jemmett‐Smith B C Marsham J H Knippertz P, et al, 2015.Quantifying global dust devil occurrence from meteorological analyses [J].Geophysical Research Letters42(4): 1275-1282.DOI: 10.1002/2015GL063078 .

Jiang L W Liu Y J Li W M, et al, 2022.Cenozoic double-layered structure in the western Qaidam Basin, northern Tibetan Plateau, China [J].Journal of Asian Earth Sciences, 232: 105123.DOI: 10.1016/j.jseaes.2022.105123 .

Jickells T D An Z S Andersen K K, et al, 2005.Global iron connections between desert dust, ocean biogeochemistry, and climate [J].Science308(5718): 67-71.DOI: 10.1126/science. 1105959 .

Kapp P Pelletier J D Rohrmann A, et al, 2011.Wind erosion in the Qaidam basin, central Asia: implications for tectonics, paleoclimate, and the source of the Loess Plateau[J].GSA Today21(4): 4-10.DOI: 10.1130/GSATG99A.1 .

Koch J Renno N O2005.The role of convective plumes and vortices on the global aerosol budget[J].Geophysical Research Letters, 32: L18806.DOI: 10.1029/2005GL023420 .

Lyons T J Nair U S Foster I J2008.Clearing enhances dust devil formation[J].Journal of Arid Environments72(10): 1918-1928. DOI: 10.1016/j.jaridenv.2008.05.009 .

Milford C Cuevas E Marrero C, et al, 2019.Impacts of desert dust outbreaks on air quality in urban areas[J].Atmosphere, 11: 23.DOI: 10.3390/atmos11010023 .

Oke A M C Tapper N J Dunkerley D2007.Willy-willies in the Australian landscape: the role of key meteorological variables and surface conditions in defining frequency and spatial characteristics [J].Journal of Arid Environments71(2): 201-215.DOI: 10.1016/j.jaridenv.2007.03.008 .

Pan L Han Y X Lu Z Q, et al, 2021.Integrative investigation of dust emissions by dust storms and dust devils in North Africa [J].Science of The Total Environment, 756: 144128.DOI: 10.1016/j.scitotenv.2020.144128 .

Rennó N O Burkett M L Larkin M P1998.A simple thermodynamical theory for dust devils[J].Journal of the Atmospheric Sciences55(21): 3244-3252.DOI: 10.1175/1520-0469(1998)055<3244: ASTTFD>2.0.CO; 2 .

Schepanski K2018.Transport of Mmineral Ddust and its impact on climate[J].Geosciences, 8: 151.DOI: 10.3390/geosciences8050151 .

Sinclair P C1969.General characteristics of dust devils[J].Journal of Applied Meteorology and Climatology8(1): 32-45.DOI: 10.1175/1520-0450(1969)008<0032: GCODD>2.0.CO; 2 .

Spyrou C2018.Direct radiative impacts of desert dust on atmospheric water content[J].Aerosol Science and Technology, 52: 1-23.DOI: 10.1080/02786826.2018.1449940 .

Sreekanth V2014.On the classification and sub-classification of aerosol key types over south central peninsular India: MODIS-OMI algorithm[J].Science of The Total Environment468-469: 1086-1092.DOI: 10.1016/j.scitotenv.2013.09.038 .

Tanaka T Y Chiba M2006.A numerical study of the contributions of dust source regions to the global dust budget[J].Global and Planetary Change52(1): 88-104.DOI: 10.1016/j.gloplacha. 2006.02.002 .

Tang Y G Han Y X Liu Z H2018.Temporal and spatial characteristics of dust devils and their contribution to the aerosol budget in East Asia-An analysis using a new parameterization scheme for dust devils [J].Atmospheric Environment, 182: 225-233.DOI: 10.1016/j.atmosenv.2018.03.050 .

Tan Z Y Liu Y Z Zhu Q Z, et al, 2021.Impact of massive topography on the dust cycle surrounding the Tibetan Plateau[J].Atmospheric Environment, 264: 118703.DOI: 10.1016/j.atmosenv. 2021.118703 .

Torres O Tanskanen A Veihelmann B, et al, 2007.Aerosols and surface UV products from ozone monitoring instrument observations: an overview[J].Journal of Geophysical Research: Atmospheres, 112: D24S47.DOI: 10.1029/2007JD008809 .

Wang Q Q Gu J W Wang X R2020a.The impact of Sahara dust on air quality and public health in European countries[J].Atmospheric Environment, 241: 117771.DOI: 10.1016/j.atmosenv. 2020.117771 .

Wang Z Bi L Jia X J, et al, 2020b.Impact of dust shortwave absorbability on the East Asian Summer Monsoon[J].Geophysical Research Letters47(19): e2020GL089585.DOI: 10.1029/2020GL089585 .

Wu G X Liu Y M Dong B W, et al, 2012.Revisiting Asian monsoon formation and change associated with Tibetan Plateau forcing: I.Formation[J].Climate Dynamics39(5): 1169-1181.DOI: 10.1007/s00382-012-1334-z .

Xu C Ma Y M Yang K, et al, 2018.Tibetan Plateau impacts on global dust transport in the upper troposphere[J].Journal of Climate31(12): 4745-4756.DOI: 10.1175/JCLI-D-17-0313.1 .

戴升, 申红艳, 李林, 等, 2013.柴达木盆地气候由暖干向暖湿转型的变化特征分析 [J].高原气象32(1): 211-220.DOI: 10.7522/j.issn.1000-0534.2012.00021.Dai S

Sheng H Y Li L, et al, 2013.Analysis on climatic transition characteristic from warm-dry to warm-wet in Tsaidam Basin[J].Plateau Meteorology32(1): 211-220.DOI: 10.7522/j.issn.1000-0534.2012.00021 .

顾兆林, 赵永志, 郁永章, 等, 2003.尘卷风的形成、 结构和卷起沙尘过程的数值研究[J].气象学报(6): 751-760.DOI: 10.11676/qxxb2003.076.Gu Z L

Zhao Y Z Yu Y Z, et al, 2003.Numerical study of the fomation evolution and structure of dust devil[J].Acta Meteorologica Sinica, (6): 751-760.DOI: 10.11676/qxxb2003.076 .

韩廷芳, 陈宏松, 祁玉佳, 等, 2022.2020年夏季格尔木一次沙尘暴过程中地面气象要素和AQI的响应[J].青海环境32(1): 12-15+20.

Han T F Chen H S Qi Y J, et al, 2022.Response of surface meteorological elements and AQI to a sandstorm process in golmud in summer of 2020 [J].Journal of Qinghai Environment32(1): 12-15+20.

李栋梁, 钟海玲, 吴青柏, 等, 2005.青藏高原地表温度的变化分析 [J].高原气象24(3): 291-298.

Li D L Zhong H L Wu Q B, et al, 2005.Analyses on changes of surface temperature over Qinghai-Xizang Plateau [J].Plateau Meteorology24(3): 291-298.

刘建慧, 赵天良, 韩永翔, 等, 2013.全球沙尘气溶胶源汇分布及其变化特征的模拟分析[J].中国环境科学33(10): 1741-1750.DOI: 10.3969/j.issn.1000-6923.2013.10.003.Liu J H

Zhao T L Han Y X, et al, 2013.Modeling study on distributions and variations of global dust aerosol sources and sinks[J].China Environmental Science33(10): 1741-1750.DOI: 10.3969/j.issn.1000-6923.2013.10.003 .

刘莹, 韩永翔, 杨文清, 等, 2018.沙尘天气、 尘卷风对沙漠地区起沙量的贡献[J].中国沙漠38(6): 1175-1179.DOI: 10.7522/j.issn.1000-694X.2017.00106.Li Y

Han Y X Yang W Q, et al, 2018.Impacts of sand weathers and dust devils on the local dust emission amount[J].Journal of Desert Research38(6): 1175-1179.DOI: 10.7522/j.issn.1000-694X.2017.00106 .

李本涛, 张镭, 张云舒, 等, 2023.青藏高原沙尘气溶胶时空变化及其来源地分析[J].高原气象42(3): 564-574.DOI: 10.7522/j.issn.1000-0534.2022.00100.Li B T

Zhang L Zhang Y S, et al, 2023.Temporal and spatial changes of dust aerosol over Qinghai-Xizang(Tibet)Plateau and analysis on its source regions[J].Plateau Meteorology42(3): 564-574.DOI: 10.7522/j.issn.1000-0534.2022.00100 .

毛睿, 龚道溢, Shao Y P, 等, 2012.青藏高原对东亚上空沙尘气溶胶贡献的数值模拟分析[J].中国科学: 地球科学42(7): 1094-1103.DOI: 10.1360/zd-2012-42-7-1094.Mao R

Gong D Y Shao Y P, et al, 2012.Numerical analysis for contribution of the Tibetan Plateau to dust aerosols in the atmosphere over the East Asia[J].Scientia Sinica(Terrae)42(7): 1094-1103.DOI: 10.1360/zd-2012-42-7-1094 .

王发科, 苟日多杰, 祁贵明, 等, 2007.柴达木盆地气候变化对荒漠化的影响[J].干旱气象(3): 28-33.DOI: 10.3969/j.issn.1006-7639.2007.03.005.Wang F K

Gong R D J Qi G M, et al, 2007.Effect of climate change on desertification in Qaidam Basin[J].Journal of Arid Meteorology, (3): 28-33.DOI: 10.3969/j.issn.1006-7639.2007.03.005 .

吴亚平, 张琦, 王炳赟, 等, 2020.四川雅安三种主要大气污染物浓度与气象条件的关系及其预测研究[J].高原气象39(4): 889-898.DOI: 10.7522/j.issn.1000-0534.2019.00115.Wu Y P

Zhang Q Wang B Y, et al, 2020.The forcast of three major atmospheric pollutants concentrations and its relationships with meteorological factors in Ya'an, Sichuan Province[J].Plateau Meteorology39(4): 889-898.DOI: 10.7522/j.issn.1000-0534.2019.00115 .

武高峰, 王丽丽, 董洁, 等, 2021.北京城区降水对PM_(2.5)和PM_(10)清除作用分析[J].中国环境监测37(3): 83-92.DOI: 10.19316/j.issn.1002-6002.2021.03.11.Wu G F

Wang L L Dong J, et al, 2021.Effects of precipitation on the removal of PM2.5 and PM10 in Beijing urban area[J].Environmental Monitoring in China37(3): 83-92.DOI: 10.19316/j.issn.1002-6002.2021.03.11 .

周旭, 张镭, 陈丽晶, 等, 2017.沙尘暴过程中沙尘气溶胶对气象场的影响[J].高原气象36(5): 1422-1432.DOI: 10.7522/j.issn.1000-0534.2016.00110.Zhou X

Zhang L Chen L J, et al, 2017.Influence of the dust aerosols on meteorological fields during dust storm[J].Plateau Meteorology36(5): 1422-1432.DOI: 10.7522/j.issn.1000-0534.2016.00110 .

文章导航

/