

1 引言
2 数据来源和方法介绍
2.1 数据来源
2.2 区域性极端大风的定义
2.3 大气环流指数定义
2.4 分析方法
3 高原中东部地区极端大风时空分布及变化特征
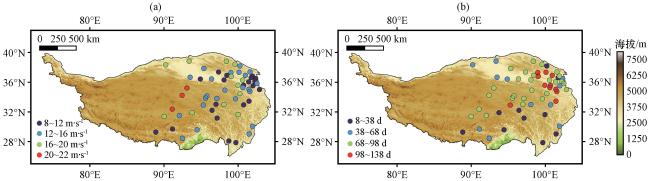
3.1 极端大风事件空间分布
3.2 极端大风长期变化特征
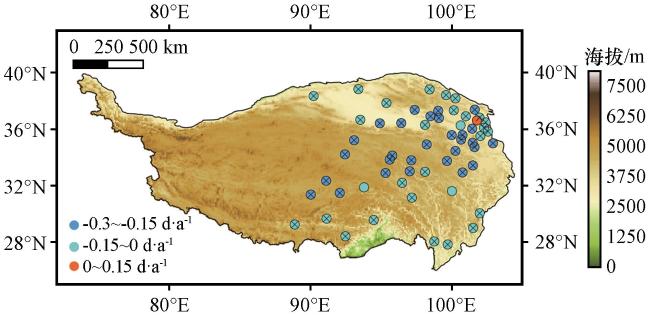
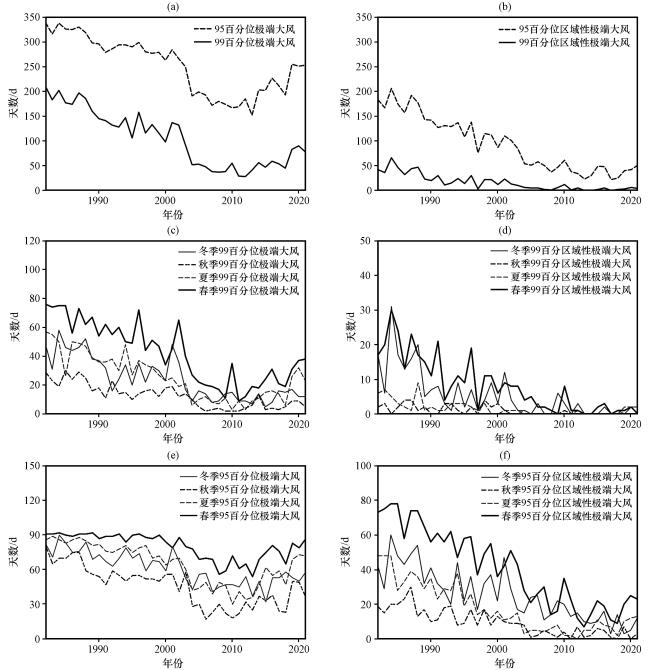
图3 1982 -2021年极端大风(a)和区域性极端大风(b)日数的年际变化, 不同季节99百分位(c)和95百分位(d)极端大风日数的年际变化, 以及99百分位(e)和95百分位(f)区域性极端大风日数年际变化Fig.3 Interannual variation in the number of extreme wind days (a) and regional extreme wind days (b), the interannual variation in the number of extreme wind days (c) and 95th (d) in different seasons, and regional extreme wind days (e) and 95th (f) from 1982 to 2021 |
表1 1982 -2021年95和99百分位阈值的极端大风日数、 区域性极端大风日数的线性变化趋势Table 1 Linear trends in the number of extreme wind days at the 95th and 99th percentile thresholds and regional extreme wind days from 1982 to 2021 |
| | | |||
|---|---|---|---|---|
| | | | | |
| 全年 | ||||
| 春季 | ||||
| 夏季 | ||||
| 秋季 | ||||
| 冬季 | ||||
*表示趋势通过95%的显著性检验(* represents the trend exceeding the 95% confidence level) |
表2 第一个时段(P1: 1982 -2003年)和第二个时段(P2: 2004 -2021年)的年极端大风日数的线性变化趋势Table 2 Linear trend of annual extreme wind days for the first period (P1: 1982 -2003) and the second period (P2: 2004 -2021) |
| | | |
|---|---|---|
| | | |
| | ||
| | ||
*表示趋势通过95%的显著性检验(* represents the trend exceeding the 95% confidence level) |
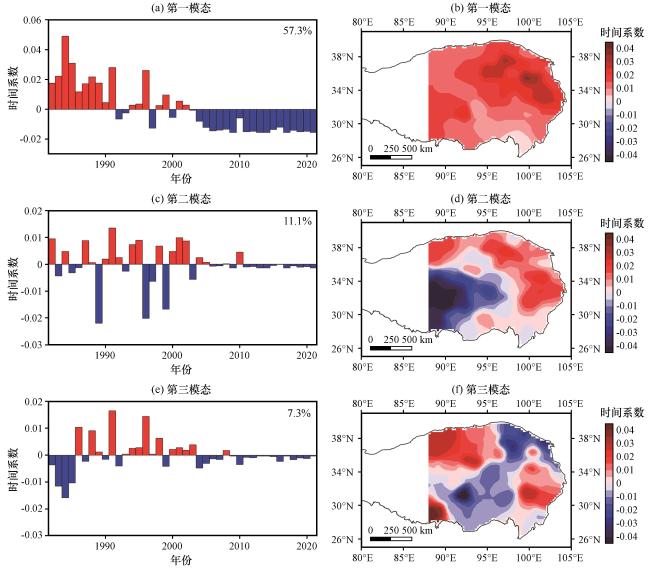
图4 1982 -2021年春季区域性极端大风频次EOF分析的前三模态时间系数序列(a, c, e)及其对应的空间分布(b, d, f)(a, b) 第一模态, (c, d) 第二模态, (e, f) 第三模态Fig.4 The first three mode time coefficient series (a, c, e) and corresponding spatial distribution (b, d, f) of EOF analysis of regional extreme wind frequency in Spring from 1982 to 2021.(a, b) First mode, (c, d) Second mode, (e, f) Third mode |
4 春季区域性极端大风发生期间大气环流异常特征
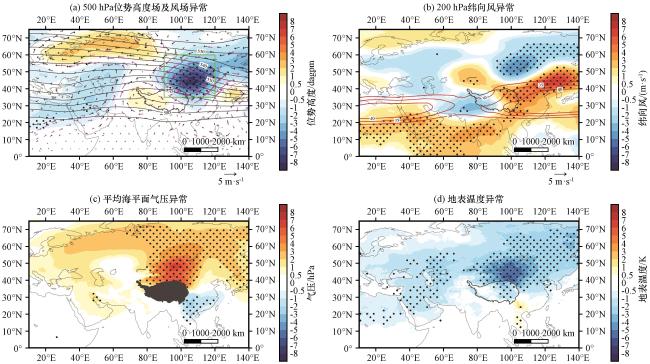
图5 春季平均500 hPa位势高度(等值线, 单位: dagpm)及春季区域性极端大风发生期间500 hPa位势高度(彩色区, 单位: dagpm)和风场(矢量, 单位: m·s-1)异常(a)、 200 hPa纬向风(彩色区, 单位: m·s-1)异常及急流区(等值线, 单位: m·s-1)(b)、 平均海平面气压(彩色区, 单位: hPa)异常(c)和地表温度(彩色区, 单位: K)异常(d)的空间分布绿色框线表示位势高度异常关键区, 紫色矢量和打点区域表示通过95%显著性水平检验Fig.5 Spatial distribution of 500 hPa geopotential height in spring (contour line, unit: dagpm) and 500 hPa geopotential height (color area, unit: dagpm) and wind field (vector, unit: m·s-1) anomaly (a), 200 hPa zonal wind (color area, unit: m·s-1) anomaly and jet stream region (contour line, unit: m·s-1) (b), mean sea level pressure (color area, unit: hPa) anomaly (c), and surface temperature (color area, unit: K) anomaly (d) during regional extreme wind in spring.The green box indicates the key area of geopotential height anomaly, and purple vectors and dotted areas indicate the difference are significant above 95% confident level |
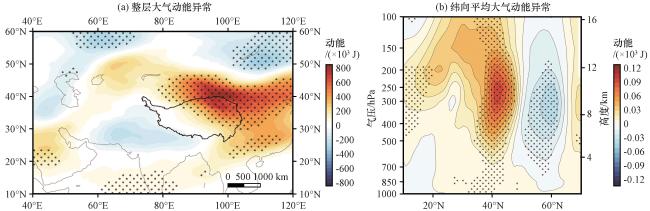
图6 1982 -2021年春季区域性极端大风发生时整层大气动能异常(a)和70°E -110°E纬向平均大气动能(b)异常的垂直剖面(单位: ×103 J)打点区域通过95%显著性水平检验 Fig.6 Vertical profile of whole-layer atmospheric kinetic energy anomaly (a) and zonal mean atmospheric kinetic energy (b) anomaly during regional extreme wind during spring from 1982 to 2021.Unit: ×103 J.Dotted areas indicate the difference are significant above 95% confident level |
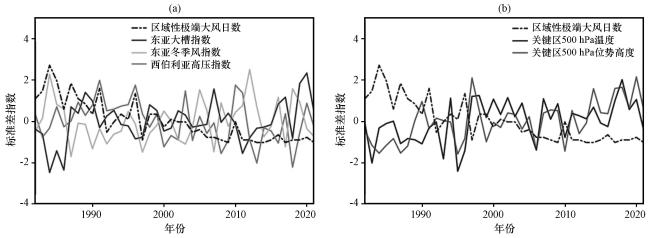
图7 1982 -2021年春季区域性极端大风日数和东亚大槽(EAT)、 东亚冬季风指数(IEWAM)以及西伯利亚高压指数(SHI)标准化序列(a), 500 hPa区域平均(35°N -60°N, 90°E -120°E)位势高度和温度标准化序列(b)Fig.7 The normalized series of regional extreme gale days and East Asian Trough (EAT), East Asian Winter Monsoon Index (IEWAM) and Siberian High Pressure Index (SHI) in spring from 1982 to 2021 (a), and Normalized sequence of regional mean (35°N -60°N, 90°E -120°E) geopotential height and temperature over 500 hPa (b) |
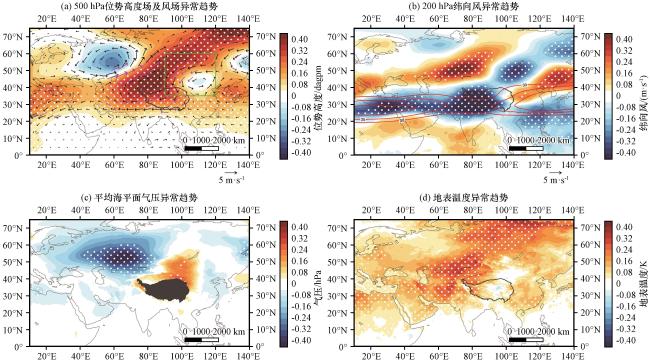
图8 春季区域性极端大风发生期间500 hPa位势高度(彩色区, 单位: dagpm)及风场(矢量, 单位: m·s-1)异常趋势(a), 春季气候平均的急流区(等值线, 单位: m·s-1)和春季区域性极端大风发生期间200 hPa纬向风(彩色区, 单位: m·s-1)异常趋势(b)、 平均海平面气压(彩色区, 单位: hPa)异常趋势(c)和地表温度(彩色区, 单位: K)(d)异常趋势的空间分布绿色框线表示位势高度异常关键区, 紫色矢量和打点区域表示通过95%显著性水平检验 Fig.8 Abnormal trend of geopotential height (color area, unit: dagpm) and wind (vector, unit: m·s-1) field at 500 hPa during regional extreme wind in spring (a).Spring climate mean jet stream (contour line, unit: m·s-1) and spatial distribution of 200 hPa zonal wind (color area, unit: m·s-1) anomaly (b), mean sea level pressure (color area, unit: hPa) anomaly (c) and surface temperature (color area, unit: K) anomaly (d) in spring regional extreme gale.The green box indicates the key area of geopotential height anomaly, and purple vectors and dotted areas indicate areas with the difference exeeding 95% confident level |
5 春季区域性极端大风频次下降的可能原因
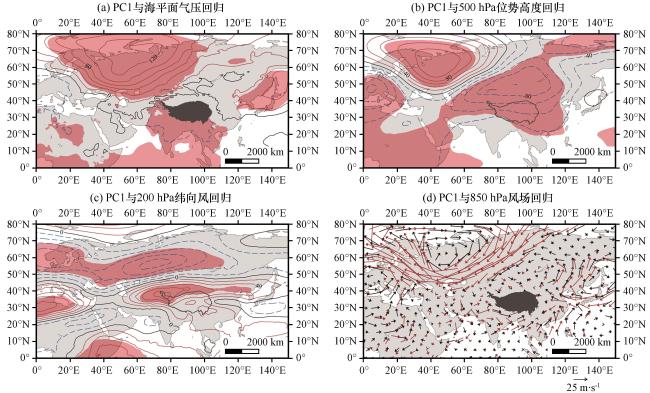
图9 1982 -2021年春季平均海平面气压(a, 单位: hPa), 500 hPa位势高度(b, 单位: dagpm), 200 hPa纬向风(c, 单位: m·s-1), 850 hPa风场(d, 单位: m·s-1)与区域性极端大风频次EOF分析PC1的回归场蓝色实线表示回归系数为正, 红色虚线表示回归系数为负, 填色区域和红色矢量表示通过95%信度检验, 灰色覆盖为青藏高原区域 Fig.9 Spring mean sea level pressure (a, unit: hPa), 500 hPa geopotential height (b, unit: dagpm), 200 hPa zonal wind (c, unit: m·s-1), 850 hPa wind field (d, unit: m·s-1) and regional extreme wind frequency from 1982 to 2021 EOF analyzed PC1 regression field.The solid blue line represents a positive value and the dotted red line represents a negative value.The solid blue line indicates that the regression coefficient is positive, and the colored area and the red vector indicate that they pass the 95% confidence test, and the gray coverage is the Qinghai-Xizang (Tibetan) Plateau region |
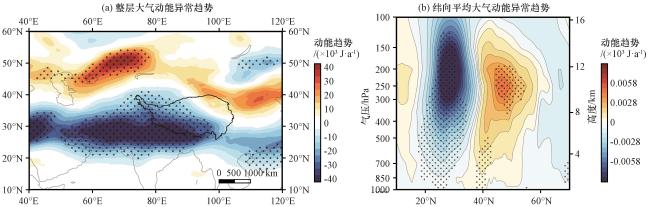
图10 1982 -2021年春季区域性极端大风发生时整层大气动能异常的变化趋势(a)和70°E -110°E 平均大气动能异常的变化趋势的垂直剖面图(b)(单位: ×103 J∙a-1)打点区域通过95%显著性水平检验 Fig.10 Vertical profile of variation trend of whole-layer atmospheric kinetic energy anomaly (a) and zonal mean atmospheric kinetic energy anomaly (b) during regional extreme wind during spring from 1982 to 2021.Unit: ×103 J∙a-1.Dotted area indicates regions with the difference exceeding 95% confident level |
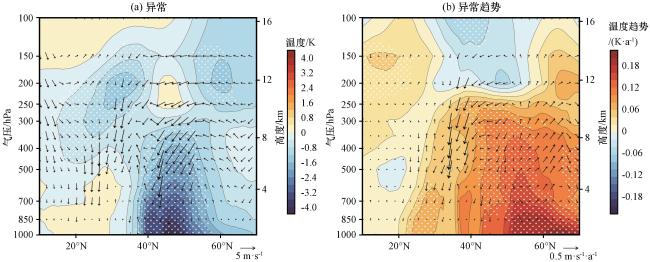
图11 1982 -2021年春季区域性极端大风发生期间70°E -110°E 平均气温(彩色区, 单位: K)和风场(矢量, 单位: m·s-1)异常(a)及其变化趋势(b)的垂直剖面图打点区域通过95%显著性信度检验 Fig.11 Vertical profile of latitudinal mean air temperature (color area, unit: K) and wind (vector, unit: m·s-1) field anomalies (a) and their variation trend (b) during regional extreme gales during spring from 1982 to 2021.Dotted area indicates regions with the difference exceeding 95%confident level |
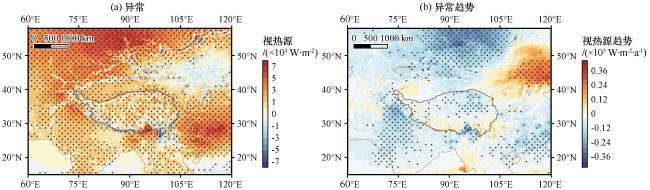


图12 1982 -2021年春季区域性极端大风发生时整层大气视热源异常(a, 单位: ×103 W∙m-2)及其变化趋势(b, 单位: ×103 W∙m-2∙a-1)打点区域通过95%显著性水平检验 Fig.12 Anomaly of apparent heat source in the whole atmosphere during regional extreme wind in spring 1982 -2021 (a, unit: ×103 W∙m-2) and its variation trend (b, unit: ×103 W∙m-2∙a-1).Dotted area indicates regions with the difference exceeding 95% confident level |