

1 引言
2 数据来源与方法介绍
2.1 数据来源
2.2 方法
2.2.1 相关分析
2.2.2 BEAST方法
2.2.3 低涡数据统计标准划分
3 高原低涡活动的时空特征分析
3.1 1950 -2021年高原低涡个数与持续时间变化
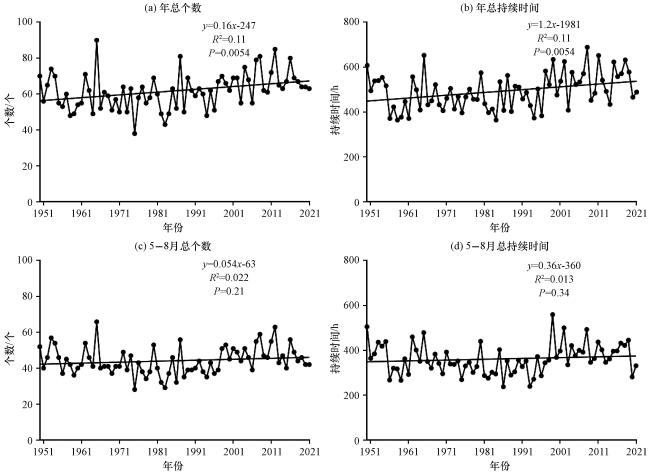
图2 1950 -2021年(a, b), 1950 -2021年5 -8月(c, d)高原低涡个数(a, c)及持续时间(b, d)变化过程Fig.2 Numbers (a, c) and duration (b, d) of Plateau Vortex during 1950 -2021 (a, b), and May-August 1950 -2021 (c, d) |
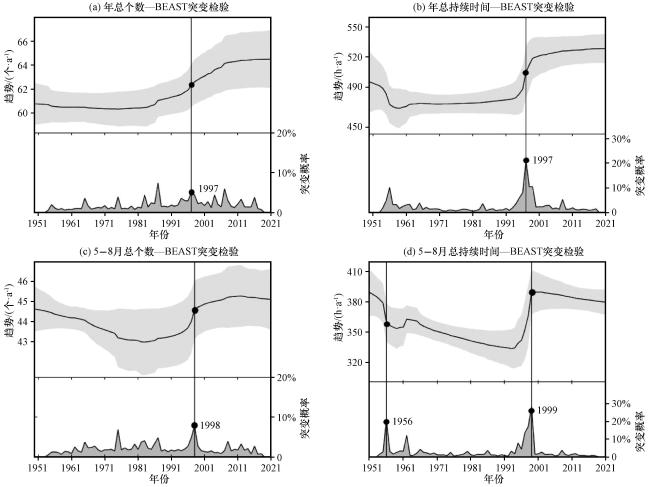
图4 1950 -2021年(a, b), 1950 -2021年5 -8月(c, d)高原低涡个数(a, c)及持续时间(b, d)的BEAST分解和突变点检测拟合趋势线周围的灰色包络线为95%置信区间 Fig.4 Numbers (a, c) and duration (b, d) of Plateau Vortex - using BEAST decomposition and change point detection during 1950 - 2021 (a, b), and May-August 1950 -2021 (c, d).The gray envelope around the fitted trend line are 95% confidence intervals |
表1 各变量通过BEAST分解后可能出现的突变点个数及其概率Table 1 Number of possible change points and their probabilities for each variable by BEAST decomposition |
| 突变点 个数/个 | 1950 -2021年高原低涡可能突变概率 | |||
|---|---|---|---|---|
| 年总 个数 | 5 -8月总 个数 | 年总持续 时间 | 5 -8月总 持续时间 | |
| 0 | 22.90% | 14.80% | 9.70% | 8.00% |
| 1 | 46.30% | 38.50% | 50.10% | 34.70% |
| 2 | 20.10% | 22.50% | 25.20% | 24.40% |
| 3 | 6.50% | 12.90% | 9.00% | 16.20% |
| 4 | 2.50% | 6.90% | 3.90% | 8.00% |
表2 各变量通过BEAST分解后可能出现突变的年份及其概率Table 2 Years and their probabilities of possible change points in each variable by BEAST decomposition |
| 概率 大小 排序 | 1950 -2021年高原低涡可能突变的年份及概率 | |||
|---|---|---|---|---|
| 年总 个数 | 5 -8月 总个数 | 年总持续 时间 | 5 -8月总 持续时间 | |
| 1 | 1997 (14.29%) | 1998 (25.18%) | 1997 (43.53%) | 1999 (59.82%) |
| 2 | 1987 (11.19%) | 1987 (12.79%) | 1956 (14.98%) | 1956 (26.10%) |
| 3 | 2007 (10.60%) | 1966 (12.58%) | 1960 (8.40%) | 1962 (18.73%) |
| 4 | 1965 (6.56%) | 2008 (12.28%) | 2008 (5.62%) | 2008 (9.60%) |
| 5 | 1975 (5.91%) | 1975 (11.43%) | 1984 (5.58%) | 1965 (9.48%) |
3.2 1950 -2021年高原低涡强度及路径分析
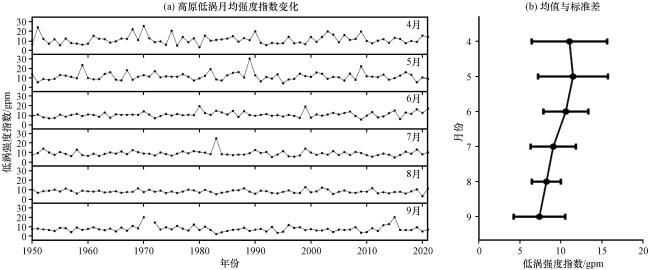
图5 1950 -2021年4 -9月高原低涡月均强度指数变化(a), 强度指数均值与标准差(b)(b)中圆点表示强度指数平均值, 横线左右位置表示平均值±标准差 Fig.5 Variation of monthly average intensity (a) and mean and standard deviation of intensity index (b) of Plateau Vortex from April to September during 1950 -2021.In Fig.5(b), the dot represents the mean value, while the horizontal line indicates the range of standard deviation |
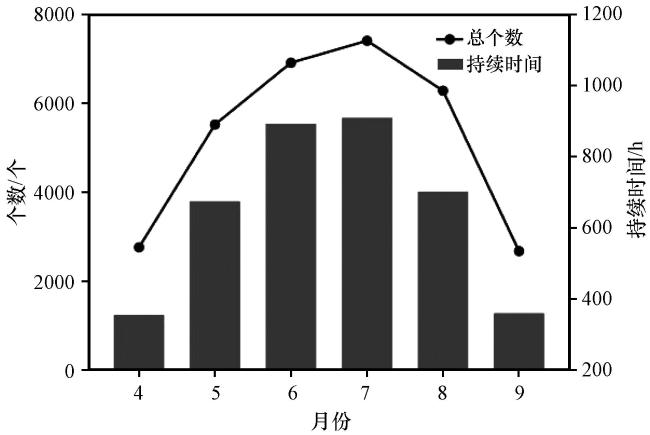
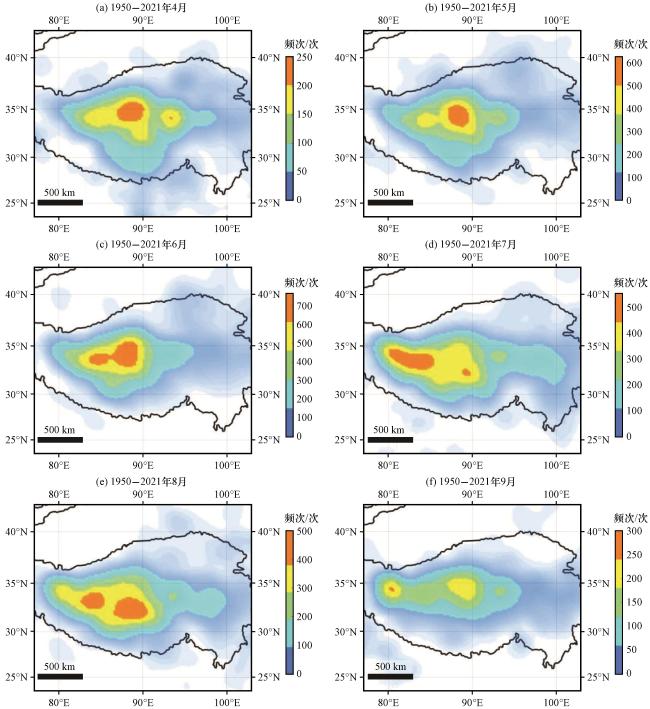
4 高原低涡活动的敏感区识别及其与陆面关联的分析
4.1 影响高原低涡活动的敏感区划分
表3 高原低涡中心点密集区子区域划分Table 3 Subregional division of the dense zone of Plateau Vortex Center |
| 纬度范围 | 经度范围 | ||
|---|---|---|---|
| 78°E -82°E | 82°E -86°E | 86°E -90°E | |
| 30°N -34°N | S1 | S2 | S3 |
| 32°N -36°N | S4 | S5 | S6 |
| 34°N -38°N | S7 | S8 | S9 |
表4 1950 -2021年4 -9月高原低涡中心点在密集区子区域内出现的概率Table 4 Probability of occurrence of Plateau Vortex Center in the subregion of the dense zone from April to September during 1950 -2021 |
| 区域 | 高原低涡中心点出现概率 | |||||
|---|---|---|---|---|---|---|
| 4月 | 5月 | 6月 | 7月 | 8月 | 9月 | |
| S1 | 0.78% | 1.92% | 2.61% | 5.76% | 5.59% | 4.99% |
| S2 | 6.56% | 9.48% | 14.31% | 13.78% | 14.18% | 8.04% |
| S3 | 9.79% | 13.77% | 16.01% | 15.30% | 18.11% | 9.89% |
| S4 | 3.23% | 5.40% | 6.57% | 11.44% | 10.27% | 14.66% |
| S5 | 13.99% | 14.80% | 18.38% | 15.20% | 14.20% | 13.60% |
| S6 | 19.34% | 20.02% | 22.86% | 15.04% | 16.22% | 19.29% |
| S7 | 3.09% | 3.76% | 3.98% | 5.79% | 4.88% | 9.49% |
| S8 | 8.91% | 7.45% | 6.76% | 4.60% | 4.56% | 7.02% |
| S9 | 15.70% | 13.85% | 13.78% | 7.94% | 8.14% | 13.82% |
| M | 47.65% | 53.43% | 60.90% | 56.41% | 58.49% | 56.51% |
粗体表示每月前两个高原低涡中心点出现概率最大的子区域(Bold indicates the sub regions with the highest probability of occurrence of the center points of the first two plateau vortices per month) |
表5 1950 -2021年4 -9月经过敏感区的高原低涡个数及比率统计Table 5 Statistics on the number and ratio of Plateau Vortex passing through the sensitive area from April to September during 1950 -2021 |
| 项目 | 1950 -1959年 | 1960 -1969年 | 1970 -1979年 | 1980 -1989年 | 1990 -1999年 | 2000 -2009年 | 2010 -2021年 |
|---|---|---|---|---|---|---|---|
| (a)4 -9月总个数/个 | 538 | 541 | 498 | 512 | 527 | 577 | 708 |
| (b)经敏感区个数/个 | 336 | 360 | 308 | 334 | 353 | 368 | 428 |
| b/a | 62.45% | 66.54% | 61.85% | 65.23% | 66.98% | 63.78% | 60.45% |
表6 1950 -2021年4 -9月经过敏感区且PVII≥20 gpm的高原低涡中心点及比率统计Table 6 Statistics on the number and ratio of Plateau Vortex Center passing through sensitive areas with intensity index not less than 20 gpm from April to September of 1950 -2021 |
| 年份 | 个数/个 | 比率 | ||||
|---|---|---|---|---|---|---|
| (a)低涡中心 | (b)PVII-20 | (c)PVII-20S | b/a | c/a | c/b | |
| 1950 -1959年 | 4375 | 494 | 390 | 11.29% | 8.91% | 78.95% |
| 1960 -1969年 | 4362 | 542 | 436 | 12.43% | 10.00% | 80.44% |
| 1970 -1979年 | 4117 | 589 | 400 | 14.31% | 9.72% | 67.91% |
| 1980 -1989年 | 4058 | 636 | 459 | 15.67% | 11.31% | 72.17% |
| 1990 -1999年 | 4278 | 517 | 351 | 12.09% | 8.20% | 67.89% |
| 2000 -2009年 | 4742 | 699 | 469 | 14.74% | 9.89% | 67.10% |
| 2010 -2021年 | 5613 | 791 | 562 | 14.09% | 10.01% | 71.05% |
4.2 青藏高原陆面关键参量的时空分布特征
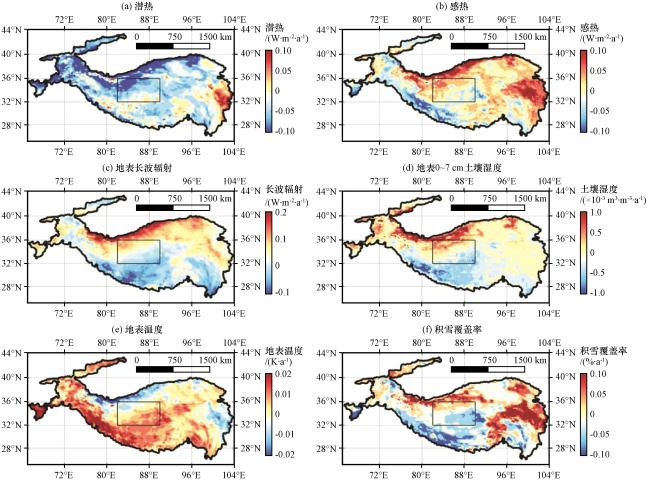
图8 1950 -2021年4 -9月青藏高原地表潜热通量(a)、 地表感热通量(b)、 地表长波辐射(c)、 地表0~7 cm土壤湿度(d)、 地表温度(e)、 积雪覆盖率(f)线性变化趋势分布黑色矩形区域为敏感区 Fig.8 Distribution of linear trends in surface latent heat flux (a), surface sensible heat flux (b), surface net thermal radiation (c), surface 0~7 cm soil moisture (d), surface temperature (e), and snow cover (f) on the Qinghai-Xizang Plateau from April to September during 1950 -2021.The black rectangular areas are sensitive areas |
4.3 陆面关键参量与高原低涡个数和持续时间的相关性
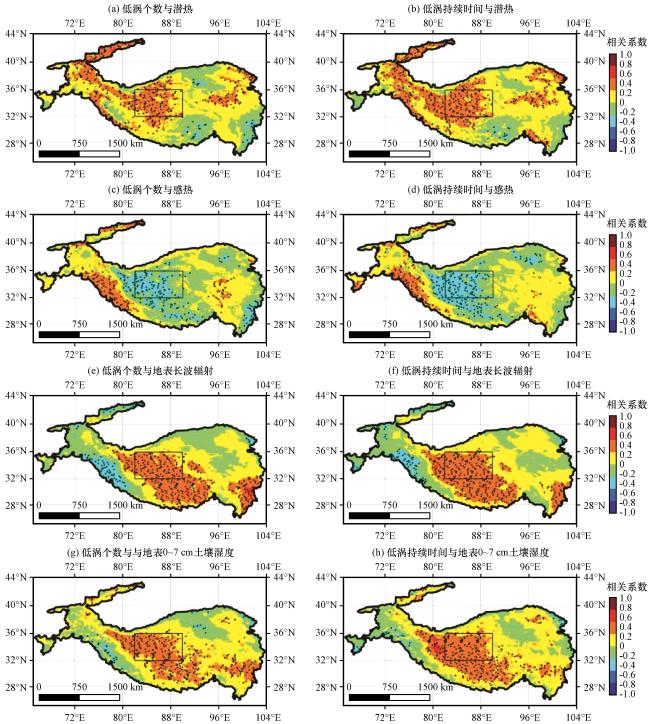
图9 1950 -2021年4 -9月高原低涡个数、 持续时间分别与各变量的相关系数黑色矩形区域为敏感区, 打点区域为通过了0.05显著性检验 Fig.9 Correlation coefficients of the number and duration of Plateau Vortex with each variable, respectively, from April to September 1950 -2021.The black rectangular areas are sensitive areas.The dotted areas passed the significance test of 0.05 |
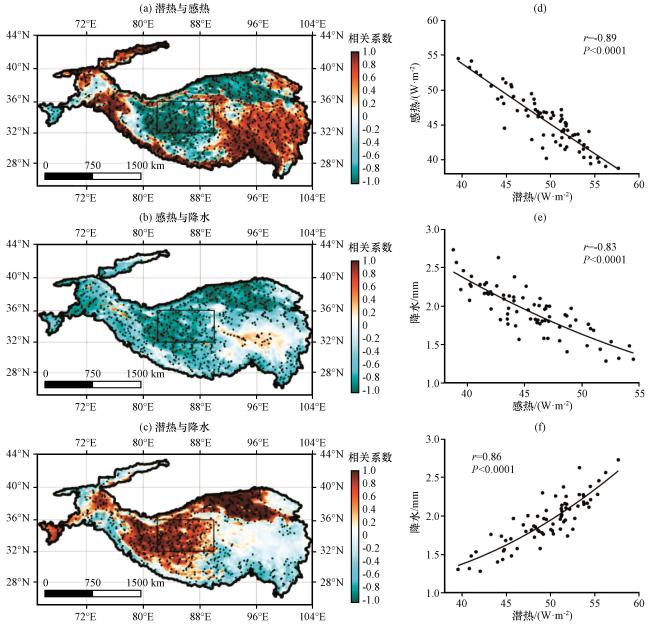
图10 1950 -2021年4 -9月地表潜热与感热通量(a)、 地表感热通量与降水(b)、 地表潜热通量与降水(c)的相关性(a~c)以及敏感区空间平均值相关性(d~f)黑色矩形区域为敏感区, 打点区域为通过了0.05显著性检验 Fig.10 Spatial correlations (a~c) between latent heat and sensible heat fluxes (a), sensible heat fluxes and precipitation (b), latent heat fluxes and precipitation (c), and spatially averaged correlations (d~f) for sensitive area, April-September 1950 -2021.The black rectangular areas are sensitive areas.The dotted areas passed the significance test of 0.05 |
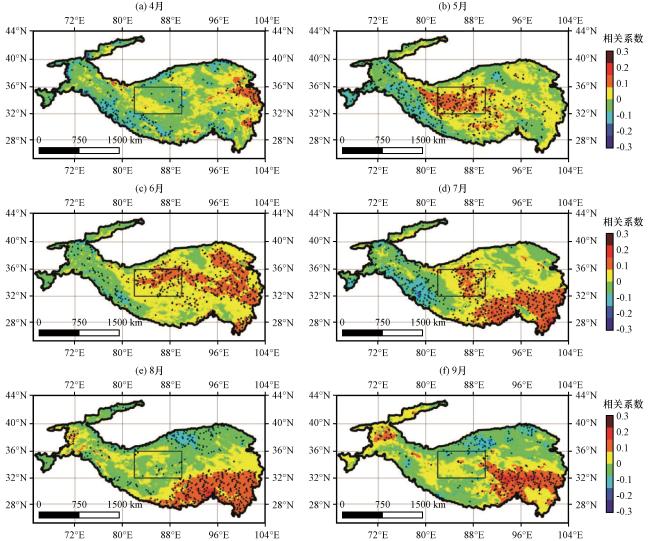
图11 1950 -2021年4 -9月高原低涡的日均个数与地表感热通量的相关系数黑色矩形区域为敏感区, 打点区域为通过了0.05显著性检验 Fig.11 Correlation coefficients between daily mean number of Plateau Vortex and sensible heat fluxes for April-September 1950 -2021.The black rectangular areas are sensitive areas.The dotted areas passed the significance test of 0.05 |
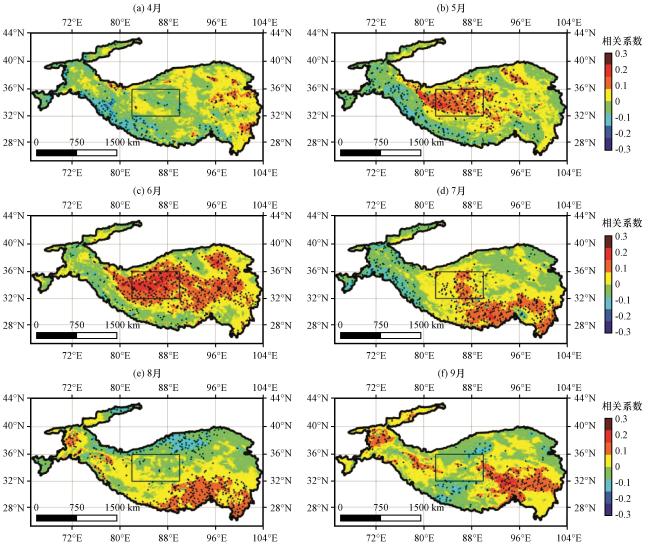
图12 1950 -2021年4 -9月高原低涡的日均持续时间与地表感热通量的相关系数黑色矩形区域为敏感区, 打点区域为通过了0.05显著性检验 Fig.12 Correlation coefficients between daily mean duration of Plateau Vortex and sensible heat fluxes for April-September 1950 -2021.The black rectangular areas are sensitive areas.The dotted areas passed the significance test of 0.05 |
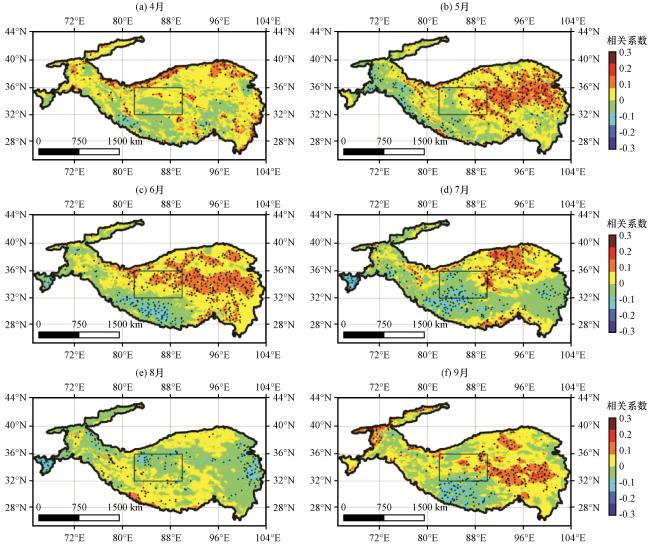


图13 1950 -2021年4 -9月高原低涡日均强度与地表感热通量的相关系数黑色矩形区域为敏感区, 打点区域为通过了0.05显著性检验 Fig.13 Correlation coefficients between daily mean intensity of Plateau Vortex and sensible heat fluxes for April-September 1950 -2021.The black rectangular areas are sensitive areas.The dotted areas passed the significance test of 0.05 |