

1 引 言
2 数据来源与方法介绍
2.1 资料来源
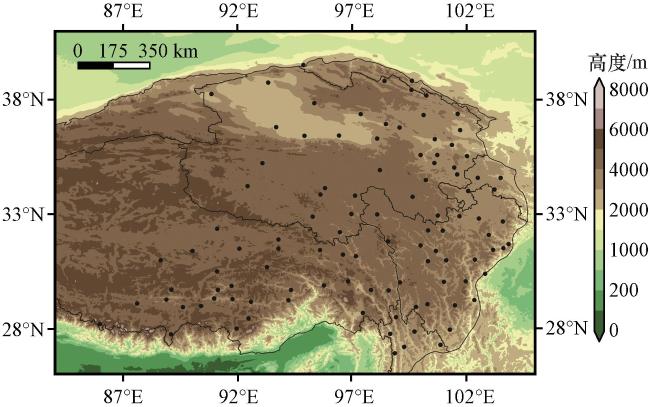
2.2 极端降水指标定义
表1 9个极端降水指标的定义Table 1 Definitions of nine extreme precipitation indicators |
| 代码 | 名称 | 定义 | 单位 |
|---|---|---|---|
| RX1day | 最大1 d降水量 | 最大1 d降水量 | mm |
| RX5day | 最大5 d降水量 | 5 d最大降水量 | mm |
| SDII | 降水强度 | 日降水量≥1.0 mm的总降水量与降水日数的比值 | mm·d-1 |
| R10mm | 中雨以上日数 | 日降水量≥10 mm的日数 | d |
| R20mm | 大雨以上日数 | 日降水量≥20 mm的日数 | d |
| R90 | R90极端降水量 | 日降水量大于基准期内第90%分位值的总降水量 | mm |
| R95 | R95极端降水量 | 日降水量大于基准期内第95%分位值的总降水量 | mm |
| R99 | R99极端降水量 | 日降水量大于基准期内第99%分位值的总降水量 | mm |
| PRCPTOT | 总降水量 | 全部雨(雪)日降水量之和 | mm |
2.3 不同等级范围极端降水判断方法
2.4 分析方法
3 高原极端降水时空异常特征
3.1 时间演变
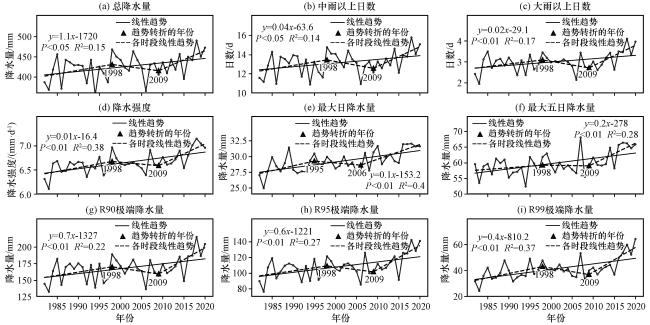
图2 1982 -2020年高原暖季9个极端降水指标时间演变Fig.2 Time series of nine warm season extreme precipitation indicators in the central and eastern Qinghai-Xizang Plateau during 1982 -2020 |
表2 不同时期青藏高原暖季9个极端降水指标的气候倾向率Table 2 Climate tendency rate of nine warm season extreme precipitation indicators of the central and eastern Qinghai-Xizang Plateau in different periods |
| 指标 | 单位 | 1982 -2020 | 1982 -1998 | 1998 -2009 | 2009 -2020 |
|---|---|---|---|---|---|
| PRCPTOT | mm·(10a)-1 | 10.7* | 9.9 | -42.3 | 51.0* |
| R10mm | d·(10a)-1 | 0.4* | 0.4 | -2.0* | 2.2* |
| R20mm | d·(10a)-1 | 0.2** | 0.2 | -0.5 | 1.1** |
| SDII | mm.d-1·(10a)-1 | 0.1** | 0.2 | -0.2 | 0.4** |
| RX5day | mm·(10a)-1 | 1.7** | 0.6 | -1.6 | 7.0** |
| R90 | mm·(10a)-1 | 7.5** | 6.8 | -20.9 | 39.9** |
| R95 | mm·(10a)-1 | 6.6** | 6.5 | -11.7 | 33.3** |
| R99 | mm·(10a)-1 | 4.3** | 6.8* | -4.2 | 20.7** |
| 1982 -2020 | 1982 -1995 | 1995 -2006 | 2006 -2020 | ||
| RX1day | mm·(10a)-1 | 0.9** | 1.6 | -1.5** | 2.2** |
*代表通过α=0.05显著性水平t检验, **代表通过α=0.01显著性水平t检验(* represents over 0.05 significance level of t test, ** represents over 0.01 significance level of t test) |
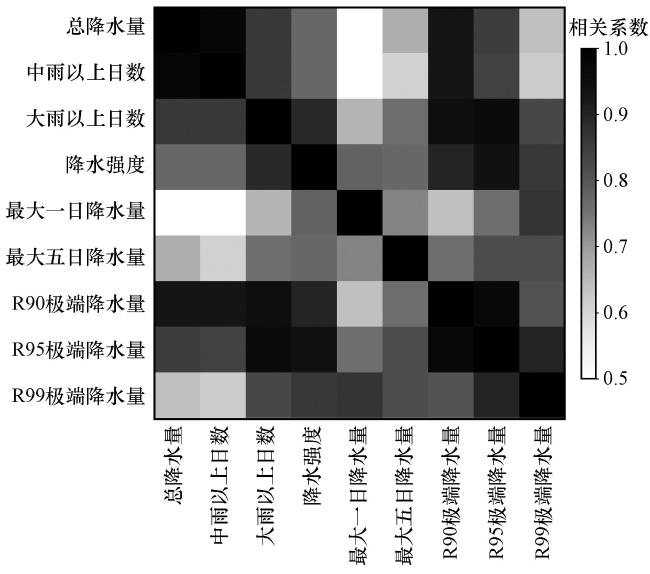
3.2 空间分布
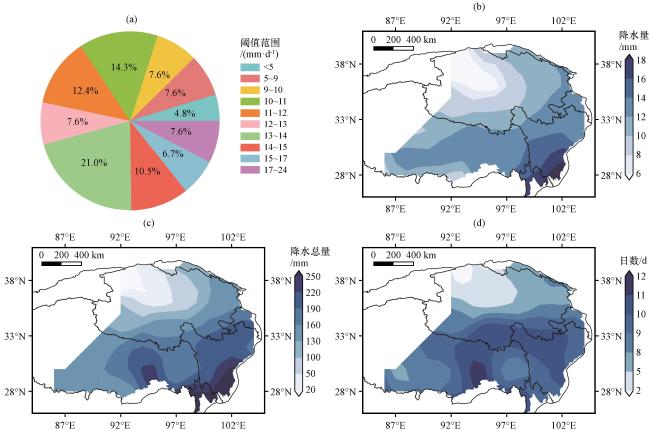
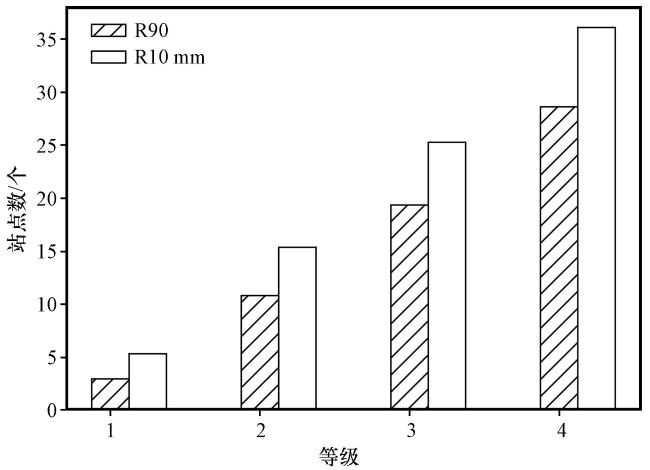
图4 1982 -2020年青藏高原暖季R90极端降水不同阈值范围比例(a)、 阈值分布(b)以及R90极端降水总量(c)和日数分布(d)Fig.4 Proportion of different threshold ranges of warm season R90 extreme precipitation (a), spatial distribution of threshold value (b), total extreme precipitation (c) and extreme precipitation days (d) of the central and eastern Tibetan Plateau during 1982 -2020 |
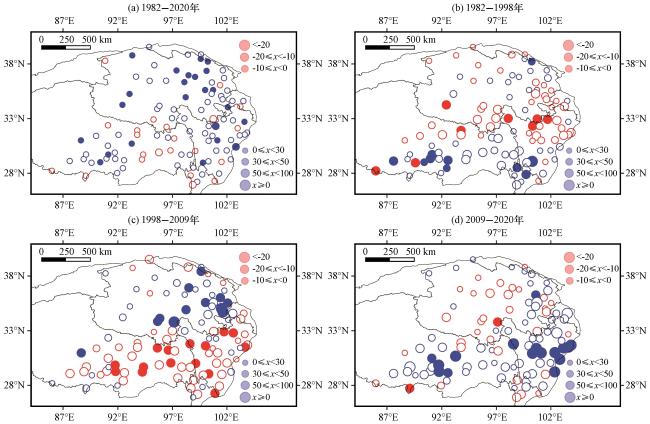
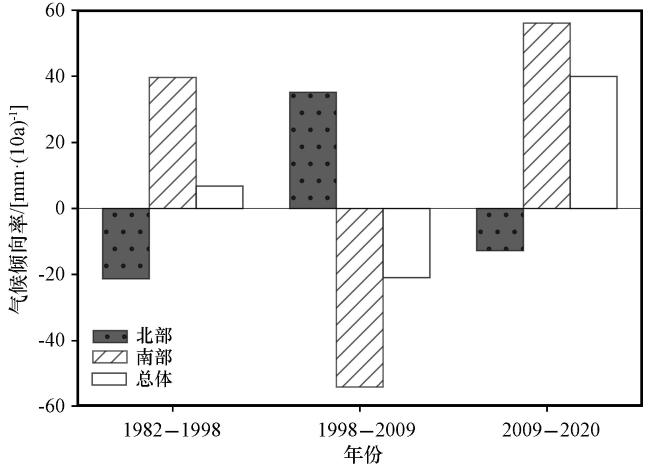
图5 不同时段青藏高原暖季R90极端降水气候倾向率[单位: mm·(10a)-1]分布(a)1982 -2020年, (b)1982 -1998年, (c)1998 -2009年, (d)2009 -2020年实心圆点为线性趋势通过了α=0.1的显著性水平t检验站点 Fig.5 Distributions of warm season R90 extreme precipitation climate tendency rate [unit: mm·(10a)-1] of the central and eastern Qinghai-Xizang Plateau in different periods.(a) 1982 -2020, (b) 1982 -1998, (c) 1998 -2009, (d) 2009 -2020 Solid dots indicate the linear trends are significant at the 90% confidence level of t test |
4 高原不同等级范围极端降水特征
4.1 时间演变
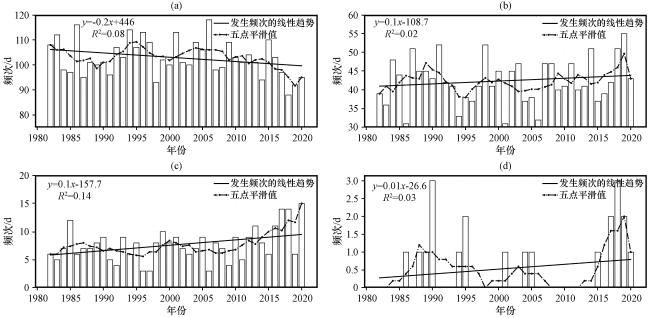
图7 1982 -2020年青藏高原中东部暖季不同等级范围极端降水频次的年际变化及趋势(a)1级, (b)2级, (c)3级, (d)4级.实线为发生频次的线性趋势, 虚线为五点平滑值 Fig.7 Variations and trends of warm season extreme precipitation frequencies of different levels in the central and eastern Qinghai-Xizang Plateau during 1982 -2020.(a) Level 1, (b) Level 2, (c) Level 3, (d) Level 4.The solid line represents the linear trend and the dashed line represents five-point smoothing values |
4.2 4 级范围极端降水的空间分型
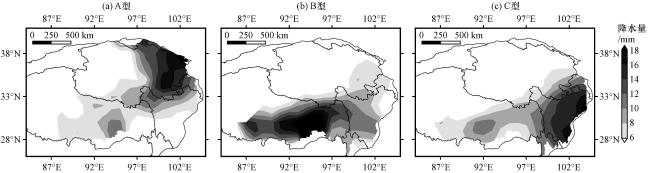
图9 青藏高原中东部4级范围极端降水落区分型Fig.9 The main falling areas of level 4 large-scale extreme precipitation in the central and eastern Qinghai-Xizang Plateau |
表3 青藏高原中东部暖季大范围极端降水的发生时间及其空间分型Table 3 Occurrence time and spatial classification of large-scale extreme precipitation in the central and eastern Qinghai-Xizang Plateau during the warm season |
| 类型 | 发生时间 | 数量/个 | 特征 |
|---|---|---|---|
| A型 | 1986-08-02; 1989-07-10; 1990-07-25; 1994-06-18; 1995-08-10; 2001-08-18; 2018-07-01 | 7 | 降水主要表现为东北-西南带状分布, 主降水区位于青海东部 |
| B型 | 1988-08-21; 1990-06-29; 1990-07-31; 2004-07-07; 2015-08-19; 2017-07-08; 2017-08-10; 2018-07-10; 2019-07-11 | 9 | 降水集中在青藏高原南部, 主降水区位于西藏东南部 |
| C型 | 1995-08-11; 2005-08-05; 2018-07-09; 2019-08-05; 2020-08-17 | 5 | 降水集中在青藏高原东南部和南部降水, 主降水区位于川西高原 |
5 青藏高原不同落区极端降水的典型环流特征
5.1 湿度和不稳定能量分析
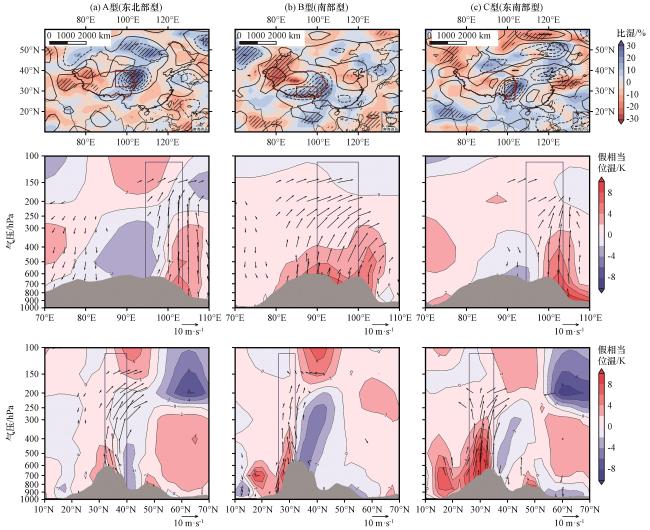
图10 青藏高原中东部暖季不同落区大范围极端降水500 hPa比湿(彩色区, 单位: %)和垂直风速ω(等值线, 单位: m·s-1)距平 (上)以及沿极端降水落区经度(中)和纬度(下)假相当位温 (彩色区, 单位: K)和风速(矢量, 单位: m·s-1)距平剖面打斜线区域和风矢量箭头均通过α=0.1的显著性水平t检验; 红色和蓝色框为降水落区, (a)A型(东北部型), (b)B型(南部型), (c)C型(东南部型) Fig.10 Anomaly of 500 hPa specific humidity (shaded areas, unit: %) and vertical wind velocity ω (the contour lines, unit: m·s-1) (up) of different falling areas of large-scale extreme precipitation in the central and eastern Qinghai-Xizang Plateau during the warm season, and the profile of pseudo-equivalent potential temperature (the shaded areas, unit: K) and wind speed (the arrows, unit: m·s-1) along the longitude (middle) and latitude (down) of large-scale extreme precipitation regions.The areas marked with diagonals and wind vector arrows indicate the anomalies are significant at the 90% confidence level; the red and blue boxes indicate the precipitation falling areas of large-scale extreme precipitation, (a) type A (Northeast type), (b) type B (Southern type), (c) type C (Southeast type) |
5.2 大气环流典型特征
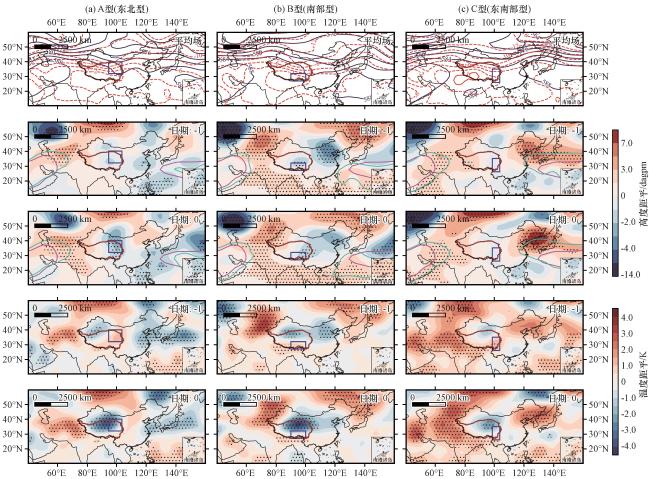
图11 青藏高原中东部暖季不同落区大范围极端降水当日(第1, 3, 5行)及前1日(第2, 4行) 500 hPa温压场环流形势 (第1行)、 高度场距平(第2, 3行)以及温度场距平(第4, 5行)(a)A型(东北部型), (b)B型(南部型), (c)C型(东南部型), 第1行中588 dagpm等值线表征西太副高的位置; 第2, 3行中绿色等值线为不同类型大范围极端降水发生时西太副高的位置, 红色等值线为气候态西太副高的位置; 打点区域通过了α=0.1显著性水平检验 Fig.11 Composite distributions of 500 hPa temperature and pressure fields (row 1), and anomaly of height field (rows 2, 3) and temperature fields (rows 4, 5) on the day (rows 1, 3, 5) and the previous day (rows 2, 4) when the different falling areas of large-scale extreme precipitation in the central and eastern Qinghai-Xizang Plateau during the warm season occur.(a) Type A (Northeast type), (b) Type B (South type), (c) Type C (Southeast type), the 588 dagpm contour line in the row 1 represents the location of the West Pacific subtropical high; In rows 2 and 3, the green contour line is the location of the West Pacific subtropical high when different types of large-scale extreme precipitation occur, and the red contour line is the location of the climate state West Pacific subtropical high.The dotted areas indicate the anomalies are significant at the 90% confidence level of t test |
5.3 整层水汽输送典型特征
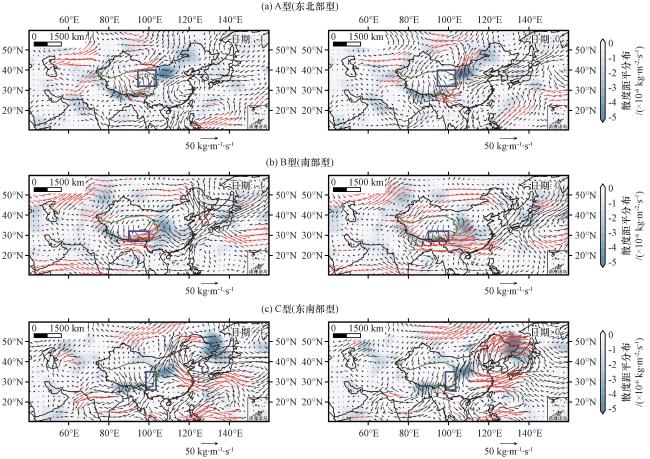


图12 青藏高原中东部暖季不同落区大范围极端降水发生前1日(左)和当日(右)整层水汽通量(矢量, 单位: kg·m-1·s-1) 及其散度距平分布(阴影, 单位: ×10-6 kg·m-2·s-1)(a)A型(东北部型), (b)B型(南部型), (c)C型(东南部型), 红色的风矢量箭头代表异常通过了α=0.1显著性水平t检验 Fig.12 Anomaly distributions of the whole layer water vapor fluxes (vector, unit: kg·m-1·s-1) and their divergences (the shaded areas, unit: 10-6 kg·m-2·s-1) on the previous day (left) and the day (right) when the different falling areas of large-scale extreme precipitation in the central and eastern Qinghai-Xizang Plateau during the warm season occur.(a) Type A (Northeast type), (b) Type B (South type), (c) Type C (Southeast type), the red vector arrows indicate the anomalies are significant at the 90% confidence level of t test |