

1 引言
2 数据来源与方法介绍
2.1 臭氧探空数据
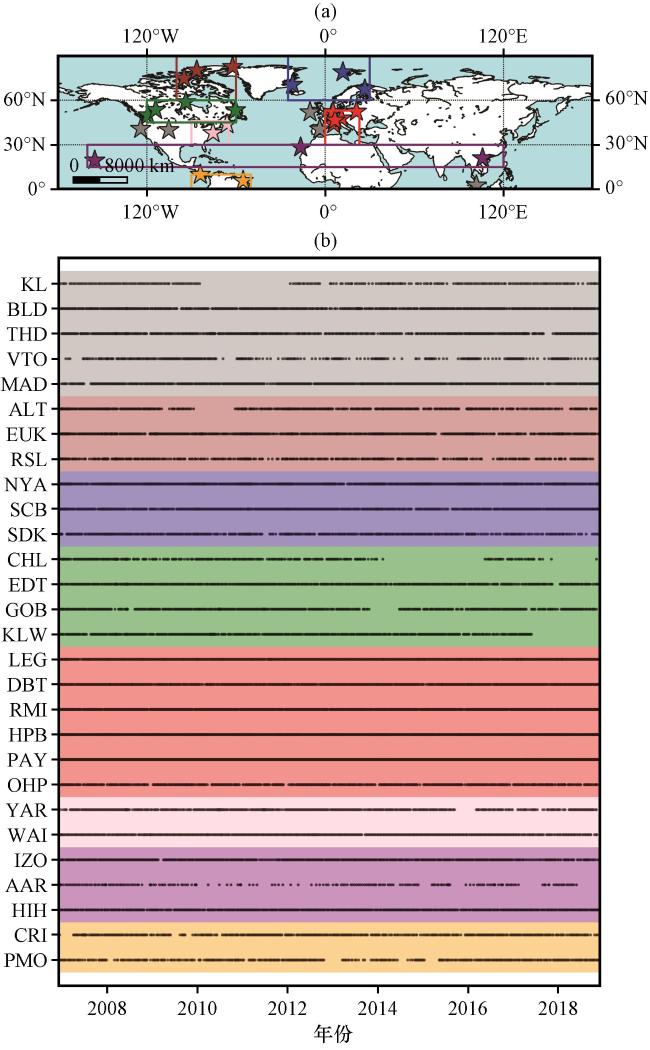
图1 臭氧探空观测站点的位置(a)和各站点的臭氧探空观测记录时间范围的散点分布(b)不同颜色的方框内的站点属于同一划分区域: 北极东部地区: 蓝色; 北极西部地区: 棕色; 欧洲西部地区: 红色; 美国东部地区: 粉色; 加拿大地区: 绿色; 北半球亚热带地区: 紫色; 赤道美洲地区: 橘色; 未列入选定区域的站点以灰色显示 Fig.1 Geographic distribution of ozonesondes observation(a) and a scatter plot of the time range recorded by the ozonesondes observations at each station(b).Boxes of different colors represent distinct regions: eastern Arctic in blue; western Arctic in brown; western Europe in red; eastern United States in pink; Canada in green; subtropics in purple; equatorial Americas in orange; unspecified regions are displayed in gray |
表1 选取的臭氧探空观测站点的缩写名称、 完整名称、 经度、 纬度Table 1 Abbreviations, full names, longitude and latitudeof the ozonesondes stations selected in this study |
| 站点简称 | 站点全称 | 纬度/(°N) | 经度 | 样本数/个 |
|---|---|---|---|---|
| KL | Kuala Lumpur | 2.73 | 101.70°E | 220 |
| PMO | Paramaribo | 5.81 | 55.21°W | 427 |
| CRI | Costa Rica | 9.94 | 84.04°W | 485 |
| HIH | Hilo | 19.43 | 155.04°W | 591 |
| AAR | Ha noi | 21.02 | 105.87°E | 208 |
| IZO | Izaña | 28.31 | 16.50°W | 549 |
| WAI | Wallops Island | 37.94 | 75.46°W | 621 |
| BLD | Boulder | 40.00 | 105.25°W | 608 |
| MAD | Madrid | 40.45 | 3.72°W | 578 |
| THD | Trinidad Head | 40.80 | 124.16°W | 606 |
| YAR | Yarmouth | 43.87 | 66.10°W | 572 |
| OHP | Haute Provence | 43.94 | 5.71°E | 572 |
| PAY | Payerne | 46.49 | 6.57°E | 1872 |
| HPB | Hohenpeissenberg | 47.80 | 11.01°E | 1534 |
| KLW | Kelowna | 49.97 | 119.38°W | 537 |
| RMI | Uccle | 50.80 | 4.36°E | 1700 |
| VTO | Valentia | 51.94 | 10.25°W | 382 |
| DBT | De Bilt | 52.10 | 5.18°E | 628 |
| LEG | Legionowo | 52.40 | 20.97°E | 657 |
| GOB | Goose Bay | 53.31 | 60.36°W | 565 |
| EDT | Edmonton | 53.54 | 114.10°W | 570 |
| CHL | Churchill | 58.74 | 93.82°W | 339 |
| SDK | Sodankylä | 67.37 | 26.65°E | 543 |
| SCB | Scoresby Sund | 70.48 | 21.97°W | 622 |
| RSL | Resolute | 74.70 | 94.96°W | 470 |
| NYA | Ny-Ålesund | 78.92 | 11.92°E | 935 |
| EUK | Eureka | 79.98 | 85.94°W | 788 |
| ALT | Alert | 82.50 | 62.34°W | 490 |
2.2 GOME-2A
2.3 OMI
2.4 TCR-2再分析
2.5 对流层臭氧柱含量的计算
3 结果分析
3.1 对流层臭氧柱含量整体评估
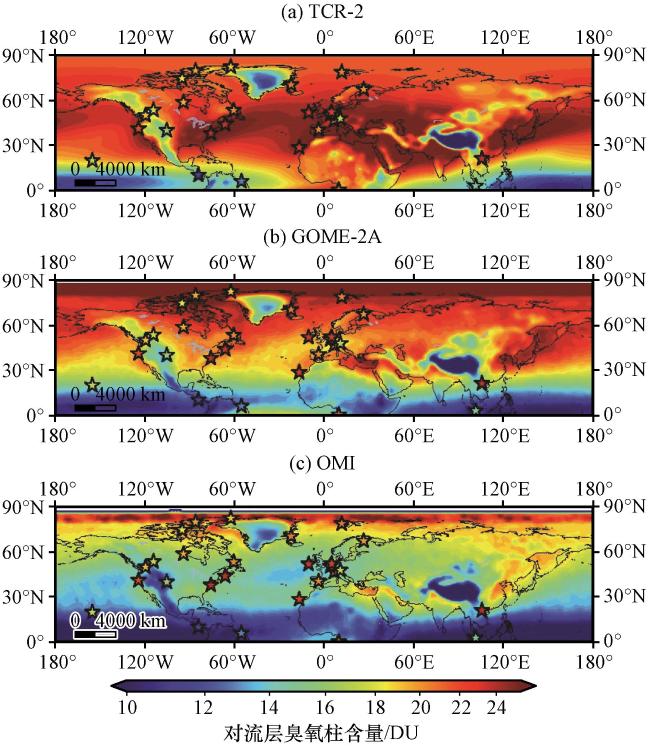
图2 2007 -2018年期间TCR-2(a)、 GOME-2A(b)、 OMI(c)对流层臭氧柱含量的多年平均空间分布五角星号“☆”表示来自探空数据的2007 -2018年平均的对流层臭氧柱含量(单位: DU) Fig.2 Spatial distribution of TCR-2(a), GOME-2A(b) and OMI(c) tropospheric ozone column during 2007 -2018.The pentagram represents the tropospheric ozone column from ozonesondes observations (unit: DU) |
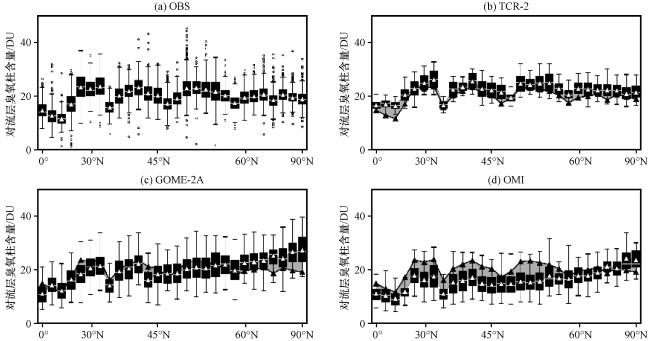
图3 对流层臭氧柱含量箱线图箱体表示不同数据集中对流层臭氧柱含量50%的范围, 箱体下边缘表示第一四分位数, 箱体上边缘表示第三四分位数, 箱体中间的线条表示数据的中位数, 箱体中间的散点表示数据的平均值。(a)表示探空观测数据, 其中箱体外部的圆点表示异常值; (b)、 (c)、 (d)分别表示TCR-2、 GOME-2A、 OMI数据, 箱体表示对流层臭氧柱含量, 黑色三角表示对应站点位置处的探空观测结果, 阴影区域表示TCR-2、 GOME-2A、 OMI与探空观测的对流层臭氧柱含量平均值之间的数值差异 Fig.3 Boxplots of tropospheric ozone column.The box represents the range of 50% of the tropospheric ozone column in different datasets.The lower edge of the box represents the first quartile and the upper edge of the box represents the third quartile.The lines in the box represent the median and the scatter points represent the mean value.(a) represents ozonesondes observation, in which the dots outside the box represent abnormal values; (b)~(d) represent TCR-2, GOME-2A and OMI respectively, and the box represents the tropospheric ozone column.The black triangle represents tropospheric ozone column of ozonesondes observation at the corresponding station location, and the shaded area represents the difference between the average of TCR-2, GOME-2A, OMI and ozonesondes observations |
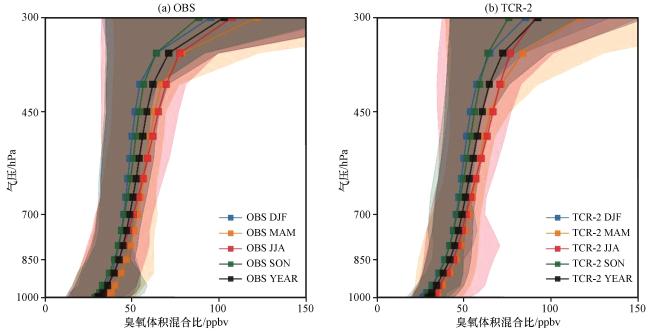
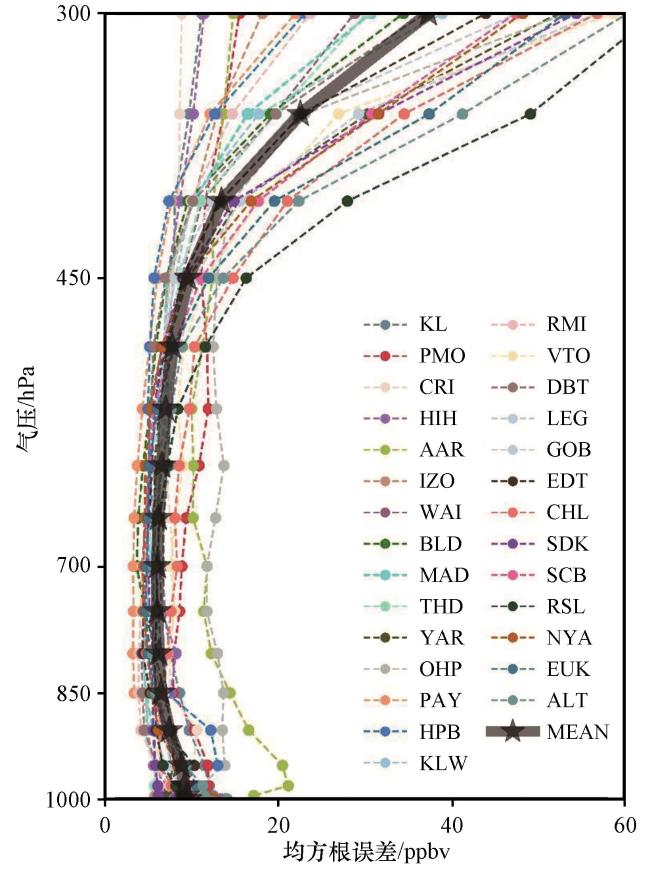
图5 2007 -2018年期间1000~300 hPa垂直范围内TCR-2与探空观测之间臭氧均方根误差的垂直分布不同颜色表示不同站点处TCR-2与探空观测之间的均方根误差, 灰色粗实线表示所有站点的平均结果 Fig.5 Vertical distribution of ozone root mean square error between TCR-2 and ozonesondes observations in the vertical range of 1000 hPa to 300 hPa for the period 2007 -2018.Different colors indicate the root mean square errors between TCR-2 and ozonesondes observations at different stations |
3.2 不同区域对流层臭氧柱含量评估
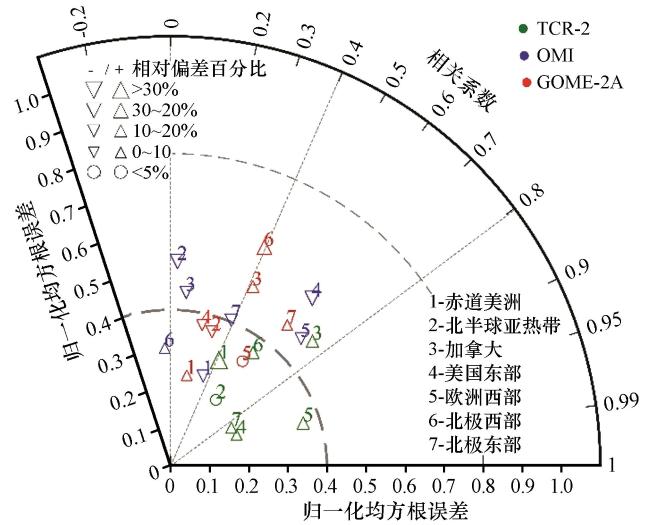
图7 2007 -2018年期间TCR-2、 OMI、 GOME-2A对流层臭氧柱含量与探空观测之间的对比结果三角形的大小方向表示相对偏差百分比 Fig.7 Comparison results of TCR-2, OMI, GOME-2A tropospheric ozone column and ozonesondes observations from 2007 to 2018.The size and the direction of the triangle represent the relative deviation percentage |
表2 北半球不同区域TCR-2对流层臭氧偏差以及GOME-2A和OMI标准化误差的区域平均值Table 2 Regional mean of TCR-2 tropospheric ozone spread and GOME-2A and OMI standardized errors for different regions of the northern hemisphere |
| 赤道美洲 | 亚热带 | 加拿大 | 美国东部 | 欧洲西部 | 北极西部 | 北极东部 | |
|---|---|---|---|---|---|---|---|
| TCR-2(偏差/DU) | 0.39 | 0.50 | 1.15 | 0.93 | 0.81 | 1.16 | 1.12 |
| GOME-2A(标准化误差/DU) | 0.80 | 1.17 | 1.71 | 1.43 | 1.56 | 2.52 | 2.64 |
| OMI(标准化误差/DU) | 0.62 | 0.70 | 1.15 | 0.90 | 0.92 | 2.1 | 1.8 |
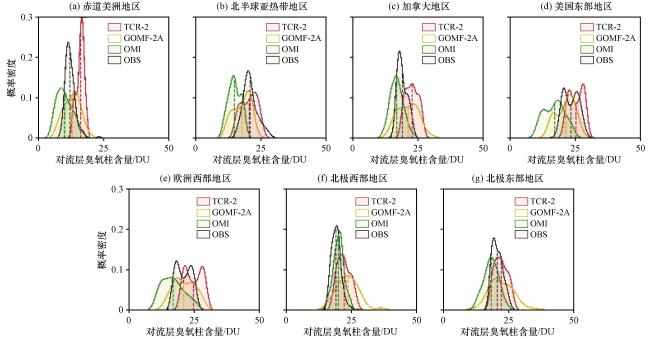
图8 2007 -2018年期间TCR-2、 GOME-2A、 OMI以及探空观测数据对流层臭氧柱含量的概率密度分布虚线表示不同数据集对流层臭氧柱含量的区域平均值。(a)赤道美洲地区, (b)北半球亚热带地区, (c)加拿大地区, (d)美国东部地区, (e)欧洲西部地区, (f)北极西部地区, (g)北极东部地区 Fig.8 Probability density distribution of tropospheric ozone column in TCR-2, GOME-2A, OMI and ozonesondes observation from 2007 to 2018.The dotted line represents the regional average of tropospheric ozone column in different data sets.(a) the equatorial America, (b) the subtropical, (c) the Canada, (d) the eastern United States, (e) the western European, (f) the western Arctic and (g) the eastern Arctic |
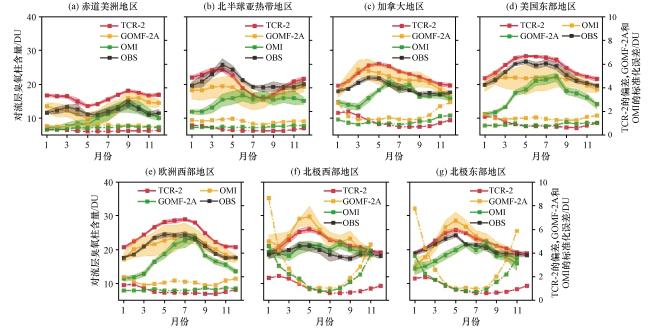
图9 2007 -2018年期间TCR-2、 GOME-2A、 OMI以及探空观测数据对流层臭氧柱含量及误差的季节变化和TCR-2偏差的季节变化以及GOME-2A和OMI标准化误差的季节变化实线表示对流层臭氧柱含量, 虚线表示TCR-2的偏差以及GOME-2A和OMI的标准化误差。阴影区域表明变化范围(单位: DU)。(a)赤道美洲地区, (b)北半球亚热带地区, (c)加拿大地区, (d)美国东部地区, (e)欧洲西部地区, (f)北极西部地区, (g)北极东部地区 Fig.9 Seasonal changes of tropospheric ozone column and bias from TCR-2, GOME-2A, OMI and ozonesondes observations and the seasonal variation of TCR-2 spread and the seasonal variation of GOME-2A and OMI standard error are given from 2007 to 2018.The solid line shows the tropospheric ozone column, the dotted line shows the spread of TCR-2 and the standard error of GOME-2A and OMI.The shaded area indicates the variation range(unit: DU).(a) the equatorial America, (b) the subtropical, (c) the Canada, (d) the eastern United States, (e) the western Europe, (f) the western Arctic and (g) the eastern Arctic |
3.3 对流层臭氧柱含量年趋势
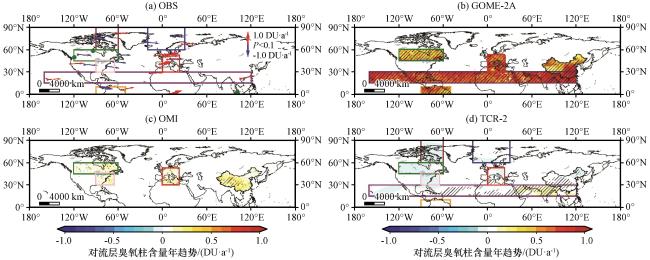
图10 2007 -2018年期间不同数据集1000~450 hPa垂直范围内对流层臭氧柱含量的年趋势(a)、 (b)、 (c)、 (d)分别表示探空观测结果、 GOME-2A、 OMI、 TCR-2的对流层臭氧柱含量趋势。图(a)箭头与x方向之间的角度表示趋势的大小, 箭头旋转角度越大表示趋势数值越大, 蓝色表示负趋势, 红色表示正趋势, 绿色表示该站点趋势为缺测值, 箭头加粗表示通过90%的显著性检验。图(b)、 (c)、 (d)中黑色斜线部分表示通过90%显著性检验的区域, 颜色条表示图(b)、 (c)、 (d)中对流层臭氧柱含量的趋势大小 Fig.10 Trends of tropospheric ozone column between 1000 hPa and 450 hPa in different data sets from 2007 to 2018.(a), (b), (c) and (d) show the trends of ozonesondes observation, GOME-2A, OMI and TCR-2 respectively.The angle between the arrow and the x direction in (a) indicates the trend.The larger the arrow rotation angle, the larger the trend value.Blue indicates negative trend, red indicates positive trend, and green indicates that the trend of this station is missing.Bold arrows indicate passing the 90% significance test.In Figures (b), (c), and (d), the areas marked with black hatched lines indicate regions that have passed the 90% significance test, the color bar indicates the magnitude of the tropospheric ozone column trends in Fig.(b), (c), and (d) |
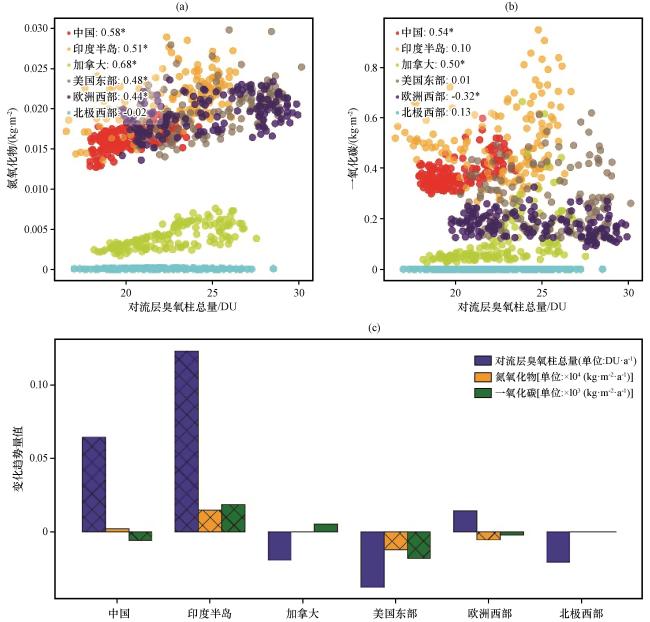


图11 对流层臭氧柱含量与地面NOX排放量(a)和地面CO排放量(b)间的散点分布(“*”表示通过90%的显著性检验), 北半球不同区域对流层臭氧柱含量、 地面NOX排放量和地面CO排放量变化趋势的柱状图(c)蓝色表示对流层臭氧柱含量臭氧趋势, 橙色表示地面NOX排放量趋势, 绿色表示地面CO排放量趋势。柱状图中的黑色斜线填充表示趋势通过90%的显著性检验, 无黑色斜线填充表示趋势没有通过90%的显著性检验 Fig.11 Scatter plot between tropospheric ozone column content and ground-level NOX emissions (a), and ground-level CO emissions(b), ("*" indicates passing the 90% significance test), (c) Histograms of trends in tropospheric column ozone content, ground-level NOX emissions and ground-level CO emissions in different regions of the Northern Hemisphere, with blue indicating the trend in tropospheric column ozone content ozone, orange indicating the trend in ground-level NOX emissions and green indicating the trend in ground-level CO emissions.The black slash fill in the bar chart indicates that the trend passes the 90% significance test, and no black slash fill indicates that the trend does not pass the 90% significance test |