
1 引言
2 资料来源与方法介绍
2.1 模式数据
表1 CMIP6中8个模式的基本信息Table 1 Basic information of the 8 models in the CMIP6 |
| 序号 | 模式名称 | 国家和机构 | 水平分辨率 |
|---|---|---|---|
| 1 | ACCESS-CM2 | 澳大利亚, CSIRO-ACCESS | 1.25°×1.75° |
| 2 | CESM2-WACCM | 美国, NCAR | 0.9°×1.25° |
| 3 | EC-Earth3-Veg | 欧洲, EC-Earth-Cons | 0.7°×0.7° |
| 4 | GFDL-ESM4 | 美国, GFDL | 1°×1.25° |
| 5 | MPI-ESM1-2-LR | 德国, MPI-M | 1.865°×1.875° |
| 6 | MRI-ESM2-0 | 日本, MRI | 1.12°×1.12° |
| 7 | NorESM2-LM | 挪威, NCC | 1.9°×2.5° |
| 8 | NorESM2-MM | 挪威, NCC | 0.9°×1.25° |
2.2 验证数据
2.3 偏差校正方法
2.4 极端高温、 低温事件
表2 极端高温、 低温事件的定义Table 2 Definition of extreme high and low temperature events |
| 事件名称 | 定义 |
|---|---|
| 极端高温 事件 | 日最高气温连续3天及其以上大于基准期第90个百分位 |
| 极端低温 事件 | 日最低气温连续3天及其以上小于基准期第10个百分位 |
3 CMIP6多模式在青藏高原的适用性评估
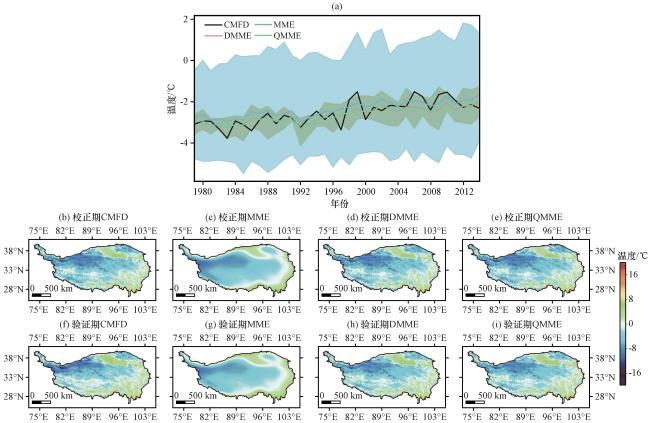
图1 校正期和验证期CMIP6在青藏高原偏差校正前后的平均气温的年际变化(a)以及空间分布(b~i)(a)年际变化, (b)校正期CMFD, (c)校正期MME, (d)校正期DMME, (e)校正期QMME, (f)验证期CMFD, (g)验证期MME, (h)验证期DMME, (i)验证期QMME。对应颜色的阴影表示多模式年平均气温的最大值和最小值 Fig.1 Annual variations (a) and the spatial distribution (b~i) of the average air temperature from original and corrected CMIP6 models during calibration period and validation period on the Qinghai-Xizang Plateau.(a) Annual variations, (b) CMFD during calibration period, (c) MME during calibration period, (d) DMME during calibration period, (e) QMME during calibration period, (f) CMFD during validation period, (g) MME during validation period, (h) DMME during validation period, (i) QMME during validation period.The shadows in each corresponding color represent the maximum and minimum of the annual mean temperature |

图2 校正期和验证期CMIP6在青藏高原偏差校正前后的平均降水的年际变化(a)以及空间分布(b~i)(a)年际变化, (b)校正期CMFD, (c)校正期MME, (d)校正期DMME, (e)校正期QMME, (f)验证期CMFD, (g)验证期MME, (h)验证期DMME, (i)验证期QMME。对应颜色的阴影表示多模式年平均降水的最大值和最小值 Fig.2 Annual variations (a) and the spatial distribution (b~i) of the average precipitation from original and corrected CMIP6 models during calibration period and validation period on the Qinghai-Xizang Plateau.(a) Annual variations, (b) CMFD during calibration period, (c) MME during calibration period, (d) DMME during calibration period, (e) QMME during calibration period, (f) CMFD during validation period, (g) MME during validation period, (h) DMME during validation period, (i) QMME during validation period.The shadows in each corresponding color represent the maximum and minimum of the annual mean precipitation |
4 青藏高原的极端气候事件未来预估
4.1 青藏高原的极端高温和极端低温事件预估
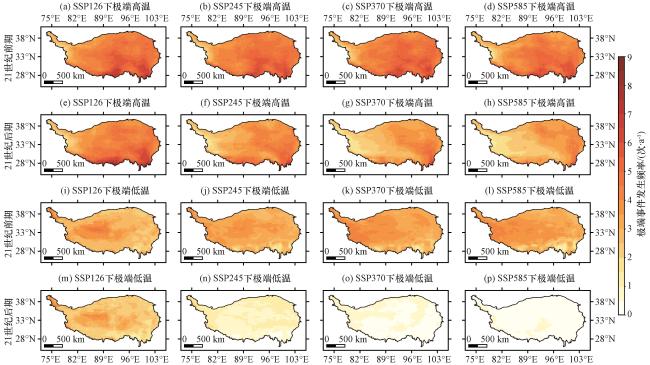
图4 青藏高原2015 -2057年、 2058 -2100年极端高温和极端低温事件的平均发生频率的空间分布(单位: 次·a-1)(a)~(d) 分别为SP126、 SSP245、 SSP370和SSP585情景下2015 -2057年的极端高温事件; (e)~(h)分别为SP126、 SSP245、 SSP370和SSP585情景下2058 -2100年的极端高温事件; (i)~(l)分别为SP126、 SSP245、 SSP370和SSP585情景下2015 -2057年的极端低温事件; (m)~(p)分别为SP126、 SSP245、 SSP370和SSP585情景下2058-2100年的极端低温事件 Fig.4 Spatial distribution of the average frequency of extreme high and extreme low temperature events over the Qinghai-Xizang Plateau during 2015 -2057 and 2058 -2100.Unit: times·a-1.In Fig.4, (a)~(d) represents extreme high temperature events during 2015 -2057 under the SP126, SSP245, SSP370 and SSP585 scenario, respectively; (e)~(h) represents extreme high temperature events during 2058 - 2100 under the SP126, SSP245, SSP370 and SSP585 scenario, respectively; (i)~(l) represents extreme low temperature events during 2015 -2057 under the SP126, SSP245, SSP370 and SSP585 scenario, respectively; (m)~(p) represents extreme low temperature events during 2058 -2100 under the SP126, SSP245, SSP370 and SSP585 scenario, respectively |
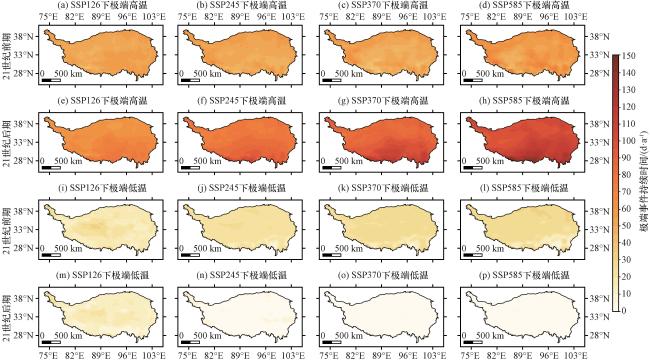
图5 青藏高原2015 -2057年、 2058 -2100年极端高温和极端低温事件的平均持续天数的空间分布(单位: d·a-1)(a)~(d) 分别为SP126、 SSP245、 SSP370和SSP585情景下2015 -2057年的极端高温事件; (e)~(h)分别为SP126、 SSP245、 SSP370和SSP585情景下2058 -2100年的极端高温事件; (i)~(l)分别为SP126、 SSP245、 SSP370和SSP585情景下2015 -2057年的极端低温事件; (m)~(p)分别为SP126、 SSP245、 SSP370和SSP585情景下2058 -2100年的极端低温事件 Fig.5 Spatial distribution of the average duration days of extreme high and extreme low temperature events over the Qinghai-Xizang Plateau during 2015 -2057 and 2058 -2100.Unit: d·a-1.In Fig.5, (a)~(d) represents extreme high temperature events during 2015 -2057 under the SP126, SSP245, SSP370 and SSP585 scenario, respectively; (e)~(h) represents extreme high temperature events during 2058 -2100 under the SP126, SSP245, SSP370 and SSP585 scenario, respectively; (i)~(l) represents extreme low temperature events during 2015 -2057 under the SP126, SSP245, SSP370 and SSP585 scenario, respectively; (m)~(p) represents extreme low temperature events during 2058 -2100 under the SP126, SSP245, SSP370 and SSP585 scenario, respectively |
4.2 青藏高原大气干燥度的未来预估
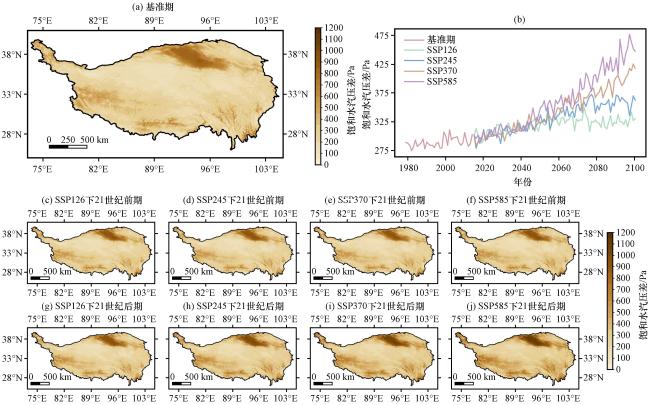
图6 青藏高原年平均饱和水汽压差(VPD)在1979 -2014年(a)、 2015 -2057年(c~f)和2058 -2100年(g~j)的空间分布及其年际变化(b)(单位: Pa)(a)1979 -2014年, (b)年际变化, (c)SSP126情景下2015 -2057年, (d)SSP245情景下2015 -2057年, (e)SSP370情景下2015 -2057年, (f)SSP585情景下2015 -2057年, (g)SSP126情景下2058 -2100年, (h)SSP245情景下2058 -2100年, (i)SSP370情景下2058 -2100年, (j) SSP585情景下2058 -2100年 Fig.6 Spatial distribution and annual variations of the annual average vapor pressure deficit over the Qinghai-Xizang Plateau during 1979 -2014, 2015-2057 and 2058 -2100.Unit: Pa.(a) 1979 -2014, (b) Annual variations, (c) 2015 -2057 under the SSP126 scenario, (d) 2015 -2057 under the SSP245 scenario, (e) 2015 -2057 under the SSP370 scenario, (f) 2015 -2057 under the SSP585 scenario, (g) 2058 -2100 under the SSP126 scenario, (h) 2058 -2100 under the SSP245 scenario, (i) 2058 -2100 under the SSP370 scenario, (j) 2058 -2100 under the SSP585 scenario |
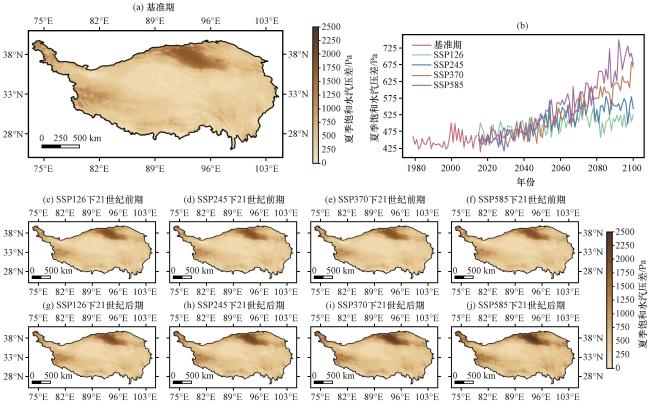
图7 青藏高原夏季平均饱和水汽压差(VPD)在1979 -2014年(a)、 2015 -2057年(c~f)和2058 -2100年(g~j)的空间分布及其年际变化(b)(单位: Pa)(a)1979 -2014年, (b)年际变化, (c)SSP126情景下2015 -2057年, (d)SSP245情景下2015 -2057年, (e)SSP370情景下2015 -2057年, (f)SSP585情景下2015 -2057年, (g)SSP126情景下2058 -2100年, (h)SSP245情景下2058 -2100年, (i)SSP370情景下2058 -2100年, (j) SSP585情景下2058-2100年 Fig.7 Spatial distribution and annual variations of the summer average vapor pressure deficit over the Qinghai-Xizang Plateau during 1979 -2014, 2015-2057 and 2058-2100.Unit: Pa.(a) 1979-2014, (b) Annual variations, (c) 2015 -2057 under the SSP126 scenario, (d)2015 -2057 under the SSP245 scenario, (e) 2015 -2057 under the SSP370 scenario, (f) 2015 -2057 under the SSP585 scenario, (g) 2058 -2100 under the SSP126 scenario, (h) 2058 -2100 under the SSP245 scenario, (i) 2058 -2100 under the SSP370 scenario, (j) 2058 -2100 under the SSP585 scenario |
4.3 青藏高原未来降水预估
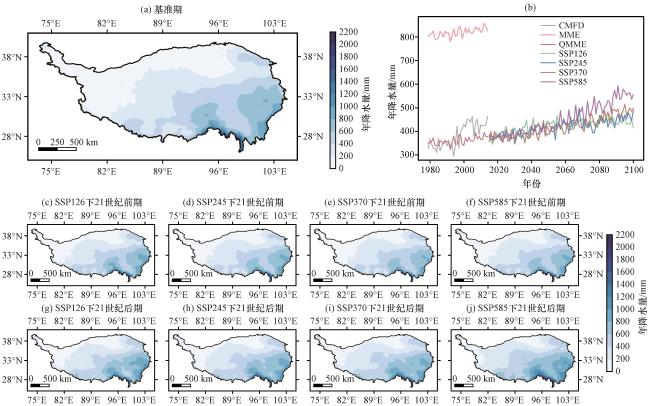
图8 青藏高原年降水量在1979 -2014年(a)、 2015 -2057年(c~f)和2058 -2100年(g~j)的空间分布及其年际变化(b)(单位: mm)(a)1979 -2014年, (b)年际变化, (c)SSP126情景下2015 -2057年, (d)SSP245情景下2015 -2057年, (e)SSP370情景下2015 -2057年, (f)SSP585情景下2015 -2057年, (g)SSP126情景下2058 -2100年, (h)SSP245情景下2058 -2100年, (i)SSP370情景下2058 -2100年, (j) SSP585情景下2058 -2100年 Fig.8 Spatial distribution and annual variations of the average precipitation over the Qinghai-Xizang Plateau during 1979 -2014, 2015 -2057 and 2058 -2100.Unit: mm.(a)1979 -2014, (b)Annual variations, (c)2015 -2057 under the SSP126 scenario, (d)2015 -2057 under the SSP245 scenario, (e)2015 -2057 under the SSP370 scenario, (f)2015 -2057 under the SSP585 scenario, (g)2058 -2100 under the SSP126 scenario, (h)2058 -2100 under the SSP245 scenario, (i)2058 -2100 under the SSP370 scenario, (j)2058 -2100 under the SSP585 scenario |