

1 引言
2 模式及数据介绍
2.1 观测站点数据
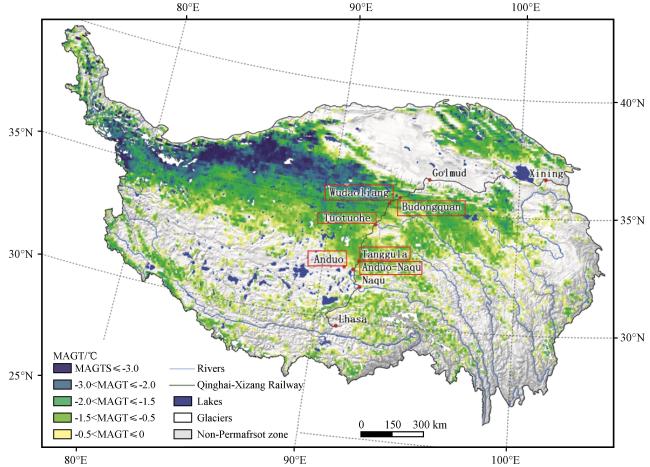
图1 基于年平均地温(MAGT)的青藏高原多年冻土空间分布及数据站点分布(引自Ni et al, 2021)红色框为本研究所选取的站点, 即可可西里不冻泉/NewD66、 唐古拉/D105、 安多/Amdo、 五道梁、 沱沱河、 曲玛莱 Fig.1 Spatial distribution and data site distribution of permafrost on the Tibetan Plateau based on Annual Mean Ground Temperature (MAGT) (cited from Ni et al, 2021).The red boxes are the sites selected for this study, including Xili Unfrozen Spring /NewD66, Tanggula /D105, Amdo /Amdo, Wudao Liang, Tuotuo River, and Qumalai |
2.2 ERA5驱动数据
2.3 Mann-Kendall法
2.4 WRF模式及Nudging方法介绍
2.5 青藏高原冻土数据
3 结果分析
3.1 站点数据分析
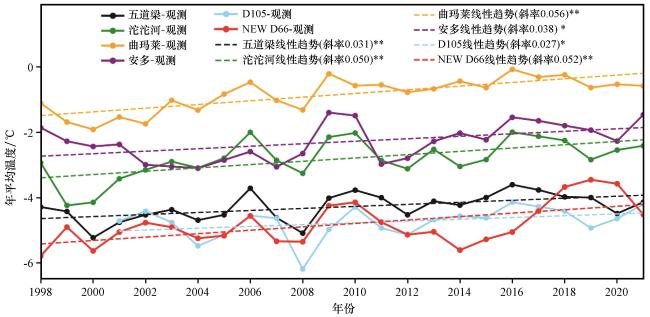
图2 铁路沿线五道梁、 沱沱河、 曲玛莱、 唐古拉D105、 安多-那曲野外台站和新D66的1998 -2021年年平均地表气温变化*代表趋势通过95%显著性检验, **代表通过99%显著性检验 Fig.2 Annual mean surface air temperature changes from 1998 to 2021 at Wudaoliang, Tuotuo River, Qumalai, Tanggula D105, Amdo Nagqu Field Station and New D66 along the railway line.* represents the trend passing the 95% significance test and ** represents the 99% significance test |
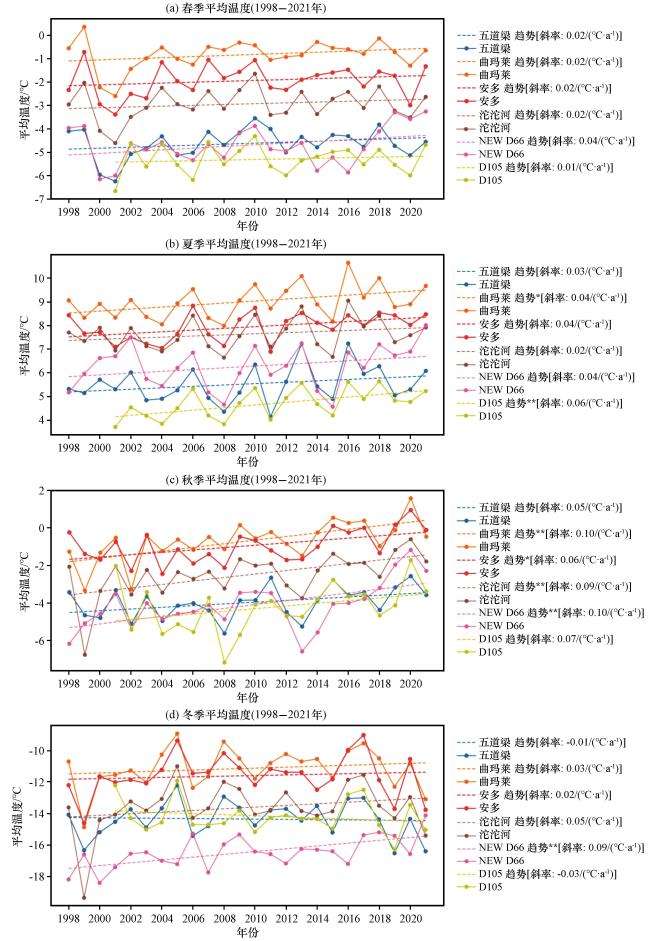
图3 铁路沿线五道梁、 沱沱河、 曲玛莱、 唐古拉D105、 安多-那曲野外台站和新D66的1998 -2021年季平均地表气温变化*代表趋势通过95%显著性检验, **代表通过99%显著性检验 Fig.3 Seasonal mean surface air temperature changes from 1998 to 2021 at Wudaoliang, Tuotuo River, Qumalai, Tanggula D105, Amdo Nagqu Field Station and New D66 along the railway line.* represents the trend passing the 95% significance test and ** represents the 99% significance test |
3.2 WRF模式模拟的表面气温结果分析
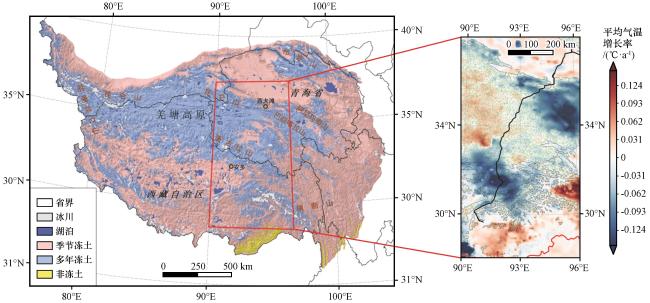
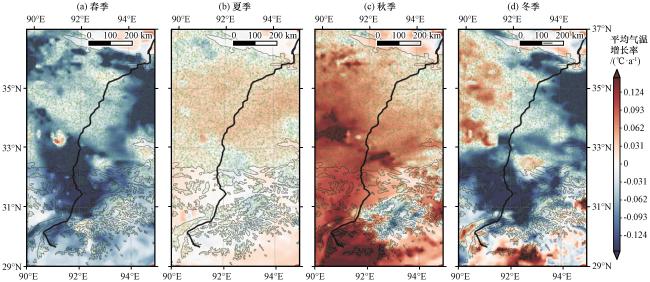
图5 WRF模式模拟的青藏铁路沿线2006 -2020年四季平均气温增长率(单位: ℃·a-1)(a)春季, (b)夏季, (c)秋季, (d)冬季, 绿色打点区域为多年冻土区范围 Fig.5 The growth rate of the seasonal mean temperature (unit: ℃·a-1) along the Qinghai-Xizang Railway from 2006 to 2020, as simulated by the WRF model, indicates significant trends.(a) spring, (b) summer, (c) autumn, (d) winter, The green dotted areas represent the extent of the permafrost regions |
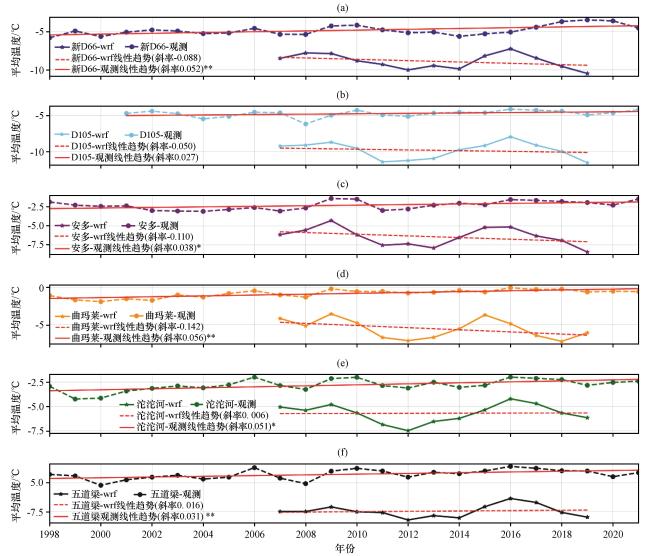
表1 观测和WRF模拟的五道梁、 沱沱河、 曲玛莱和安多-那曲站四季温度变率及二者相关性(WRF/观测/相关系数)Table 1 Observed and WRF simulated four seasons temperature variability at Wudaoliang, Tuotuohe, Qumalai and Ando-Naqu stations and their correlation |
| 站点 | 春季 | 夏季 | 秋季 | 冬季 |
|---|---|---|---|---|
| WRF/[℃·(10a)-1],观测 /[℃·(10a)-1],相关系数 | WRF/[℃·(10a)-1],观测 /[℃·(10a)-1],相关系数 | WRF/[℃·(10a)-1],观测 /[℃·(10a)-1],相关系数 | WRF/[℃·(10a)-1],观测 /[℃·(10a)-1],相关系数 | |
| 五道梁 | 0.01,-0.05,0.76** | 0.60,0.23,0.92** | 0.74,0.27,0.77** | 0.66,0.23,0.67* |
| 沱沱河 | -0.06,-0.3,0.26 | 0.31,0.30,0.83** | 0.64,0.50,0.74** | 0.97,-0.18,0.38 |
| 曲玛莱 | 0.15,-1.4,0.89** | -0.08,0.07,0.97** | 1.43,1.00,0.86** | -0.17,-1.45,0.63* |
| 安多-那曲 | 0.20,-1.8,0.19 | 0.54,0.30,0.95** | 0.61,0.32,0.70** | 1.04,-2.51,-0.07 |
*表示通过95%显著性检验, **表示通过99%显著性检验(* means pass 95% significance test, ** means pass 99% significance test) |
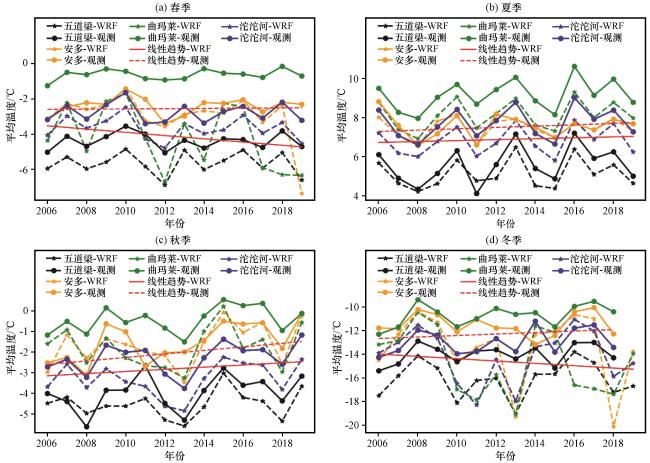
图7 WRF模式模拟的2006 -2019年五道梁、 安多、 沱沱河和曲玛莱4个站点不同季节的温度变化趋势与观测值对比(a)春季, (b)夏季, (c)秋季, (d)冬季 Fig.7 Comparison of temperature variation trends and observed values at Wudaoliang, Ando, Tuotuohe and Qumalai stations in different seasons from 2006 to 2019 simulated by WRF model.(a) spring, (b) summer, (c) autumn, (d) winter |
3.3 WRF模式模拟的降水结果分析
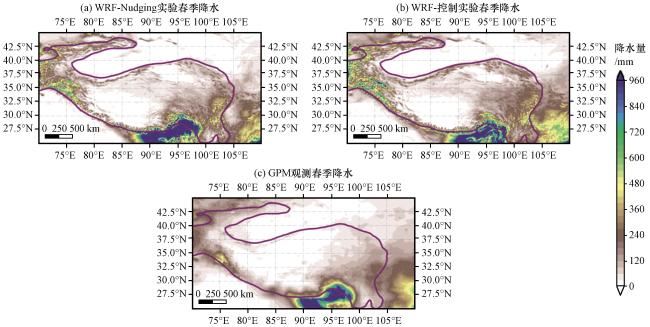
图8 WRF 模式的 Nudging 试验(a)、 控制试验(b)和 GPM 降水资料的 2010 年春季总降水量 (单位: mm)Fig.8 Total precipitation in spring 2010 from Nudging test (a) of WRF model, control test (b) and GPM precipitation data.Unit: mm |
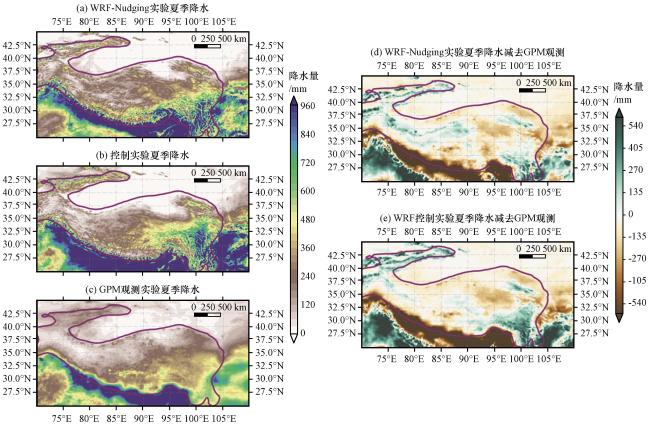
图9 WRF 模式的 Nudging 试验(a)、 控制试验(b)和 GPM 降水资料(c)的 2010 年夏季总降水量以及Nudging 试验与GPM观测的差值(d), 控制试验与GPM观测的差值(e)(单位: mm)Fig.9 Nudging test (a), control test (b) and GPM precipitation data (c) of WRF model in the summer of 2010 and the difference between Nudging test and GPM observation (d), the difference between control test and GPM observation (e).Unit: mm |
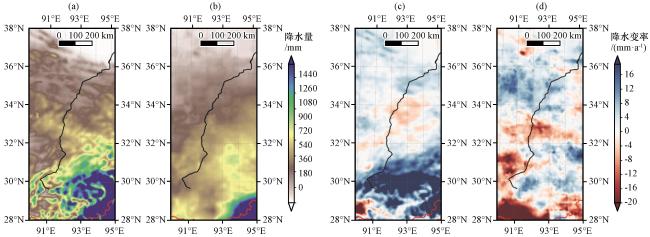
图10 WRF模式模拟的2006 -2020年铁路沿线年平均降水量(a, 单位: mm)和年平均降水变率(c, 单位: mm·a-1)同GPM卫星观测的2006 -2020年铁路沿线年平均降水量(b, 单位: mm)和年平均降水变率(d, 单位: mm·a-1)黑色曲线为青藏铁路格-拉线 Fig.10 The average annual precipitation (a, unit: mm) and the average annual precipitation variability (c, unit: mm·a-1) simulated by WRF model are the same as the average annual precipitation (b, unit: mm) and the average annual precipitation variability (d, unit: mm·a-1) observed by GPM satellite during 2006 -2020.The black curve is the Gei-La line of Qinghai-Tibet Railway |
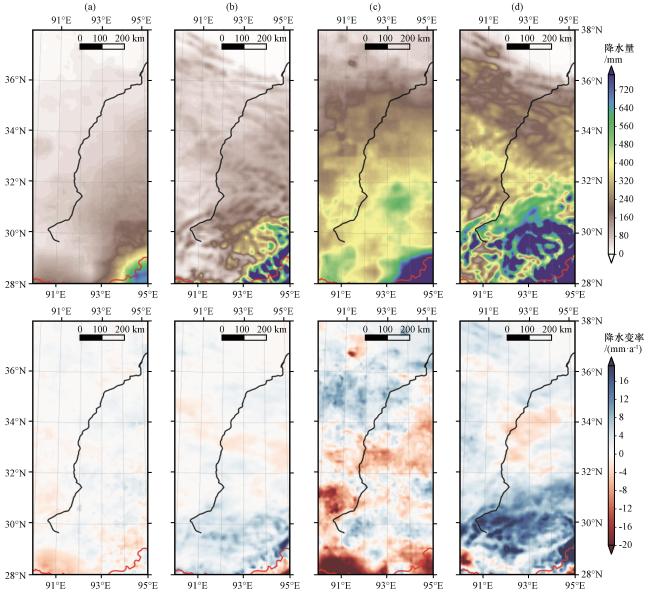
图11 GPM卫星观测(a, c)和WRF模式模拟(b, d)的2006 -2020年铁路沿春季(a, b)和夏季(c, d)的平均降水量(上, 单位: mm)和平均降水变率(下, 单位: mm·a-1)黑色线为青藏铁路格-拉线 Fig.11 Average precipitation (top, unit: mm) and average precipitation variability (bottom, unit: mm·a-1) along the railway in spring (a, b) and summer (c, d) during 2006 -2020, simulated by GPM satellite observation (a, c) and WRF model (b, d) The black line is the Gee-La line of Qinghai-Xizang Railway |
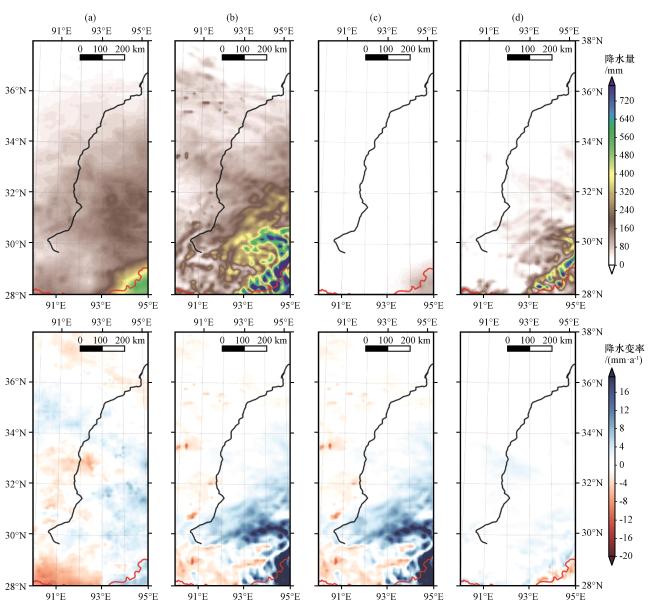


图12 GPM卫星观测(a, c)和WRF模式模拟(b, d)的2006 -2020年铁路沿秋季(a, b)和冬季(c, d)的平均降水量(上, 单位: mm)和平均降水变率(下, 单位: mm·a-1)黑色线为青藏铁路格-拉线 Fig.12 Average precipitation (upper, unit: mm) and average precipitation variability (lower, unit: mm·a-1) along the railway in autumn (a, b) and winter (c, d) during 2006 -2020, simulated by GPM satellite observation (a, c) and WRF model (b, d).The black line is the Gee-La line of Qinghai-Xizang Railway |