论文

区域海气耦合模式WON在东南亚低纬高原一次强降水事件模拟中的应用

  • 桂术 ,
  • 曹杰 ,
  • 杨若文 ,
  • 李蕊
展开
  • 1. 云南省大湄公河次区域气象灾害与气候资源重点实验室,云南大学,云南 昆明 650091
    2. 气象灾害预报预警与评估协同创新中心,江苏 南京 210044
    3. 云南省气候中心,云南 昆明 650034

桂术(1985 -), 男, 云南人, 副教授, 主要从事海气相互作用和气候变化机理研究. E-mail:

收稿日期: 2022-11-23

  修回日期: 2023-06-21

  网络出版日期: 2024-07-25

基金资助

国家自然科学基金项目(42030603)

Application of the Regional Air-sea Coupled Model WON to the Simulation of a Heavy Precipitation Event over the Low Latitude Highland in Southeast Asia

  • Shu GUI ,
  • Jie CAO ,
  • Ruowen YANG ,
  • Rui LI
Expand
  • 1. Yunnan Key Laboratory of Meteorological Disasters and Climate Resources in the Greater Mekong Subregion,Yunnan University,Kunming 650091,Yunnan,China
    2. Collaborative Innovation Center on Forecast and Evaluation of Meteorological Disasters(CIC-FEMD),Nanjing University of Information Science & Technology,Nanjing 210044,Jiangsu,China
    3. Yunnan Climate Center,Kunming 650034,Yunnan,China

Received date: 2022-11-23

  Revised date: 2023-06-21

  Online published: 2024-07-25

摘要

为改善东南亚低纬高原区(LLHSA)降水模拟的性能, 提高降水预报准确性, 本文采用大气环流模式WRF(4.2版)和海洋分量模式NEMO(3.4版), 用耦合器OASIS3-MCT进行桥接, 得到区域海气耦合模式WRF-OASIS-NEMO(WON)。大气和海洋分量模式都配置成相同的Arakawa-C网格, 水平空间分辨率设为0.25°, 耦合频次设置为逐小时, 便于模拟海洋和大气环流相耦合的中尺度运动特征。为评估WON模式的模拟性能, 选取2020年8月16 -18日的强降水过程为例, 与单独WRF模式的模拟效果进行比较分析。WON和WRF模式模拟的降水大值区位于高原东北部和中西部地区, 平均日降水量约为20 mm·d-1, 与观测事实基本相符。WON模式改善了WRF模式在高原南部降水偏多而在高原西北部降水偏少的模拟偏差。WON模式改善了降水动力条件的模拟效果, 在高原中南部气旋式环流增强, 在高原西侧反气旋式环流增强, 进而改善了WRF模式在高原南部周围降水偏少, 高原西北部降水偏多的模拟偏差。WRF和WON模式均能再现垂直螺旋度的发展特征, 即在对流层中低层为正垂直螺旋度发展, 而在对流层高层为负垂直螺旋度发展。两个模式在雨带西部400 hPa高度层附近垂直螺旋度模拟偏强, 而在600~700 hPa高度层上垂直螺旋度模拟偏弱。WON模式相对于WRF模式的改进区域主要集中在雨带中西部地区。本次强降水的水汽来源包括孟湾的西南水汽输送和中国南海的偏南水汽输送。WRF模式和WON模式均能较好地重现相关水汽通量特征。WRF模式在孟湾北部水汽辐合偏强, 而在中国南海水汽向北输送偏弱。WON模式主要改善了WRF模式在中国南海水汽输送偏弱的模拟偏差。WON模式改善降水模拟效果的主要原因是孟湾海表热通量交换导致孟湾中低层大气偏冷偏干, 大气对流活动减弱, 在孟湾北部形成的低层反气旋偏差改善了本次强降水过程动力条件和水汽条件的模拟效果。

本文引用格式

桂术 , 曹杰 , 杨若文 , 李蕊 . 区域海气耦合模式WON在东南亚低纬高原一次强降水事件模拟中的应用[J]. 高原气象, 2024 , 43(4) : 982 -994 . DOI: 10.7522/j.issn.1000-0534.2023.00054

Abstract

To improve the simulation of precipitation and the accuracy of rainfall forecast over the low-latitude highland in Southeast Asia (LLHSA), a regional air-sea coupled model is developed with the Weather Research and Forecast (WRF) Model (version 4.2) and ocean general circulation model NEMO (version 3.4), using the coupler OASIS3-MCT.This new regional air-sea coupled model WRF-OASIS-NEMO is herein referred as WON.Both the atmospheric and oceanic components were configured into the same Arakawa-C grid with a horizontal spatial resolution of 0.25° and a coupling frequency of 1 hour, which are suitable for facilitating the mesoscale coupling between the atmosphere and ocean models.The evaluation of the WON model is based on the heavy precipitation event from August 16 to 18, 2020, where the simulation of WON model is compared with the standalone WRF model.The WON and WRF models simulated large precipitation over the northeastern LLHSA, the central and western LLHSA with daily precipitation around 20 mm·d-1, which is generally consistent with the observation.The WON model ameliorated the underestimation bias of precipitation over the southern LLHSA and the overestimation bias of precipitation over the northwestern LLHSA and the western LLHSA in the WRF model.The WON model improved the simulation of the dynamic conditions of precipitation, with enhanced cyclonic circulation over the central and southern LLHSA and enhanced anticyclonic circulation over the western LLHSA.Hence, the WON model ameliorated underestimation of precipitation over the southern LLHSA and overestimation of precipitation over the northwestern LLHSA.Both WRF and WON models could reproduce the development characteristics of vertical helicity, that is, positive vertical helicity in the lower-mid troposphere and negative vertical helicity in the upper troposphere.However, the simulated vertical helicity is too strong near 400 hPa layer over the western rain belt, but too weak at 600~700 hPa layer.Compared with the WRF model, the WON model shows improvements mainly in the central-western part of the rain belt.The water vapor sources of this heavy rainfall include the water vapor transport from the southwest of the Bay of Bengal and the water vapor transport from the South China Sea.Both WRF model and WON model reproduced the spatial characteristics of water vapor flux.In the WRF model, the water vapor convergence is too strong over the northern Bay of Bengal, but too weak over South China Sea.The improvement of WON model is mainly over South China Sea.The simulation improvement of the WON model is mainly because the surface heat flux exchange over the Bay of Bengal caused the mid-lower levels of troposphere to become cooler and drier.The atmospheric convection was weakened, associated with a low-level anticyclonic bias over the northern Bay of Bengal.This anticyclonic bias improved the simulation of atmospheric dynamics and water vapor conditions for this heavy precipitation event.

1 引言

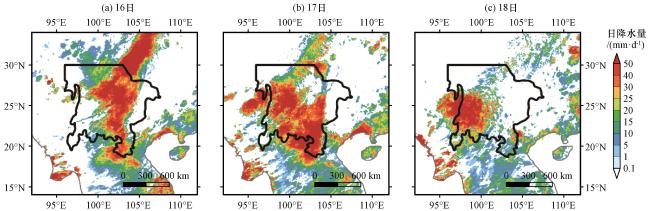
东南亚低纬高原位于世界“第三极”青藏高原东南部, 平均海拔在1000 m以上, 是世界十大低纬高原之一。东南亚低纬高原主体位于[96°E -108°E, 18°N -30°N; 图1(a)]范围内, 主要由云贵高原和掸邦高原组成, 平均海拔和高原面积约为青藏高原的三分之一。东南亚低纬高原涵盖四条国际河流(独龙河-伊洛瓦底江、 萨尔温江-怒江、 澜沧江-湄公河和元江-红河), 高原区域有高山、 深谷、 盆地、 河流和湖泊等复杂地形, 海拔落差显著。东南亚低纬高原复杂的地貌和显著的海拔落差通过机械抬升和热力强迫影响东亚夏季风(EASM)及其水汽输送, 使周边地区降水呈现出显著的局地性特点。
图1 2020年8月16 -18日CHIRPS (2.0版)的逐日降水量的空间分布(单位: mm·d-1)

黑色实线标注的区域为东南亚低纬高原边界

Fig.1 Spatial distribution of daily precipitation from 16 to 18 August, 2020, for CHIRPS (version 2.0).Unit: mm·d-1The area marked by the black solid line in each subplot is the boundary of the low-latitude highland in Southeast Asia

东南亚低纬高原为典型的季风气候区, 干湿季节分明。每年夏季, 来自南海和孟湾的水汽在东南亚低纬高原上空辐合并向下游输送, 为东亚地区带来丰沛的降水。因此, 东南亚低纬高原区的大气环流状况不仅能导致局地降水异常并引发气象地质灾害, 而且是影响东亚汛期降水的重要因素。东南亚低纬高原的雨季降水受到高原地形、 海表温度异常配置以及热带对流扰动等多重因素的影响。例如, 赤道东印度洋和西北太平洋的海温异常配置引起辐散环流异常并造成越南中部的强降水事件(Liang and Sun, 2004; Li et al, 2015; Quang et al, 2020)。印度夏季风和东亚夏季风的协同变化是东南亚低纬高原区降水的重要影响因素, 其中印度夏季风主要影响澜沧江-湄公河西侧的降水变化, 而东亚夏季风主要影响湄公河东南部的降水异常(Yang et al, 2018)。此外, 来自南海和热带西太平洋的西传热带气旋、 热带风暴、 ENSO事件等也是影响东南亚低纬高原及周边地区降水的重要因素(Chen and Yoon, 2000; Fudeyasu et al, 2006; Takahashi and Yasunari, 2008; Takahashi et al, 2015; 陈子凡等, 2022; 雷显辉等, 2022; 田高山等, 2022; 夏阳等, 2023; 张天宇等, 2023; )。尽管前人对东南亚低纬高原地形的动力和热力作用进行过研究, 但受限于观测资料时空覆盖度和分辨率, 东南亚地形的影响机理仍有待进一步探索。
东南亚低纬高原区的复杂地形在很大程度上局限了常规观测资料的空间代表性, 而卫星遥感数据能够在难以观测的时空尺度上补充观测资料的不足。随着气象卫星技术不断发展, 气象参数探测和反演方法不断完善, 卫星遥感数据已成为数值预报模式最主要的同化资料来源。鉴于东南亚低纬高原复杂地形以及热带海气反馈对季风环流的显著影响, 需要数值模式能解析精细化地形和海气相互作用的影响。高分辨率区域海气耦合模式能够较好地模拟地形和中尺度海气反馈过程(王志福等, 2008; 李翠华等, 2010; 董广涛等, 2012; 齐庆华等, 2013; 严小冬等, 2017), 是进行东南亚低纬高原降水模拟的不二之选。前人研究表明中尺度天气研究预报模式WRF能够较好地解析高分辨率地形起伏造成的降水和相关水汽相态转变过程(孙辉等, 2013; 栾澜等, 2017; 阴蜀城等, 2020), 而海洋环流模式NEMO能较好地模拟SST和海洋环流演变过程(Liu, 2017; Momin et al, 2021)。Samson et al(2014)利用耦合器OASIS3, 首次将大气环流模式WRF-3.6与海洋环流模式NEMO3.4相耦合, 得到区域海气耦合模式NEMO-OASIS-WRF (NOW), 并用来研究热带印度洋降水和热带气旋活动。研究结果表明区域海气耦合模式NOW对印度夏季风的活跃期和中断期均有较好的模拟效果, 而NOW模式较高的分辨率也使得热带气旋的时空分布特征更接近观测事实。
东南亚低纬高原的气象衍生灾害频发, 亟待提高气象模拟和预报的准确率。为此, 把NOW中的大气分量模式升级为新版大气环流模式WRF-v4.2, 按照相同的耦合框架发展了区域海气耦合模式WRF-OASIS-NEMO (WON)。本文应用WON模式和单独大气模式WRF-v4.2对2020年8月16 - 18日的一次典型汛期降水过程进行数值模拟试验。此次强降水过程的降雨量在部分地区接近历史极值, 造成严重的城市内涝灾害, 给城市正常运行和人民生活带来不利影响。前人研究表明WRF模式能较好地再现低纬高原地区强降水过程的高湿水汽条件以及大气动力条件(Davis et al, 2008, 2016; Torn and Davis, 2012)。本文通过对比分析WRF和WON模式的模拟效果, 揭示耦合海洋分量模式对本次强降水过程模拟效果的影响, 并对WON模式的性能进行初步评估。

2 数值模式、 试验设计和资料来源

2.1 数值模式

本文介绍的区域海气耦合模式(WON)包括大气分量模式WRF-v4.2, 海洋分量模式NEMO-v3.4和耦合器OASIS3(Valcke, 2013)。大气分量模式WRF是美国国家环境预报中心(NCEP)、 美国国家大气研究中心(NCAR)等研究机构联合开发的中尺度天气预报模式。WRF模式的动力框架采用完全可压缩的非静力欧拉方程组, 用具有通量形式表示守恒变量(Skamarock et al, 2019)。WRF配备的物理参数化方案涵盖云微物理过程、 行星边界层、 积云对流、 浅对流、 辐射收支和陆面过程等物理过程。鉴于研究区域为热带地区, 本文选用热带物理参数化集合(tropical suite), 它是美国国家大气研究中心(NCAR)在预测热带风暴轨迹和强度的实践中总结得到的最佳物理参数化方案配置。该参数化方案集合包括Tiedtke 积云对流参数化方案(Zhang and Wang, 2017), WSM6云微物理参数化方案(Hong and Lim, 2006), RRTMG长波短波辐射模型(Mlawer et al, 1997), YSU 行星边界层方案(Hong et al, 2006), MM5相似理论迭代方案(Zhang and Anthes, 1982), Noah陆面过程参数化模式(Chen and Dudhia, 2001)。
海洋分量模式是欧洲海洋建模核心研发的海洋环流模式NEMO第3.4版(NEMO-v3.4)。NEMO-v3.4的海洋部分源于西蒙-彼埃尔研究所(IPSL)(Madec and the NEMO team, 2008)研发的海洋并行环流模式(OPA), 海冰部分为新鲁汶(Louvaine-la-Neuve)研发的第二版海冰模式(LIM2)(Vancoppenolle et al, 2009a, 2009b)。NEMO的动力框架是包括动量方程、 静力平衡方程和不可压缩方程等的一个复杂非线性方程组, 模式采用有限差分方法对动力框架进行数值求解。NEMO模型可以选择具有全步长或部分步长的z坐标、 具有起伏地形的s坐标和混合s-z坐标系。垂直混合系数可设为常数, 也可由TKE、 GLS和KPP等湍流闭合模型进行计算。为规避计算域内的奇异点, NEMO在进行全球海洋环流模拟时采用全球正交曲线网格(ORCA)进行三极投影。本文采用高分辨率(ORCA025)NEMO全球模拟数据为WON提供海洋模式的侧边界场, ORCA025的水平分辨率约为0.25°, 垂直层数75层。
OASIS耦合器用于在气候系统模型之间同步交换变量。OASIS耦合器的开发始于1991年, 用于在大气和海洋环流模式之间传递变量。随着OASIS的改进, 耦合器本身的模块化程度不断提高, 组件模式的设置和耦合变量的处理更加方便灵活, 组件模式的积分顺序可设置为串行和并行。目前OASIS由欧洲气候模拟和全球变化研究中心(CERFACS)和法国国家科学研究中心开发(Craig et al, 2017)。本研究采用的是OASIS3-MCT版本, 它包括多种插值方法实现变量在分量模式之间传递, 在进行数值试验时需要设置变量耦合的起始时间、 积分持续时间、 耦合频率、 和插值方法等。OASIS还可以建立前后处理方法来耦合组件模式之间交换的变量, 包括物理量的线性组合和通量守恒。

2.2 试验设计

本研究中大气和海洋分量模式都配置成相同的Arakawa-C网格, 这样分量模式间能够直接传递变量, 保证耦合变量在模拟区域内精确守恒, 还能降低计算功耗。大气和海洋分量模式的网格距设为0.25°, 相对较高的空间分辨率有助于捕捉到海洋和大气环流的中尺度特征, 例如海洋涡旋和热带气旋。大气和海洋分量模式间进行动量、 热量和物质交换的物理量共9个, 其中大气分量模式WRF-v4.2经耦合器OASIS3-MCT传递到海洋分量模式NEMO-v3.4的物理量共6个, 包括经纬向海表风应力、 太阳辐射和非太阳热力通量, 经向和纬向风应力分别传输到NEMO-v3.4的U网格和V网格上; 海洋分量模式NEMO-v3.4经耦合器OASIS3-MCT传递到大气分量模式WRF-v4.2的物理量共3个, 包括海表温度和经纬向洋流速度。数值试验起始时刻为2020年7月1日, 第1个月的积分作为模式预热时段, 大气分量模式的积分步长为120 s, 海洋分量模式的积分步长为360 s, 大气和海洋分量模式的耦合频次为1 h一次, 模式输出频次为1 h一次。

2.3 资料来源

本文采用以下两套再分析资料用于模式评估和分析:
(1) 美国国际开发署的饥荒预警系统网络(FEWS)发布的准全球陆面降水数据集CHIRPS (2.0版), 空间分辨率为0.05°, 时间分辨率为1天, 从1981年1月1日起至今。CHIRPS数据融合了卫星数据、 站点观测数据和基于CCD扫描技术测量的逐日降水数据, 尤其对稀疏站点区域的降水具有较高的代表性(Funk et al, 2015)。鉴于东南亚低纬高原区降水有较强的局地性特点, 且测站分布不均匀, 前人多采用CHIRPS数据进行研究。
(2) 欧洲中期天气预报中心的ERA5再分析资料, 水平空间分辨率为0.25°, 从1000~100 hPa的垂直层数18层, 包括重力位势、 气温、 水平风场、 垂直速度和中低层云量(Hersbach et al, 2020)。

3 模拟结果分析

3.1 平均日降水量

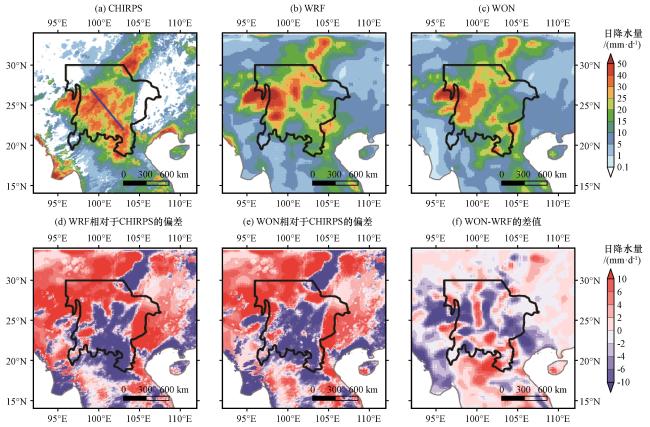
2020年8月16日00:00(北京时)至18日24:00的强降水过程自东向西影响东南亚低纬高原, 其中横断山区的主要降水时段为17日(图1)。16日降雨中心位于四川攀枝花、 云南昆明、 楚雄、 玉溪、 红河地区; 17日降水中心位于云南大理、 丽江、 保山和红河地区; 18日降水中心主要位于保山、 德宏、 临沧地区。此次降水过程主要集中在东南亚低纬高原的东北部、 中西部和东南部地区, 最大降水量超过40 mm·d-1[图2(a)]。WRF和WON模式均能相对准确地再现实测降水空间分布特征, 降水大值区主要集中在高原中西部和东南部地区[图2(b)~(c)]。两个模式的模拟偏差空间型也相似, 在高原区中部和东南部的降水中心值模拟偏弱, 而在高原西北部和东侧的降水模拟偏多[图2(d)~(e)]。CHIRPS降水数据在东南亚低纬高原的区域平均值为20 mm·d-1, WRF和WON模式的模拟结果分别为21 mm·d-1和20 mm·d-1, 区域平均降水模拟效果较好。但两个模式在东南亚低纬高原区内的降水模拟偏差相对较大, 例如WRF模式高估了东南亚低纬高原西北部(缅甸克钦邦和云南怒江州)和东部地区(云南文山州)的降水量, 最大偏差接近35 mm·d-1。此外WRF模式还低估了东南亚低纬高原南部(老挝北部、 越南北部、 云南西双版纳州和普洱市等地区)的降水量, 最大偏差接近30 mm·d-1。WON模式在一定程度上改善了上述地区的降水模拟偏差[图2(f)]。WON模式在东南亚低纬高原区的降水均方根误差为12 mm·d-1, 低于WRF模式的降水均方根误差(13 mm·d-1)。
图2 2020年8月16日00:00至18日24:00平均日降水量(单位: mm·d-1)

(a)中蓝色实线代表强降水西部中心和南部中心连成的雨带。黑色实线标注的区域为东南亚低纬高原边界

Fig.2 The average daily precipitation from 00:00 on 16 to 24:00 on 18 August, 2020.Unit: mm·d-1.The blue solid line in (a) represents the rain belt connecting the western center and the southern center of heavy precipitation.The area marked by the black solid line in each subplot is the boundary of the low-latitude highland in Southeast Asia

3.2 大气动力条件

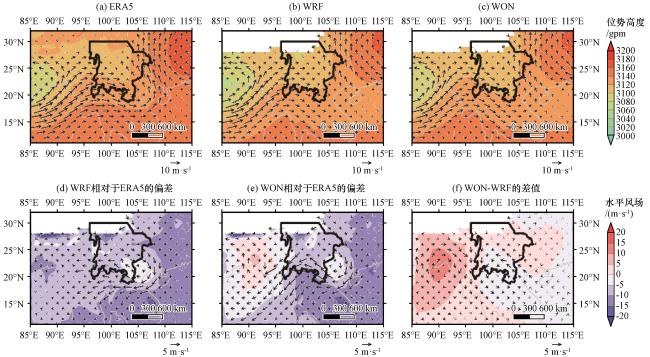
在观测中, 本次强降水过程伴随着强烈的气旋性辐合, 风场及位势高度场在东南亚低纬高原南部有明显的气旋性弯曲。高原中部为位势高度相对低值区, 而高原以东可见表征西太副高西伸的位势高度大值区[图3(a)]。东南亚低纬高原的低压槽加强附近气流辐合上升, 为降水提供动力条件, 而低压槽西侧的西南风和东侧的偏南风有助于增强孟湾和南海的水汽输送, 为降水提供水汽条件。WRF和WON基本上都能再现上述大气环流特征[图3(b)~(c)], 但模拟结果都低估了高原南部气旋性环流的强度[图3(d)~(e)]。相比于WRF, WON模式在高原西侧有反气旋异常, 中心位于孟加拉国附近, 反气旋异常东侧的偏北风与越南北部的偏南风在低纬高原的中部和南部形成一个弱的气旋性辐合异常[图3(f)]。
图3 2020年8月16日00:00至18日24:00平均的700 hPa重力位势高度(填色等值线, 单位: gpm)和水平风场(矢量, 单位: m·s-1)。

图中黑色实线标注的区域为东南亚低纬高原边界

Fig.3 The average geopotential height (shaded contour, unit: gpm) and horizontal wind field (vector, unit: m·s-1) at 700 hPa from 00:00 on 16 to 24:00 on 18 August 2020.The area marked by the black solid line in each subplot is the boundary of the low-latitude highland in Southeast Asia

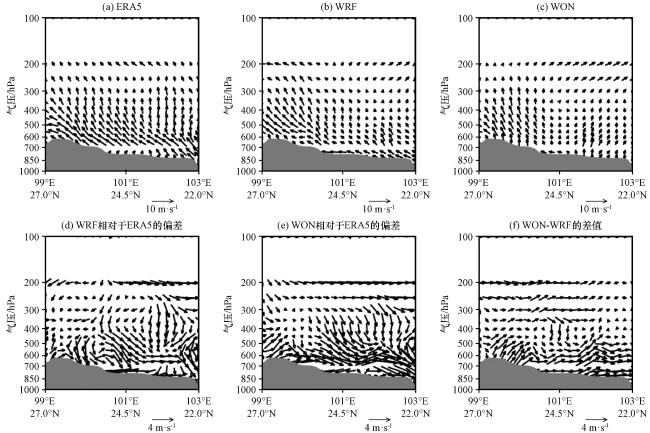
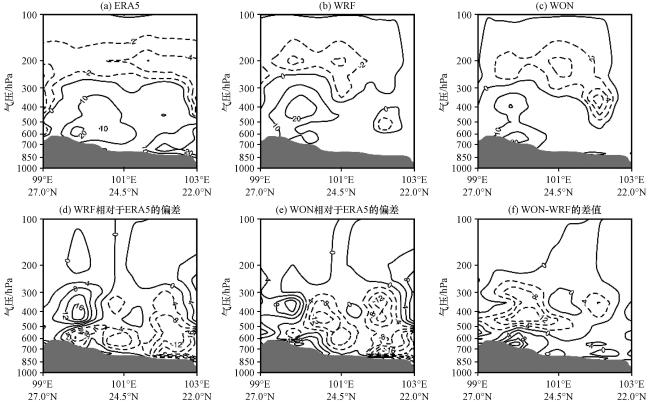
WON模式模拟的高原南侧气旋性环流比WRF模式更强[图3(f)], 有利于发生局部强降水事件, 降水强度也比WRF模式更大。WON模式模拟的高原西侧西南风比WRF模式更弱, 形成的反气旋式环流不利于降水发生, 雨强减弱。WON模式动力条件的变化减小了降水在高原南侧偏多而在西侧偏少的模拟偏差。沿着强降水雨带可以发现[图2(a)和图3(a)中蓝色实线], 本次强降水过程伴随着强烈的上升运动贯穿整个对流层, 水平风场在大气低层为东南风, 随高度上升逐渐减弱[图4(a)]。WRF和WON模式均能再现上述大气环流特征[图4(b)~(c)], 但两个模式都低估了对流上升的强度, 这与模式模拟的低层气旋性切变较弱有关[图4(d)~(e)]。WRF模式明显低估了雨带东部及中部的垂直上升运动, 而WON模式在一定程度上改善了WRF模式上述偏差, 但也伴随着东南风偏弱的偏差[图4(f)]。
图4 2020年8月16日00:00至18日24:00强降水雨带上空大气垂直环流(水平风速单位: m·s-1, 垂直风速单位: Pa·s-1)

Fig.4 The average vertical circulation over the heavy precipitation rain belt from 00:00 on 16 to 24:00 on 18 August 2020.The unit of horizontal wind speed: m·s-1, the unit of vertical wind speed: Pa·s-1

在强对流天气过程中垂直螺旋度的变化比垂直速度和涡度的变化更明显, 当气流逆时针旋转上升时垂直螺旋度为正, 反之垂直螺旋度为负, 垂直螺旋度在强降水过程分析中具有较好的指示作用(李耀东等, 2004; 尤红等, 2007; 岳彩军等, 2011)。本次强降水过程伴随着对流层中低层的正垂直螺旋度发展, 以及对流层高层的负垂直螺旋度发展[图5(a)]。在600~700 hPa高度层上出现两个强闭合中心, 中心区域螺旋度大于2×10⁻⁵ hPa·s-2, 而在200 hPa高度层上出现一个负的闭合中心与之相应, 中心区域螺旋度小于-4×10⁻⁶ hPa·s-2。对流层中低层正螺旋度和高层负螺旋度的发展有助于加强局地辐合上升运动和大气抽吸作用, 为强降水的发展提供有利的动力条件。WRF和WON模式均能再现上述垂直螺旋度的分布特征[图5(b)~(c)]。两个模式的模拟偏差相似, 在雨带西部400 hPa高度层附近垂直螺旋度模拟偏强, 而在600~700 hPa高度层上垂直螺旋度模拟偏弱[图5(d)~(e)]。WON模式对WRF模式的模拟偏差有一定程度的改善, 改进区域主要集中在雨带中西部地区[图5(f)]。WON模式的垂直螺旋度在雨带西北部比WRF模式有所减弱, 降水强度减少, 而WON模式的垂直螺旋度在雨带东南部比WRF模式有所增强, 降水强度增加。上述结果表明WON模式改变了对流上升垂直结构从而减少了降水模拟偏差。
图5 2020年8月16日00:00至18日24:00强降水雨带上空的平均垂直螺旋度(单位: ×10-6 hPa·s-2)

Fig.5 The average vertical helicity over the heavy precipitation rain belt from 00:00 on 16 to 24:00 on 18 August 2020.Unit: ×10-6 hPa·s-2

3.3 水汽条件

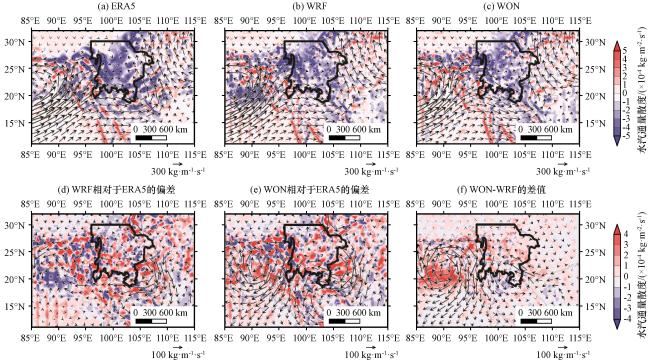
本次强降水的水汽来源包括孟加拉湾的西南水汽输送和中国南海的偏南水汽输送, 两支水汽通道在低纬高原区辐合, 为降水过程的维持和发展提供有利的水汽条件[图6(a)]。WRF模式和WON模式均能较好地重现再分析资料的水汽通量特征[图6(b)~(c)]。WRF模式模拟的孟湾北部水汽辐合偏强, 而中国南海的水汽输送偏弱[图6(d)]。WON模式模拟的孟湾北部水汽辐散偏强, 而来自中国南海的水汽输送也模拟偏弱[图6(e)]。WON模式增强了来自中国南海的水汽输送, 在LLHSA南侧的水汽辐合增强[图6(f)]。WON模式减弱了来自孟加拉湾的水汽输送, 在孟加拉湾北部水汽辐散增强。WON模式增强了LLHSA南部的水汽辐合, 降水增多; WON模式减弱了LLHSA西部的水汽输送, 降水减少。上述水汽条件的变化改善了WRF模式在LLHSA西北部降水偏多, 而在LLHSA南部降水偏少的模拟偏差。
图6 2020年8月16日00:00至18日24:00平均垂直积分水汽通量(矢量, 单位: kg·m-1·s-1)及其散度(填色等值线, 单位: ×10-4 kg·m-2·s-1)

黑色实线标注的区域为东南亚低纬高原边界

Fig.6 The average vertically integrated water vapor flux (vector, unit: kg·m-1·s-1) and its divergence (shaded contour, unit: ×10-4 kg·m-2·s-1) from 00:00 on 16 to 24:00 on 18 August 2020.The area marked by the black solid line in each subplot is the boundary of the low-latitude highland in Southeast Asia

3.4  WON改善降水模拟的可能原因

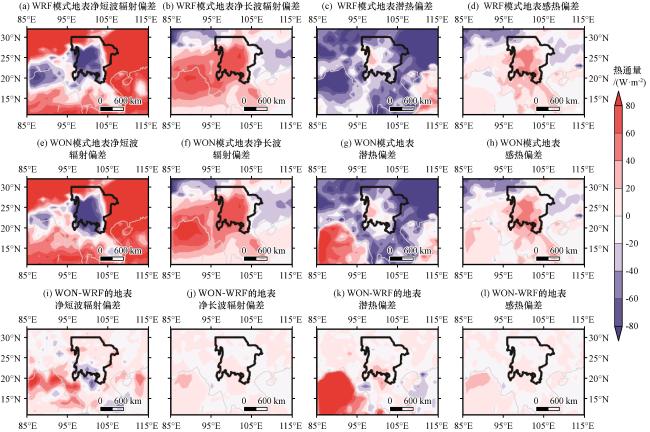
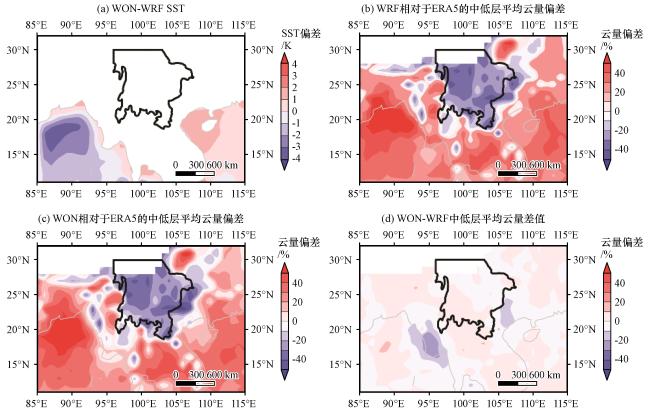
区域海汽耦合模式WON引入了大气和海洋之间的热量、 动量和水汽交换, 其中大气动量和水汽输送的变化已分别在3.2节和3.3节做过分析, 本节从热力角度出发对海气耦合改善降水模拟效果的原因进行初步探索。海气相互作用中的热力收支主要包括地表净短波辐射、 地表净长波辐射、 地表潜热和地表感热四个部分。本节中所有热通量都以向下输入地表为正, 向上离开地表为负。WRF和WON模式对海表热通量的模拟偏差相似[图7(a)~(h)], 两个模式模拟结果差异最大的是孟湾潜热通量, 其次是孟湾北部的净短波辐射[图7(i)~(l)]。WON模式模拟的孟湾SST偏低[图8(a)], 海表蒸发减弱, 海表潜热损耗减少。WRF和WON模式在孟湾北部净短波辐射的差异与两个模式中云量的变化有密切关系。虽然WRF和WON模式的云量模拟偏差相似[图8(b)~(c)], 但WON模式模拟的云量在孟湾东北部比WRF模式明显减少[图8(d)], 有助于增加孟湾北部净短波辐射。
图7 2020年8月16日00:00至18日24:00 WRF模式模拟的平均地表热通量相对于ERA5数据的模拟偏差(单位: W·m-2)

黑色实线标注的区域为东南亚低纬高原边界

Fig.7 Simulation bias of the average surface heat flux from 00:00 on 16 to 24:00 on 18 August 2020, in the WRF experiment relative to the ERA5 data.Unit: W·m-2.The area marked by the black solid line in each subplot is the boundary of the low-latitude highland in Southeast Asia

图8 2020年8月16日00:00至18日24:00不同模拟结果间平均 SST差值(a, 单位: K), 中低层平均云量偏差(b, c, 单位: %)和中低层平均云量的差值图(c, d, 单位: %)

实线标注的区域为东南亚低纬高原边界

Fig.8 Difference in the average SST (a, unit: K), the bias in the average low and mid-level cloud cover (b, c, unit: %), and the difference in the average low and mid-level cloud cover (d, unit: %) from 00:00 on 16 to 24:00 on 18 August 2020 between different simulation results.The area marked by the black solid line in each subplot is the boundary of the low-latitude highland in Southeast Asia

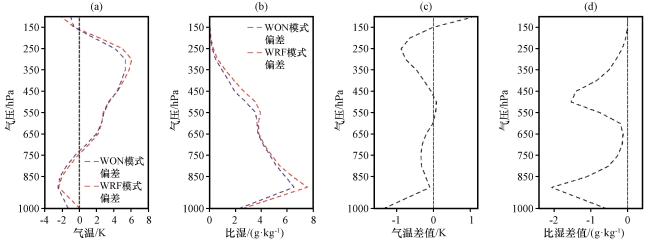
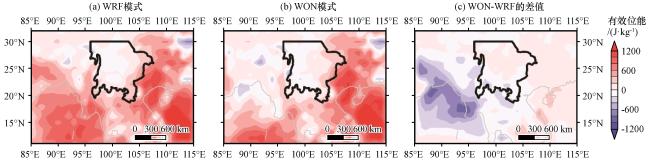
海表热通量的变化会改变大气温湿垂直结构, 进而引发大气环流响应(Greasby and Sain, 2011; 邹立维和周天军, 2012; Kotlarski et al, 2015; Ji et al, 2020)。WRF模式和WON模式在孟湾的区域平均(85°E -95°E, 10°N -22°N)温湿偏差垂直廓线相似[图9(a)~(b)], 但WON模式的低层气温比WRF模式更低[图9(c)], 温度层结较WRF模式更加稳定, 大气静力稳定度增加, 造成中低层云量减少, 并使得到达孟湾的净短波辐射增加。WON模式的低层比湿比WRF模式有所减少[图9(d)]。WON模式模拟的孟湾地区中低层大气偏冷偏干, 导致大气对流活动减弱。WRF模式和WON模式的对流有效位能(CAPE)偏差相似[图10(a)~(b)], 两个模式的差异主要体现在孟湾东北部WON模式的CAPE值比WRF模式更小[图10(c)], 大气对流活动减弱, 在孟湾北部形成的低层反气旋偏差[图3(e)~(f)]改善了LLHSA降水的动力条件和水汽条件, 从而提高了LLHSA降水的模拟效果。
图9 2020年8月16日00:00至18日24:00 85°E -95°E, 10°N -22°N区域平均气温偏差垂直廓线(a), 比湿偏差垂直廓线(b), WON模式和WRF模式的气温垂直廓线差值图(c), WON模式和WRF模式的比湿垂直廓线差值图(d)

Fig.9 Vertical profile of the simulation bias in temperature (a) and specific humidity (b) averaged over 85°E -95°E, 10°N -22°N and the difference in the vertical profiles of temperature (c) and specific humidity (d) from 00:00 on 16 to 24:00 on 18 August 2020

图10 2020年8月16日00:00至18日24:00平均大气对流有效位能的模拟值及其偏差(单位: J·kg-1)

实线标注的区域为东南亚低纬高原边界

Fig.10 Simulation values and its bias of the convective available potential energy averaged from 00:00 on 16 to 24:00 on 18 August 2020.Unit: J·kg-1.The area marked by the black solid line in each subplot is the boundary of the low-latitude highland in Southeast Asia

4 结论

本文利用Samson et al(2014)研发的区域海气耦合模式框架, 采用中尺度天气预报模式WRF(4.2版)作为大气分量模式, 海洋环流模式NEMO(3.4版)作为海洋分量模式, 通过耦合器OASIS3-MCT桥接, 研发了新的区域海气耦合模式WRF-OASIS-NEMO(WON)。用WON模式和WRF模式对东南亚低纬高原2020年8月16 -18日的强降水过程进行数值模拟试验, 并将模拟结果相互比较, 得到如下主要结论:
(1) WON模式能够较好地模拟东南亚低纬高原强降水空间分布特征, WON模式改善了WRF模式在LLHSA西北部降水偏多而在LLHSA南部降水偏少的模拟偏差。
(2) WON模式比WRF模式更好地模拟了强降水过程的大气动力条件, 包括对低纬高原上空低压槽偏弱、 对流上升强度偏低, 雨带西部垂直螺旋度在低层偏弱而在高层偏强等偏差都有所改进。
(3) WON模式对降水过程中水汽条件的模拟也有一定程度的改进, 主要对WRF模式模拟中国南海水汽输送偏弱的偏差有所改进。
(4) WON模式提高降水模拟效果的主要原因是WON模式在孟湾的海表热通量交换导致大气变冷变干, 大气对流活动减弱, 在孟湾北部形成的低层反气旋偏差改善了本次强降水过程动力条件和水汽条件的模拟效果。
本文仅对东南亚低纬高原的一次强降水过程进行分析, 尚不足以明晰WON模式的模拟性能, 对降水相关云微物理过程的模拟仍有待进一步研究。

参考文献

null
Chen F, Dudhia J, 2001.Coupling an advanced land surface-hydrology model with the Penn State-NCAR MM5 modeling system.Part I: Model implementation and sensitivity[J].Monthly Weather Review, 129: 569-585.DOI: 10.1175/1520-0493(2001)129<0569: CAALSH>2.0.CO; 2 .
null
Chen T C, Yoon J H, 2000.Interannual variation in Indochina Summer Monsoon rainfall: possible mechanism[J].Journal of Climate, 13: 1979-1986.DOI: 10.1175/1520-0442(2000)013<1979: IVIISM>2.0.CO; 2 .
null
Craig A, Valcke S, Coquart L, 2017.Development and performance of a new version of the OASIS coupler, OASIS3-MCT_3.0[J].Geoscientific Model Development, 10(9): 3297-3308.DOI: 10.5194/gmd-10-3297-2017 .
null
Davis C, Ahijevych D, Wang W, et al, 2016.Evaluating medium-range tropical cyclone forecasts in uniform-and variable-resolution global models[J].Monthly Weather Review, 144: 4141-4160.DOI: 10.1175/ MWR-D-16-0021.1 .
null
Davis C, Wang W, Chen S, et al, 2008.Prediction of landfalling hurricanes with the advanced hurricane WRF Model[J].Monthly Weather Review, 136: 1990-2005.DOI: 10.1175/2007MWR2085.1 .
null
Fudeyasu H, Iizuka S, Matsuura T, 2006.Seasonality of westward-propagating disturbances over Southeast and south Asia originated from typhoons[J].Geophysical Research Letters, 33(10): L10809.DOI: 10.1029/2005gl025380 .
null
Funk C, Peterson P, Landsfeld M, et al, 2015.The climate hazards infrared precipitation with stations-a new environmental record for monitoring extremes[J].Scientific Data, 2: 150066.DOI: 10.1038/sdata.2015.66 .
null
Greasby T A, Sain S R, 2011.Multivariate spatial analysis of climate change projections[J].Journal of Agricultural Biological and Environmental Statistics, 16: 571-585.DOI: 10.1007/s13253-011-0072-8 .
null
Hersbach H, Bell B, Berrisford P, et al, 2020.The ERA5 global reanalysis[J].Quarterly Journal of the Royal Meteorological Society, 146: 1999-2049.DOI: 10.1002/qj.3803 .
null
Hong S Y, Lim J O J, 2006.The WRF single-moment 6-class microphysics scheme (WSM6)[J].Journal of Korean Meteorological Society, 42: 129-151.
null
Hong S Y, Noh Y, Dudhia J, 2006.A new vertical diffusion package with an explicit treatment of entrainment processes[J].Monthly Weather Review, 134(9): 2318-2341.DOI: 10.1175/Mwr3199.1 .
null
Ji F, Evans J P, Di Virgilio G, et al, 2020.Projected changes in vertical temperature profiles for Australasia[J].Climate Dynamics, 55: 2453-2468.DOI: 10.1007/s00382-020-05392-2 .
null
Kotlarski S, Luthi D, Schar C, 2015.The elevation dependency of 21st century European climate change: an RCM ensemble perspective[J].International Journal of Climatology, 35: 3902-3920.DOI: 10.1002/joc.4254 .
null
Li R, Wang S Y, Gillies R R, et al, 2015.Decadal oscillation of autumn precipitation in Central Vietnam modulated by the East Pacific-North Pacific (EP-NP) teleconnection[J].Environmental Research Letters, 10(2): 1748-9326.DOI: 10.1088/1748-9326/10/2/024008 .
null
Liang S, Sun Z, 2004.Characteristics of summer precipitation in North Vietnam and its relation to Pacific SSTs[J].Journal of Nanjing Institute of Meteorology, 27(6): 844-848.
null
Liu J, 2017.Evaluation of a NEMO model of the Strait of Georgia and insights into mixing and transport of the Fraser River plume[D].University of British Columbia.
null
Madec G, the NEMO team, 2008.NEMO ocean engine[R].Note du Pole de modelisation, Institut Pierre-Simon Laplace (IPSL), France, No 27, ISSN No 1288-1619.https: //www.semanticscholar.org/paper/NEMO-ocean-engine-Madec/33cd9cbc6e275577f647157458817180c23ca431.
null
Mlawer E, Taubman S, Brown P, et al, 1997.Radiative transfer for inhomogeneous atmospheres: RRTM, A validated correlated-k model for the longwave[J].Journal of Geophysical Research, 102: 16663-16682.DOI: 10.1029/97JD00237 .
null
Momin I M, Mitra A K, Bhatla R, 2021.Assessment of NEMO simulated surface current with HF radar along Andhra Pradesh coast[J].Journal of Advances in Modelling Earth Systems, 130: 69.DOI: 10.1007/s12040-021-01553-x .
null
Quang V D, Hong X D, Nhu C, et al, 2020.Changes in precipitation extremes across Vietnam and its relationships with Teleconnection Patterns of the Northern Hemisphere[J].Water, 12(6): 1646.DOI: 10.3390/w12061646 .
null
Samson G, Masson S, Lengaigne M, et al, 2014.The NOW regional coupled model: Application to the tropical Indian Ocean climate and tropical cyclone activity[J].Journal of Advances in Modelling Earth Systems, 6: 700-722.DOI: 10.1002/2014MS000324 .
null
Skamarock W C, Klemp J B, Dudhia J, et al, 2019.A description of the advanced research WRF Model Version 4[R].NCAR Technical Note, NCAR/TN-5565+STR, 162 pp.DOI: 10.5065/1dfh-6p97.
null
Takahashi H G, Fujinami H, Yasunari T, et al, 2015.Role of tropical cyclones along the monsoon trough in the 2011 Thai flood and interannual variability[J].Journal of Climate, 28(4): 1465-1476.DOI: 10.1175/jcli-d-14-00147.1 .
null
Takahashi H G, Yasunari T, 2008.Decreasing trend in rainfall over indochina during the late summer monsoon: impact of tropical cyclones[J].Journal of the Meteorological Society of Japan, Series II, 86(3): 429-438.DOI: 10.2151/jmsj.86.429 .
null
Torn R D, Davis C A, 2012.The influence of shallow convection on tropical cyclone track forecasts[J].Monthly Weather Review, 140: 2188-2197.DOI: 10.1175/MWR-D-11-00246.1 .
null
Valcke S, 2013.The OASIS3 coupler: a European climate modelling community software[J].Geoscientific Model Development, 6(2): 373-388.DOI: 10.5194/gmd-6-373-2013 .
null
Vancoppenolle M, Fichefet T, Goosse H, 2009a.Simulating the mass balance and salinity of Arctic and Antarctic Sea ice.2.Importance of salinity variations[J].Ocean Modelling, 27: 54-69.DOI: 10.1016/j.ocemod.2008.11.003 .
null
Vancoppenolle M, Fichefet T, Goosse H, 2009b.Simulating the mass balance and salinity of Arctic and Antarctic Sea ice.1.Model description and validation[J].Ocean Modelling, 27: 33-53.DOI: 10.1016/j.ocemod.2008.10.005 .
null
Yang RW, Zhang W K, Gui S, et al, 2018.Rainy season precipitation variation in the Mekong River basin and its relationship to the Indian and East Asian summer monsoons[J].Climate Dynamics, 50(9): 5691-5708.DOI: 10.1007/s00382-018-4471-1 .
null
Zhang C, Wang Y, 2017.Projected future changes of tropical cyclone activity over the western North and South Pacific in a 20-km- mesh regional climate model[J].Journal of Climate, 30: 5923-5941.DOI: 10.1175/JCLI-D-16-0597.1 .
null
陈子凡, 王磊, 李谢辉, 等, 2022.西南地区极端降水时空变化特征及其与强ENSO事件的关系[J].高原气象, 41(3): 604-616.DOI: 10.7522/j.issn.1000-0534.2022.00004.Chen Z D ,
null
Wang L, Li X H, et al, 2022.Spatiotemporal change characteristics of extreme precipitation in south-western China and its relationship with intense ENSO events[J].Plateau Meteorology, 41(3): 604-616.DOI: 10.7522/j.issn.1000-0534.2022.00004 .
null
董广涛, 陈伯民, 陈葆德, 2012.区域气候模式RegCM3在华东地区夏季的10年回报和2010年业务预报[J].高原气象, 31(6): 1601-1610.
null
Dong G T, Chen B M, Chen B D, 2012.Application of Regional Climate Model (RegCM3) on 10-year hindcast experiment and a real-time operation in summer of 2010 in the Eastern China[J].Plateau Meteorology, 31(6): 1601-1610.
null
雷显辉, 宋敏红, 张少波, 2022.夏季南亚高压和西太副高活动特征指数与中国东部降水分布的联系[J].高原气象, 41(2): 489-501.DOI: 10.7522/j.issn.1000-0534.2021.00099.Lei X H ,
null
Song M H, Zhang S B, 2022.Association between summer activity characteristic indices of the South Asia High and the West Pacific Subtropical High and precipitation distribution in Eastern China[J].Plateau Meteorology, 41(2): 489-501.DOI: 10. 7522/j.issn.1000-0534.2021.00099 .
null
李翠华, 蔡榕硕, 陈际龙, 2010.东中国海夏季潜热通量的时空特征及其与中国东部降水的联系[J].高原气象, 29(6): 1485-1492.
null
Li C H, Cai R S, Chen J L, 2010.Temporal and spatial characteristics of latent heat flux in the East China Sea and its association with summer rainfall in East China[J].Plateau Meteorology, 29(6): 1485-1492.
null
李耀东, 刘健文, 高守亭, 2004.动力和能量参数在强对流天气预报中的应用研究[J].气象学报, 62(4): 401-409.DOI: 10.11676/qxxb2004.041.Li Y D ,
null
Liu J W, Gao S T, 2004.On the progress of application for dynamic and energetic convective parameters associated with severe convective weather forecasting[J].Acta Meteorologica Sinica, 62(4): 401-409.DOI: 10. 11676/qxxb2004.041 .
null
栾澜, 孟宪红, 吕世华, 等, 2017.青藏高原一次对流降水模拟中边界层参数化和云微物理的影响研究[J].高原气象, 36(2): 283-293.DOI: 10.7522/j.issn.1000-0534.2016.00086.Luan L ,
null
Meng X H, Lü S H, et al, 2017.Impacts of microphysics and PBL physics parameterization on a convective precipitation over the Qinghai-Tibetan Plateau[J].Plateau Meteorology, 36(2): 283-293.DOI: 10.7522/j.issn.1000-0534.2016.00086 .
null
齐庆华, 蔡榕硕, 张启龙, 2013.华南夏季极端降水时空变异及其与西北部太平洋海气异常关联性初探[J].高原气象, 32(1): 110-121.DOI: 10.7522/j.issn.1000-0534.2012.00012.Qi Q H ,
null
Cai R S, Zhang Q L, 2013.Primarily analyses on variations of summer extreme precipitation in South China and its relation to the sea-air anomaly in northwestern Pacific Ocean[J].Plateau Meteorology, 32(1): 110-121.DOI: 10.7522/j.issn.1000-0534.2012.00012 .
null
孙辉, 刘晓东, 刘长海, 等, 2013.青藏高原夏季降水日变化的高分辨率数值模拟[J].热带气象学报, 29(6): 130-140.
null
Sun H, Liu X D, Liu C H, et al, 2013.High-resolution numerical simulation of the diurnal cycle in summertime precipitation over the Tibetan plateau[J].Journal of Tropical Meteorology Journal of Tropical Meteorology, 29(6): 130-140.
null
田高山, 陈耀登, 高庆九, 等, 2022.混合截断尺度Blending方案及其在西南区域模式中的应用[J].高原气象, 41(6): 1630-1641.DOI: 10.7522/j.issn.1000-0534.2022.00005.Tian G S ,
null
Chen Y D, Gao Q J, et al, 2022.Blending scheme with mixed truncation scale and its application in southwest regional model[J].Plateau Meteorology, 41(6): 1630-1641.DOI: 10.7522/j.issn.1000-0534.2022.00005 .
null
王志福, 钱永甫, 林惠娟, 2008.区域海气耦合模式对我国极端降水模拟分析[J].高原气象, 27(1): 113-121.
null
Wang Z F, Qian Y F, Lin H J, 2008.Analysis of numerical simulation on extreme precipitation in China using a coupled regional ocean-atmosphere model[J].Plateau Meteorology, 27(1): 113-121.
null
夏阳, 严小冬, 刘芷含, 等, 2023.中国西南贵州地区冬季凝冻日数的气候特征及其异常成因[J].高原气象, 42(1): 173-185.DOI: 10.7522/j.issn.1000-0534.2022.00028.Xia Y ,
null
Yan X D, Liu Z H, et al, 2023.Climatic characteristics of winter freezing days in Guizhou in south west China and their anomalous causes[J].Plateau Meteorology, 42(1): 173-185.DOI: 10. 7522/j.issn.1000-0534.2022.00028 .
null
严小冬, 宋燕, 黄晨然, 等, 2017.贵州省冬季气温的时空特征及其与海气的关系[J].高原气象, 36(5): 1336-1345.DOI: 10. 7522/j.issn.1000-0534.2016.00122.Yan X D ,
null
Song Y, Huang C R, et al, 2017.Temporal and spatial characteristics of winter temperature in Guizhou and its relationships with ocean and atmosphere[J].Plateau Meteorology, 36(5): 1336-1345.DOI: 10. 7522/j.issn.1000-0534.2016.00122 .
null
阴蜀城, 李茂善, 刘啸然, 等, 2020.2014年8月7日那曲地区对流云降水及其云微物理过程的数值模拟[J].高原气象, 39(1): 51-60.DOI: 10.7522/j.issn.1000-0534.2019.00062.Yin S C ,
null
Li M S, Liu X R, et al, 2020.Numerical simulation of cloud precipitation and cloud microphysical process in Nagqu Area on August 7, 2014[J].Plateau Meteorology, 39(1): 51-60.DOI: 10. 7522/j.issn.1000-0534.2019.00062 .
null
尤红, 姜丽萍, 彭端, 等, 2007.2005年6月广东特大暴雨垂直螺旋度分析[J].气象, 33(4): 71-76.YouH, JiangL P, PengR, et al, 2007.Analysis of vertical helicity for "05?6" heavy rainstorm process over Guangdong[J].Meteorological Monthly, 33(4): 71-76.
null
岳彩军, 郭煜, 寿绍文, 等, 2011.螺旋度在我国多种灾害性天气研究中的应用进展[J].暴雨灾害, 30(2): 107-116.
null
Yue C J, Guo Y, Shou S W, et al, 2011.Progress in application study of helicity to severe weathers[J].Torrential Rain and Disasters, 30(2): 107-116.
null
张天宇, 王雨潇, 孙营营, 等, 2023.1998-2020年三峡库区小时极端降水时空变化特征分析[J].高原气象, 42(1): 108-115.DOI: 10.7522/j.issn.1000-0534.2022.00019.Zhang T Y ,
null
Wang Y X, Sun Y Y, et al, 2023.Temporal and spatial variation characteristics of hourly extreme precipitation in the Three Gorges Region in 1998-2020[J].Plateau Meteorology, 42(1): 108-115.DOI: 10.7522/j.issn.1000-0534.2022.00019 .
null
邹立维, 周天军, 2012.一个区域海气耦合模式的发展及其在西北太平洋季风区的性能检验: 不同大气分量的影响[J].中国科学: 地球科学, 42(4): 614-628.
null
Zou L W, Zhou T J, 2012.Development and evaluation of a regional ocean-atmosphere coupled model with focus on the western North Pacific summer monsoon simulation: impacts of different atmospheric components[J].Science China Earth Sciences, 42(4): 614-628.
文章导航

/

〈 〉