1 引言
2 大气化学天气耦合的同化和模式简介
2.1 大气化学天气耦合模式
表1 预报模式参数设置Table 1 The model configuration |
| 模式选项 | 参数配置 |
|---|---|
| 短波辐射方案 | Dudhia短波辐射方案 |
| 长波辐射方案 | RRTM长波辐射方案 |
| 云微物理方案 | Thompson方案 |
| 陆面过程方案 | NOAH方案 |
| 近地面层方案 | 莫宁-奥布霍夫方案 |
| 积云对流参数化方案 | Kain-Fritsch (new Eta) 方案 |
| 边界层方案 | MRF边界层方案 |
2.2 大气化学天气耦合的同化系统
3 AOD资料及其观测算子的构建
3.1 观测资料情况
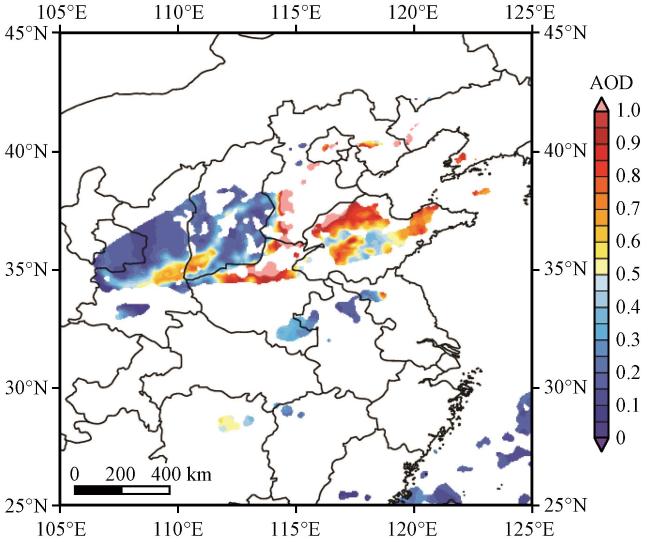
图1 2020年12月18日03:00 Himawari-8星AOD观测水平分布Fig.1 Horizontal distribution of Himawari-8 AOD at 03:00 on 18 December 2016 |
3.2 观测算子的构建
3.3 AOD观测误差
4 分析预报试验
4.1 试验方案和检验方法
表2 同化试验方案Table 2 Assimilation experiments scheme |
| 使用资料种类 | 简称 | |
|---|---|---|
| 试验1 | 探空/测风、 地面、 船舶、 云导风 | CTL |
| 试验2 | 试验1基础上增加Himawari-8的AOD | AOD |
| 试验3 | 试验1基础上增加地基气溶胶观测PM2.5和PM10 | PM |
| 试验4 | 试验1基础上增加地基气溶胶观测PM2.5 、 PM10及Himawari-8的AOD | PMAOD |
表3 同化分析所使用的观测种类及站点数Table 3 Types of observations and number of stations used in the assimilation analysis |
| 观测资料类型 | 同化的观测变量 | 同化使用的观测站点数/个 |
|---|---|---|
| Temp/pilot | U/(m·s-1)、 V/ m·s-1)、 T/℃、 RH/% | 250 |
| Synop | U/(m·s-1)、 V/m·s-1、) Ps/hPa、 RH/% | 3693 |
| Ships | U/(m·s-1)、 V/m·s-1)、 Ps/hPa、 RH/% | 78 |
| Satob | U/(m·s-1)、 V/(m·s-1) | 1786 |
| AOD | AOD | 1943 |
| PM | PM2.5/(µg·m-3)、 PM10/(µg·m-3) | 1334 |
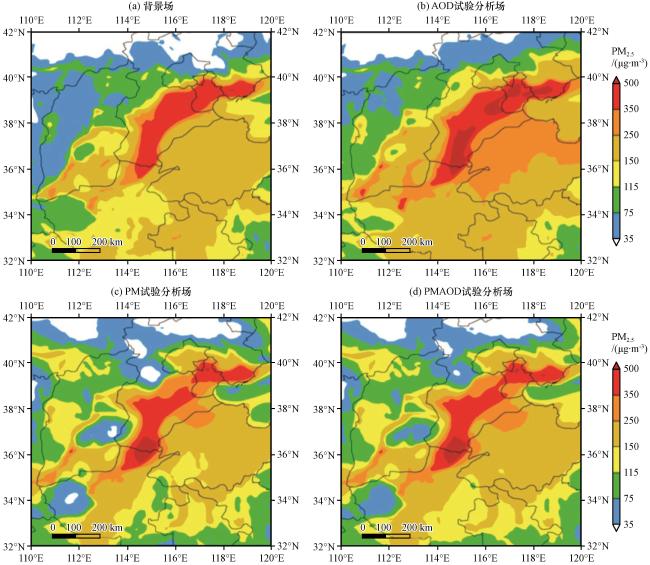
图3 2016年12月18日00:00控制试验 PM2.5背景场(a)及同化试验PM2.5分析场(b~d)水平分布(单位: μg·m-3)(a)控制试验背景场, (b)AOD试验分析场, (c)PM试验分析场, (d)PMAOD试验分析场Fig.3 The distribution of PM2.5 background for control experiment (a) and analysis of PM2.5 for assimilation experiments at 00:00 on 18 December 2016 (unit: μg·m-3).(a)the background of control experiment, (b) the analysis of AOD experiment, (c) the analysis of PM experiment, (d) the analysis of PMAOD experiment |
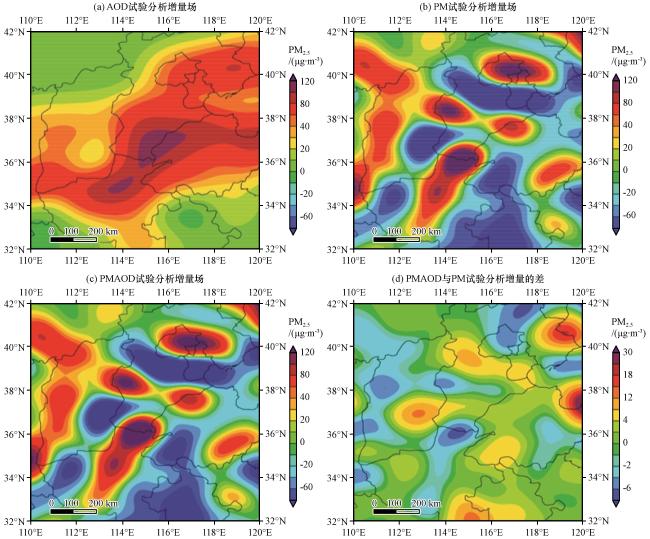
图4 2016年12月18日00:00同化试验PM2.5的分析增量(a~c)及PMAOD和PM试验分析增量差(d)的水平分布(单位: µg·m-3)(a)AOD试验分析增量场, (b)PM试验分析增量场, (c)PMAOD试验分析增量Fig.4 The distribution of PM2.5 analysis increments(a~c) and the difference between analysis increments of PMAOD and PM experiment (d) at 00:00 on 18 December 2016 (unit: µg·m-3).(a) the analysis increments for AOD experiment, (b) the analysis increments for PM experiment, (c) the analysis increments for PMAOD experiment |
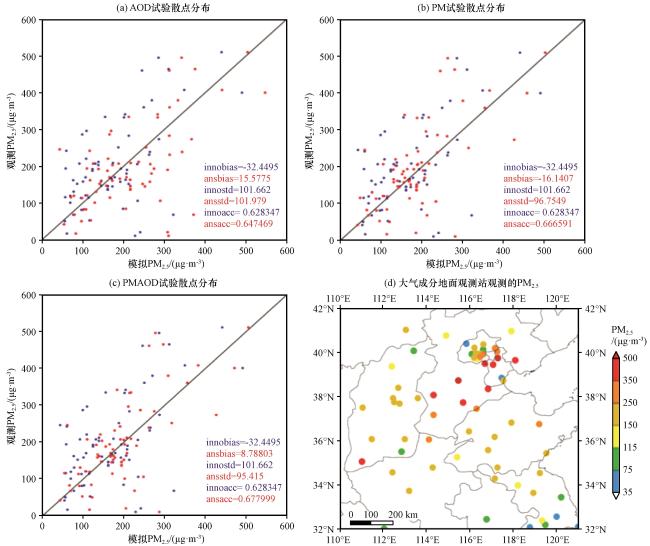
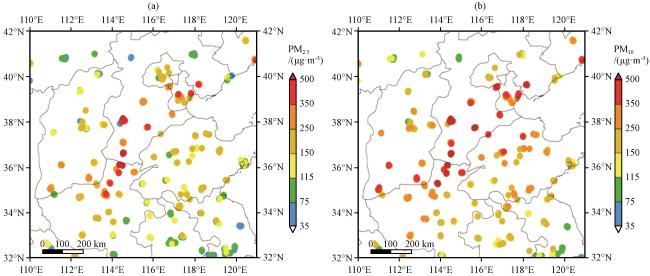
图5 2016年12月18日00:00检验区域内PM2.5的站点观测与插值到站点的模拟值的散点分布(a~c)及用于检验的地面观测站PM2.5分布(d) (单位: µg·m-3)(a)AOD试验散点图, (b)PM试验散点图, (c)PMAOD试验散点图, (d)大气成分地面观测站观测的PM2.5Fig.5 Scatter of simulation-observation of PM2.5 concentrations at 00:00 18 December 2016, and the distribution of PM2.5 at observatories(d).Uunit: µg·m-3.(a) scatter of simulation-observation for AOD, (b) scatter of simulation-observation for PM, (c) scatter of simulation-observation for PMAOD, (d) PM2.5 from atmospheric composition observatory |
4.2 同化结果分析
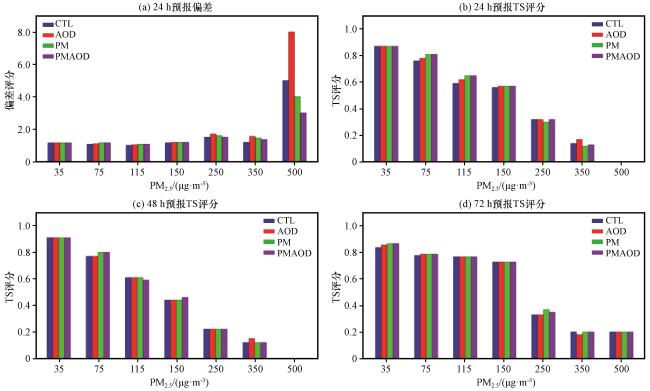
4.3 预报结果检验
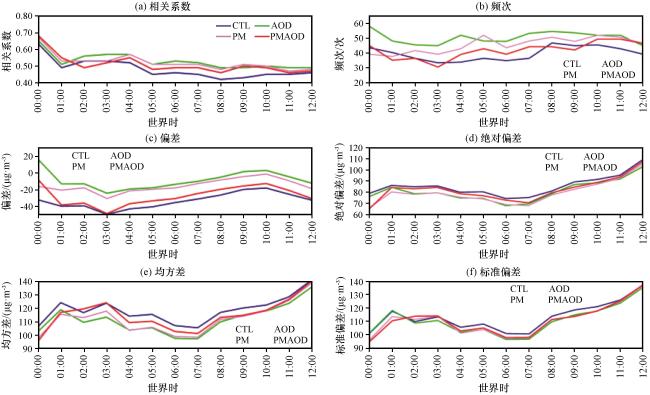
图6 2016年12月18日00:00起报PM2.5 12 h预报场与实况观测逐小时统计结果对比 (a)相关系数, (b)频次, (c)偏差, (d)绝对偏差, (e)均方差, (f)标准偏差Fig.6 The statistical results of 12-hour forecast initiated at 00:00 on 18 December 2016.(a) correlation coefficient, (b) frequency, (c) deviation, (d) absolute deviation, (e) mean square deviation, (f) standard deviation |