
1 引言
大气边界层作为大气的最底层, 在天气和气候研究中扮演着至关重要的角色(车军辉等, 2021)。它是地表与大气之间相互作用最直接的区域, 其内部动力过程可对天气系统产生显著影响(Shepherd, 2014), 其下垫面的热量和水分交换则直接影响气候变化过程(Serafin et al, 2018)。因此, 对大气边界层特征的认识和理解是认清天气演变和气候变化的重要基础(Davy, 2018)。利用各种手段针对不同地理位置、 不同气候条件下的大气边界层特征的研究从未停止(李雪洮等, 2020; 伏薇等, 2022; 戴进等, 2023)。
南极独特的地理位置和极端气候条件使其在理解全球气候变化机制方面具有重要价值(李菲等, 2021)。南极地区对调节全球大气和海洋环流具有关键作用, 是全球气候系统至关重要的一环(Marshall et al, 2017)。由于其在全球气候系统中的敏感性, 南极一直受到国际上学者的广泛关注(Turner et al, 2014)。当前全球气候急剧变化背景下, 南极大陆的低层大气状况特征成为越来越多人关注和讨论的焦点(Ritter et al, 2016)。
南极地区的低层大气由于其特殊的地理和气候条件表现出了鲜明和独特的特点。当寒冷空气沿着山谷下沉时, 常常会形成强烈的下降风, 这种现象在南极的某些特定地区表现得尤为突出(Parish, 1988)。此外, 由于南极长时间的日照或持续的黑夜, 其风的日变化与其他地方存在显著的差异(Broeke et al, 2004)。在温度方面, 夜间长时间的辐射冷却常常导致南极出现低层温度低于稍高大气层的逆温现象, 这一现象在南极极为常见(Nicolas and Bromwich, 2014)。另外, 受到雪、 冰覆盖以及海冰和海洋的综合影响, 南极地区的湿度变化同样具有其独特性(Lachlan-Cope, 2010)。
为了深入理解极地气候系统中的能量交换、 气象过程及其对全球气候变化的响应, 改进气候模型的预测能力并为极地科学研究提供关键数据, 针对南极中山站边界层气象要素的研究从未停止。卞磊(2020)于2008 -2009年南极中山站的气象观测资料, 对该站周围风、 温度、 湿度、 气压等气象要素的变化特征进行了统计与分析。Li et al(2023)利用相干多普勒激光雷达测风系统对获取了2020年南极中山站的风速数据, 对系统进行验证的同时进行了一定的统计分析。Étienne et al(2019)通过分析9个南极站点8年的探空气球数据对东南极沿海边缘低对流层上至3 km的精细垂直结构进行了大规模描述。该研究显示, 不同站点(如山地降风区、 冰架上和地形复杂区域)的风速、 温度和湿度剖面具有显著的空间变异性。与其重要性形成对比, 在研究南极地区大气低层气象要素方面, 目前的研究中仍然存在一些问题。尽管有一些研究关注了这一地区的气象特性, 但对于大气低层的详细气象要素, 尤其是高时空分辨率特性的理解仍然有限。目前对边界层高度的变化模式、 急流轴的具体特征、 逆温层的厚度及其特性, 以及湿度随高度变化的细节等了解仍然相对较少。这些要素对于理解和准确预测南极地区的气候系统至关重要。
本文利用中山站2018 -2019年夏季收集的大气探空数据, 分析了南极地区低层大气的风、 温度和湿度的廓线特征, 研究了中山站夏季逆温层和急流轴的变化状况。
2 数据选取与方法介绍
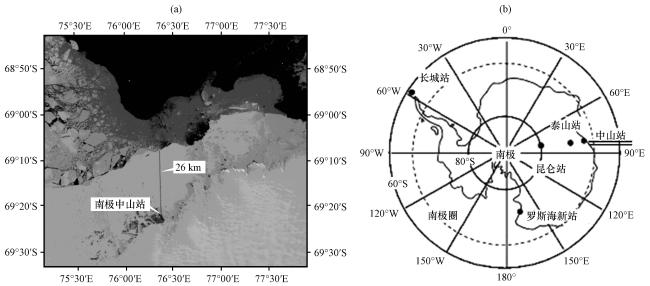
中山站是中国在南极洲继长城站开辟的第二个科考站, 位于南极大陆东部的拉斯曼丘陵地区(69°22′S, 76°22′E), 平均海拔约11 m, 其地理位置与周边地形如图1(a)所示。作为中国规模最大的南极考察基地, 长期进行了大量的科学观测和研究。本研究主要基于2018年11月至2019年2月及2019年12月南极中山站的夏季大气探空数据。这期间, 每日10:00(当地时, 下同)和16:00分别释放一次探空气球, 探空气球以1 Hz的频率记录海拔、 气压、 气温、 相对湿度、 露点温度、 混合比、 风向、 风速、 经度和纬度。本研究主要关注自地面起3000 m范围内的气象要素特征。为了确保所得数据具有较高的可靠性、 连续性和可比性, 同时为了更精细地捕捉到气象要素在垂直方向上的变化, 对原始数据进行了质量控制与插值。对于廓线中的任意一个数据, 计算其上下5个数据加上其本身共11个数据的标准差与平均值, 如果该数据与平均值的偏差超过3个标准差, 则将该数据剔除; 随后采取线性插值的方法进行处理, 将经过质量控制的观测数据每隔25 m进行插值, 最终形成了一份由120层数据构成的详尽垂直剖面图。
本文对低空急流的判断基于Tuononen et al(2015)的定义: 若风速廓线中的某一局部最大值大于其上下两侧的极小值2 m·s-1以上, 并且这个差值超过了相应极小值的25%, 则认定为出现了一次低空急流。这个局部最大值的风速被定义为急流强度, 而其出现的高度被认为是急流高度。当一条廓线中存在超过一层急流时, 选择最下层的急流作为本次观测中的急流, 并选取上方急流中急流强度最大的用于研究多层急流。
本文逆温层的判断依据Kahl(1990)的标准: 将温度随高度变率为正(即温度随高度升高而增大)的最低高度定义为逆温层底高度, 对应的温度定义为逆温层底温度; 在逆温层上方, 温度随高度变率为负(即温度随高度升高而减小), 将其高度定义为逆温层顶高度, 对应的温度定义为逆温层顶温度; 逆温层底与逆温层顶之间的高度差与温度差分别记为逆温层厚度和逆温层温差。由于极地温度剖面经常表现出复杂的垂直结构(Graversen et al, 2008), 在低层的逆温层中经常存在正的温度递减层, 参考Kahl(1990)的做法, 如果这些层很薄(临界厚度定为100 m), 则忽视它们。对于一次探测中出现多层逆温的情况, 参考对急流的处理, 主要分析最下层的逆温层与上方最强的逆温层。
为研究低层大气的湿度特征, 本文还对低层大气的比湿数据做了如下处理: 对于某一高度, 计算其上方100 m与下方100 m处比湿值的差, 记作该高度处的比湿梯度。对于某次探空中比湿梯度的极大值对应的高度, 称作该次探测的湿度分层高度, 表示比湿在该高度附近发生了明显的变化。
边界层高度(Boundary Layer Height, BLH)是大气边界层中非常关键的一个参数, 它影响着近地面的风速、 温度、 湿度等气象要素的分布, 也影响着空气污染物的扩散和消散。边界层高度的计算方法有很多种, 常见的方法包括: 低空急流法、 逆温法、 湿度分层法等。低空急流的位置可能接近边界层顶部, 通过分析低空急流的高度, 可能能够估计出边界层的高度(Xian et al, 2023)。逆温法是通过分析垂直温度剖面, 找到逆温层的位置, 通常边界层顶部会有一个温度逐渐下降的层也就是逆温层(Dai et al, 2014)。湿度分层也可以反映边界层的顶部: 包括湿度在内的气象要素在边界层内部的变化通常相对较小, 而在边界层顶部会出现较大的变化, 呈现明显的分层, 分析湿度的垂直分布可以用于判断边界层的高度(Ao et al, 2012)。此外, 还有湍流法、 稳定度参数法、 雷达或激光雷达观测等方法来确定边界层高度(Dai et al, 2011; Sun et al, 2021; Wang et al, 2012)。本研究分别采用低空急流法、 逆温法、 湿度分层法对边界层高度进行分析, 分别对应为急流高度, 逆温层底高度, 以及湿度分层高度。
3 结果
3.1 风温湿平均廓线特征
3.1.1 风速平均廓线特征
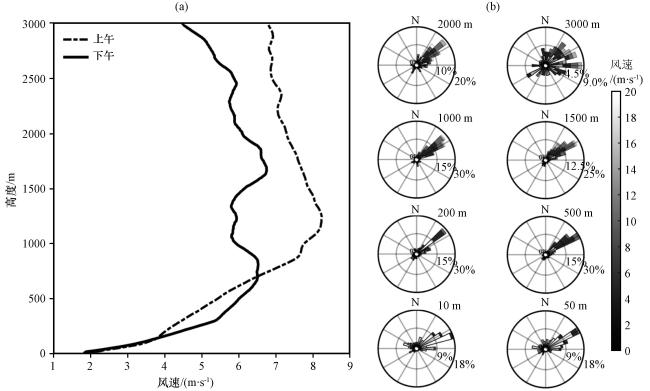
南极中山站观测期平均风速廓线与各高度层风玫瑰图如图2所示。通过观察上、 下午的风速廓线可以发现, 上午和下午风速廓线在地面附近均随高度快速增大, 上午在约1.2 km处达到最大, 而下午在约0.8 km处达到最大。从廓线中的风速极大值来看, 下午的风速较上午有所减小, 这可能与南极地区下降风的发展有关(As et al, 2005)。Savijärvi(2011)研究表明, 南极下降风具有明显的日变化特征, 通常清晨及上午较强, 而午后较弱。同时, 下午温度较大从而导致热对流更强(参见下一小节), 并进一步增强湍流交换, 更强的湍流交换从而使得下午边界层上层的风速随高度的分布更加均匀, 即风速的垂直梯度较小。从各个高度层的风玫瑰图来看, 中山站地区夏季主要受东方至东偏北方向来风的影响。在2000 m之下风向随高度变化不大, 但在3000 m处风向更加分散, 可能是由于气球上升之后具有了一定的漂移距离所导致的。
3.1.2 位温平均廓线特征
南极中山站观测期平均位温廓线如图3所示。在南极中山站地区夏季的低空大气中, 位温随高度变化的特征主要表现为两层。首先, 贴近地表的一段高度区域内存在一个超绝热层, 在这一层中位温随高度的增加迅速降低。此现象是可能是因南极夏季特有的持续日照造成的地表热量积累而形成的(邓海滨等, 2006)。超绝热层之上, 直到3000 m的高度, 位温呈逐渐递增趋势。并且随着高度的增加, 其温度梯度逐渐增大, 整层呈现为稳定层结, 并且未观察到明显的边界层顶逆温。这可能与中山站地区夏季边界层的高度变化幅度较大有关, 每天不同的边界层顶逆温在观测期的多日平均中被平滑, 从而没有在观测期平均位温廓线中显示。后文将细致探究边界层顶逆温层位置的变化状况。
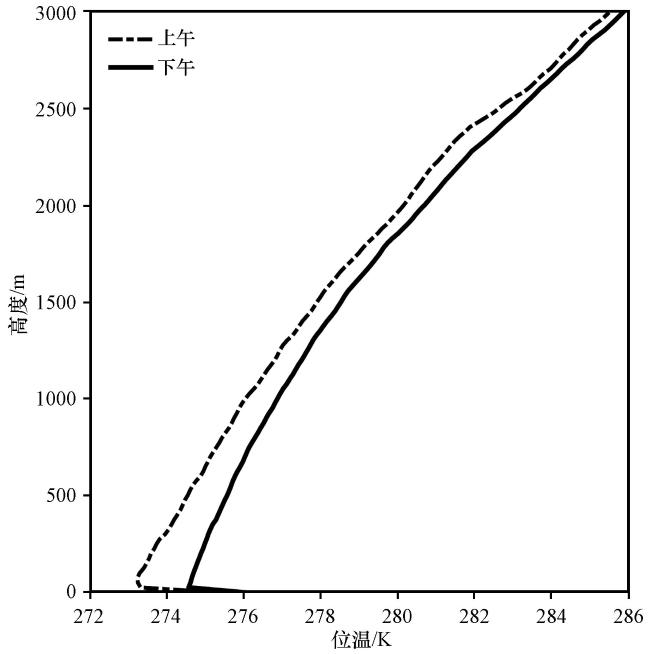
另外, 尽管上下午的位温廓线形状相似, 但上午的位温普遍低于下午。这一差异反映了日照对地面和低空大气的加热效应。到下午, 经过一个完整的日照周期, 地面和低空大气累积了更多的热量, 从而导致位温相对较高。
3.1.3 比湿平均廓线特征
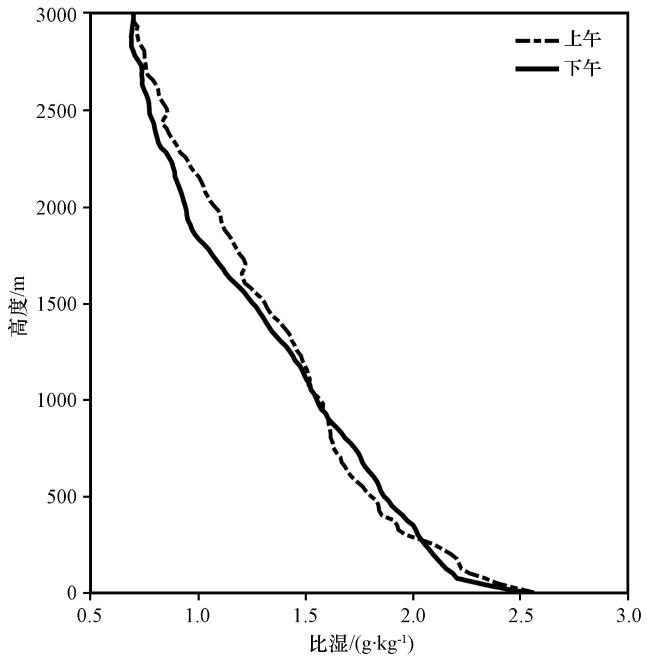
南极中山站观测期平均比湿廓线如图4所示。从总体上来看, 比湿随着高度的增加而递减, 在地面附近递减率较大, 在约250 m高度之上, 递减率随高度的变化较小。上午和下午比湿的大小区别较小, 两者之差基本不超过0.2 g·kg-1。从地面开始到约250 m高的大气范围内, 下午比湿低于上午, 可能与日照引起的地面加热和热对流有关(Theeuwes et al, 2019)。与上午相比, 下午的日照导致地面温度上升, 进而促使表层的水分蒸发增加。但与此同时, 地表的热对流也被加强, 将湿气带到更高的大气层, 导致这一层的比湿减小; 但到了250~800 m区间, 下午时段的比湿高于上午, 这则是由于下午的热对流和湍流将地面的湿气输送到这一高度范围内所致; 而在800~1000 m范围内, 上午和下午的比湿相近, 这可能说明这一层的湿气来源和去向在上下午间变化不大, 或者日间热对流的影响在这一高度减弱; 到达1000 m以上的高度层, 下午的比湿再次低于上午, 这可能与更高层的大气流动和混合过程有关, 例如下沉空气的影响, 或者与更上层的干燥空气混合(Varentsov et al, 2018)。与位温平均廓线类似, 比湿平均廓线整体上没有明显的分层特征。
3.2 逆温层特征
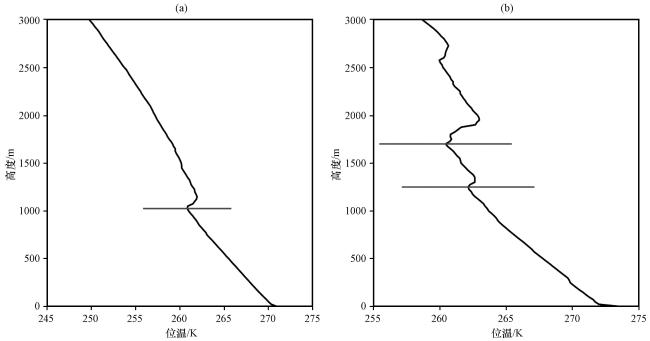
图6展示了中山站地区夏季逆温强度和逆温层高度的频次分布。从图6中可以看到, 逆温强度小于0.5 K·(100m)-1的频次最高, 达到34次, 随着逆温强度的增加, 频次逐渐减少。这表明较弱的逆温现象发生的次数更多, 而强度较大的逆温梯度较少。类似地, 最高频的逆温层厚度为小于200 m, 频次为21次。随着逆温层厚度的增加, 其出现的频次开始呈下降趋势, 但在800~1200 m高度区间出现了小幅的上升, 频次为8次。由图6可知, 较低强度和较低厚度的逆温层更易发生。然而, 也存在不规则的分布, 如800~1200 m的逆温层高度区间内频次的上升, 这可能指示有特定的大气条件或地形因素导致这一高度区间内逆温现象较为集中。
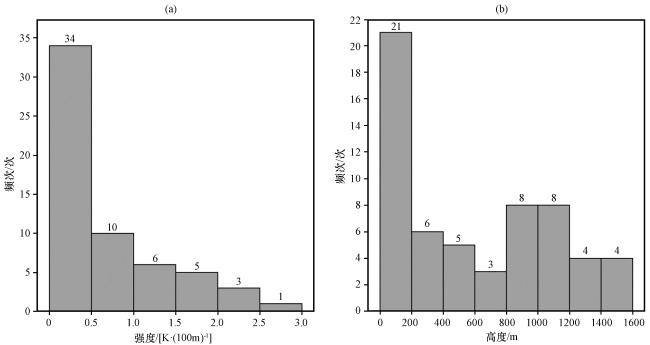
表1提供了关于南极地区逆温层在日内变化中的观测数据, 包括逆温的出现频率、 平均底高、 平均厚度和平均强度, 以及在发生多层逆温时, 第二层逆温层的相应数据。根据表格数据, 逆温层的出现频率在10:00较高, 达到69.2%, 而到了16:00略有下降, 为51.9%, 整体的平均出现频率为56.2%。这表明逆温层在上午更为常见, 这可能与夜间(或极昼日较低太阳高度角时)辐射冷却作用和白天(或极昼日较高太阳高度角时)太阳辐射强度增强之前的稳定条件有关。
表1 南极中山站地区夏季逆温数据统计表Table 1 Statistical table of inversion data during summer at Zhongshan Station, Antarctica |
| 单层逆温 | 多层逆温 | ||||||||
|---|---|---|---|---|---|---|---|---|---|
| 频率 /% | 平均底高 /m | 平均厚度 /m | 平均强度 /[K·(100m)-1] | 频率 /% | 第二层平均 底高/m | 第二层平均 厚度/m | 第二层平均强度 /[K·(100m)-1] | ||
| 上午 | 69.2% | 648.64 | 54.17 | 0.72 | 83.3% | 1970.45 | 118.18 | 0.72 | |
| 下午 | 51.9% | 576.25 | 47.50 | 0.89 | 75.6% | 1716.67 | 96.88 | 1.11 | |
| 全天 | 56.2% | 589.83 | 49.15 | 0.84 | 78.0% | 1856.25 | 110.42 | 0.94 | |
逆温的平均底高在上午为648.61 m, 到了下午稍有减少至576.25 m, 整体平均值为589.83 m。平均厚度从上午的54.17 m减少到下午的47.50 m, 整体平均值为49.15 m。逆温的平均强度在上午是0.72 K·(100m)-1, 在下午增加到0.89 K·(100m)-1, 整体平均值为0.84 K·(100m)-1。这些数据表明上午逆温层较厚且较远离地面, 而下午逆温层变薄且强度增加。这主要是由于中山站下午太阳高度角更大, 地面温度更高, 湍流较强, 从而形成了逆温梯度更大的逆温层(Anquetin et al, 1998)。
在出现至少一层逆温的探测中, 多层逆温的出现频率在上午为83.3%, 而下午减少至75.6%, 整体出现频率为78.0%。多层逆温出现的频率较高, 这可能说明第二层逆温层更为稳定且不易受日内变化的影响, 该多层逆温似乎与多层急流有关, 急流引起的风切变产生的湍流在其上亦可形成逆温层。与底层的逆温相比, 不论在上午还是下午, 还是从总体上看, 第二层逆温的平均厚度和平均强度基本高于第一层逆温, 仅在上午时第二层逆温的强度与底层逆温相当, 均为0.72 K·(100m)-1。这意味着更高层的逆温通常更厚且强度更大。
3.3 急流特征
低空急流通常定义为在近地层以上的较低大气中强而窄的气流带。与逆温层类似, 低空急流也可归类为在低层大气中只发生一次的单层急流, 以及发生超过一次的多层急流。
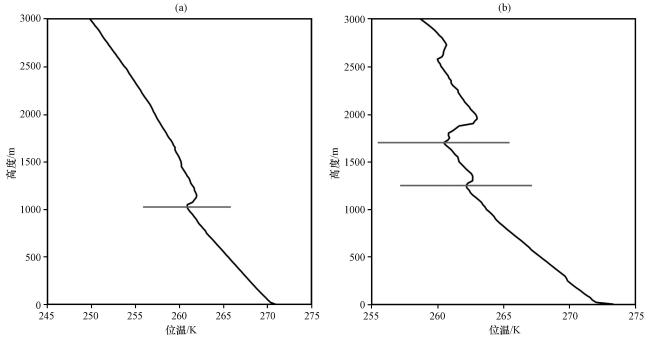
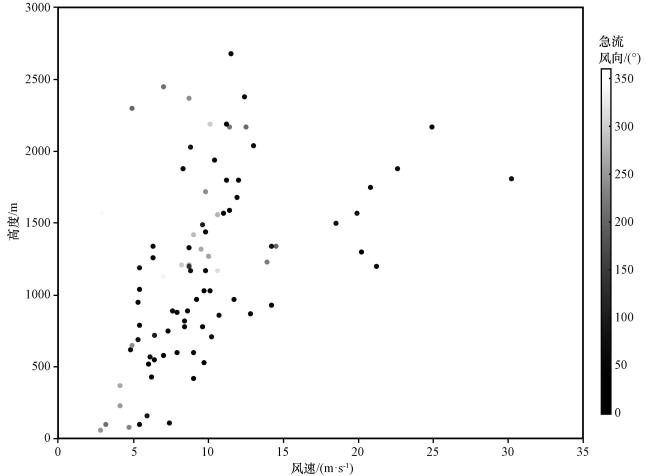
图8通过散点图分析揭示了中山站地区夏季低空急流风速、 高度及风向之间的关联。风速范围分布广泛, 涵盖几乎无风到超过30 m·s-1的强风, 但是中等风速(10~15 m·s-1)的数据点比较密集, 并且这部分风速在中等高度区间(500~2000 m)的频率较高, 表明该区间为低空急流的主要活动层。高风速(>20 m·s-1)出现较少, 并且倾向于在1000 m以上的较高层出现。低空急流的风速与出现的高度在一定程度上呈现出线性关系。这一方面是由于在大气边界层内, 由于地表摩擦影响的减弱, 风速通常随着高度的增加而增加(Kallistratova et al, 2013), 另一方面是由于地形的影响, 坡面的抬升可以加强沿着其轴线的风速(Aird et al, 2021), 中山站毗邻拉斯曼丘陵, 可能导致风速随高度的增加而线性增加。在风向方面, 大部分数据点呈现出深色, 这意味着在观测期间内, 中山站大多数时间面临来自东方至东偏北方向的风。尽管在整个数据中风向分布广泛, 但该风向占据了主导地位。
低空急流在不同风速与高度上的频率分布如图9所示。二者都表现出较为集中的频率分布。大多数风速值聚集在 8~12 m·s-1范围内, 此区间内的观测频次达到最大值, 为41次。相对较低(<4 m·s-1)和较高(>20 m·s-1)风速值的出现频率显著降低, 表明中山站夏季急流倾向于形成在一个相对稳定的风速范围内。高度分布的数据显示, 急流主要出现在600~1600 m 的中等高度层, 其中1200~1400 m 高度区间的频次最高。相对的, 高度低于 400 m 或超过 2200 m 的急流事件较少。
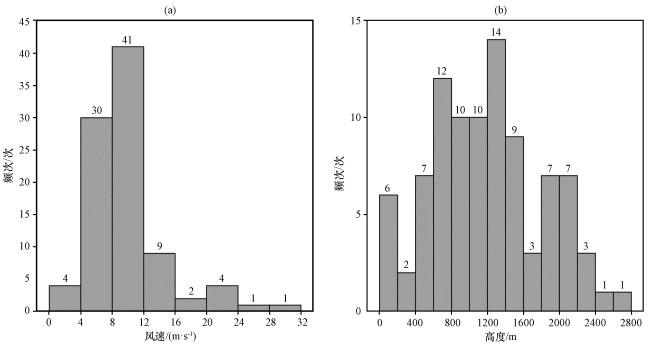
表2展示了低空急流日内变化以及急流在不同层次上的频率和动力特性。在10:00的观测中, 急流出现的频率为57.7%, 平均高度约为421.33 m, 而平均风速为10.29 m·s-1。16:00, 急流的出现频率稍有下降至51.9%, 平均高度上升至616 m, 与此同时平均风速略减至9.17 m·s-1。
表2 南极中山站地区夏季低空急流数据统计表Table 2 Statistical table of low-level jet data during summer at Zhongshan Station, Antarctica |
| 单层逆温 | 多层逆温 | ||||||
|---|---|---|---|---|---|---|---|
| 频率/% | 平均高度/m | 平均强度/(m·s-1) | 频率/% | 第二层平均高度/m | 第二层平均强度/(m·s-1) | ||
| 上午 | 57.7% | 421.33 | 10.29 | 26.7% | 1860.00 | 7.78 | |
| 下午 | 51.9% | 616.00 | 9.17 | 4.9% | 840.00 | 9.65 | |
| 全天 | 53.3% | 536.79 | 9.40 | 10.7% | 1520.00 | 8.40 | |
多层急流方面, 在出现低空急流的探测中, 多层急流在上午的发生频率达到26.7%, 而下午仅有4.9%, 并且平均高度也发生了从上午的1860 m到下午的840 m的显著降低。这种减少可能与大气稳定度的变化有关, 随着下午地面热力作用的增强, 大气对流层可能更加均匀, 不利于多层急流的维持。整体上, 多层急流的发生频率为10.7%, 第二层急流的平均高度在1520 m。在风速方面, 第二层急流在上午的平均风速为7.78 m·s-1, 下午则增加至9.65 m·s-1。这一增加可能指示了更强的垂直运动和对流活动, 从而在较高层产生了更强的风速。
3.4 湿度分层特征
为了研究湍流分层在湿度数据中的体现, 对于廓线中的任意高度, 我们计算其上方100 m与下方100 m之间比湿度的差值, 记为该高度处的比湿梯度。对于比湿梯度最大值出现的高度, 我们视为湿度在此处发生了明显的分层, 记为湿度分层高度。下方展示了与前文列出的单次分层与多次分层所用个例同一次探测中的湿度情况, 湿度分层高度在图中使用红线标注。2019年2月4日16:00的比湿与相对湿度探空廓线[图10(a), (b)]可以看到二者存在明显的对应关系。在湿度分层高度处, 二者的廓线都发生了较为显著的突变, 并且该高度与逆温层高度和低空急流高度存在一致性。2019年12月4日10:00的比湿与相对湿度探空廓线[图10(c)与图10(d)]也呈现出同样的特征, 注意到该时刻存在两层急流和逆温层, 湿度分层主要出现在1700 m的急流和逆温层处。
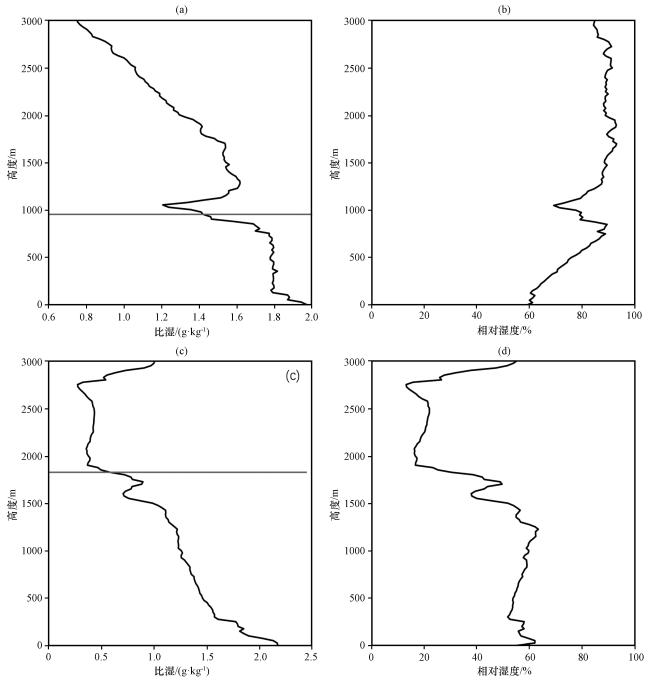
图10 2019年2月4日16:15(a), 12月4日10:15(c)南极中山站比湿探空曲线, 2月4日16:15(b)和12月4日10:15(d)相对湿度探空曲线图中横线为湿度分层高度 Fig.10 Sounding curves of specific humidity (a, c) at Zhongshan Station, Antarctica on February 4, 2019 at 16:15 (a) and on December 4, 2019 at 10:15 (c), Relative humidity (b, d) on February 4, 2019 at 16:15 (b) and on December 4, 2019 at 10:15 (d).The horizontal lines in the graphs indicate the heights of humidity stratification |
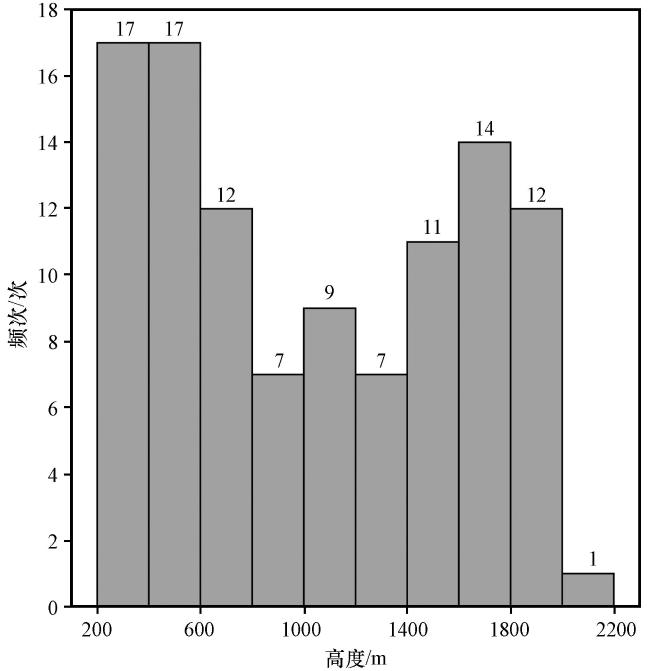
图11展示了低层大气湿度分层高度在不同高度上的频次分布, 在0~2200 m的高度范围内, 湿度分层的频次随高度的增加呈现出不均匀的变化趋势。在较低的高度(200~600 m), 湿度分层的频次较高, 特别是在200 m高度处, 频次达到了17次, 这可能是由于靠近地面的空气受到了地表的直接影响, 导致了湿度的增加。在600~1400 m的中间高度范围内, 湿度分层的频次有所下降。在这个区间内, 最低的频次出现在1000 m和1200 m的高度, 均为7次。这种趋势可能反映了随着离地面的距离增加, 地面的影响减弱, 而大气中水汽的垂直分布更加均匀。然而, 在1400~2000 m的较高高度, 湿度分层的频次再次增加。
4 结论与展望
本文分析了2018 -2019年在南极中山站收集的大气探空数据, 研究了南极低层大气的风、 温度和湿度特性, 以及逆温层、 低空急流和湿度分层的特征。结果表明, 该地区的风速在地面附近随高度快速增大, 其中上午风速在约1.2 km处达到最大, 而下午则在约0.8 km处最大, 下午风速相对减小, 这可能与下降风的发展和更强的热对流导致的湍流交换增强有关。低空急流的分析揭示了在特定高度(如1000 m和1200~1700 m区间)存在明显的风速峰值, 表明这些高度是低空急流的主要活动层, 且急流倾向于形成在相对稳定的风速范围内(8~12 m·s-1), 主要出现在800~1600 m的高度层。此外, 风廓线还存在多层急流的现象。
从多日平均位温廓线来看, 在地表附近有一个超绝热层, 其特点是位温随高度的增加迅速降低, 这主要是由于南极夏季持续的日照导致地表热量积累所致, 在超绝热层之上位温随高度增加而增加。对单日温度廓线的进一步分析揭示了该站点普遍存在湍流逆温, 并呈现出显著的日内变化。上午时段逆温层的出现频率较高, 逆温层较厚且更接近地面。到了下午, 随着太阳辐射的加强和地面温度的升高, 逆温层变得更薄但强度有所增加。此外, 温度廓线也存在多层逆温现象, 与多层急流相吻合。频次分析显示, 较弱的逆温层[强度小于0.5 K·(100m)-1]出现次数最多, 而逆温层的厚度通常较薄(小于200 m), 这反映出在南极中山站地区, 较弱且薄的逆温层更常见。
湿度的观测数据显示, 比湿从地面向上随高度递减, 其中地面附近至250 m高度的递减率较大, 而在更高层次, 比湿的递减率变小, 表明了湿度分布的非均匀性。日变化分析指出, 上午与下午的比湿差异不大, 两者之差基本不超过0.2 g·kg-1, 仅在部分同高度层存在一些差异。此外, 通过比湿梯度分析发现, 湿度发生明显分层的高度与逆温层及低空急流高度也较为一致, 显示了湿度分层与大气其他动力学过程的联系。湿度分层的频次在不同高度上呈现不均匀分布, 特别是在200~600 m较低高度区域频次较高, 反映了地表直接影响下的湿度增加, 而在更高的高度范围内, 湿度分层现象的变化表明了水汽垂直分布的复杂性。
本研究基于观测数据对南极地区低层大气风温湿廓线特征进行了分析, 结果有助于进一步理解极地气象特征, 认清极地大气动力机制, 并为模式校验和改进提供观测基础。由于资源和技术的限制, 本研究的观测数据局限在低层大气, 而高层大气的动态研究对于完整的气候分析同样至关重要。南极地区的大气垂直结构复杂, 上层大气的风温湿特征与低层可能存在显著差异, 并起到不同的作用, 这种差异对于理解全球气候系统的运作模式极为关键。此外, 本研究采用的是季节性的时间跨度, 这在一定程度上限制了我们对于气候变化趋势的长期预测能力。未来的研究应当考虑多年周期的数据收集, 以揭示长期气候变化的模式。考虑到气候变化的非线性和不可预测性, 长期数据的积累对于构建更为精确的气候模型、 提高预测准确性以及制定有效的气候应对策略至关重要。总之, 要全面揭示该地区大气特性对全球气候系统的影响, 仍需进一步的广泛研究。我们期望未来的工作能够在本研究的基础上, 通过更深入的理论分析和数据收集, 拓展我们的认知边界, 为气象行业的发展做出更多贡献。